Patient Protocol and Clinical Data Collection
From June 2018 to September 2021, first-episode, untreated SCZ patients and age-matched healthy controls were recruited via advertisements at Hangzhou Seventh People's Hospital and West China Hospital. SCZ diagnosis was established based on the Diagnostic and Statistical Manual of Mental Disorders, Fifth Edition (DSM-5). Eligibility criteria for SCZ included: (1) no prior antipsychotic treatment or only minimal exposure (≤ 3 days at a low dose) before enrollment; (2) age below 18 years; and (3) a Wechsler Intelligence Scale score of ≥ 70. Exclusion criteria included: (1) major psychiatric disorders other than SCZ, (2) severe physical or autoimmune diseases, (3) CNS disorders, (4) recent immune-altering medications, vaccines (≤ 1 month), or acute infections (≤ 2 weeks), and (5) pregnancy or menstruation.
All participants were evaluated for psychiatric disorders using the Structured Clinical Interviews for DSM-5 by trained and experienced clinicians. This study was approved by the Ethics Review Boards of Hangzhou Seventh People's Hospital and West China Hospital. Informed consent was obtained from all participants prior to their inclusion in the study. Clinical trial number: not applicable.
Plasma Cytokine Assays
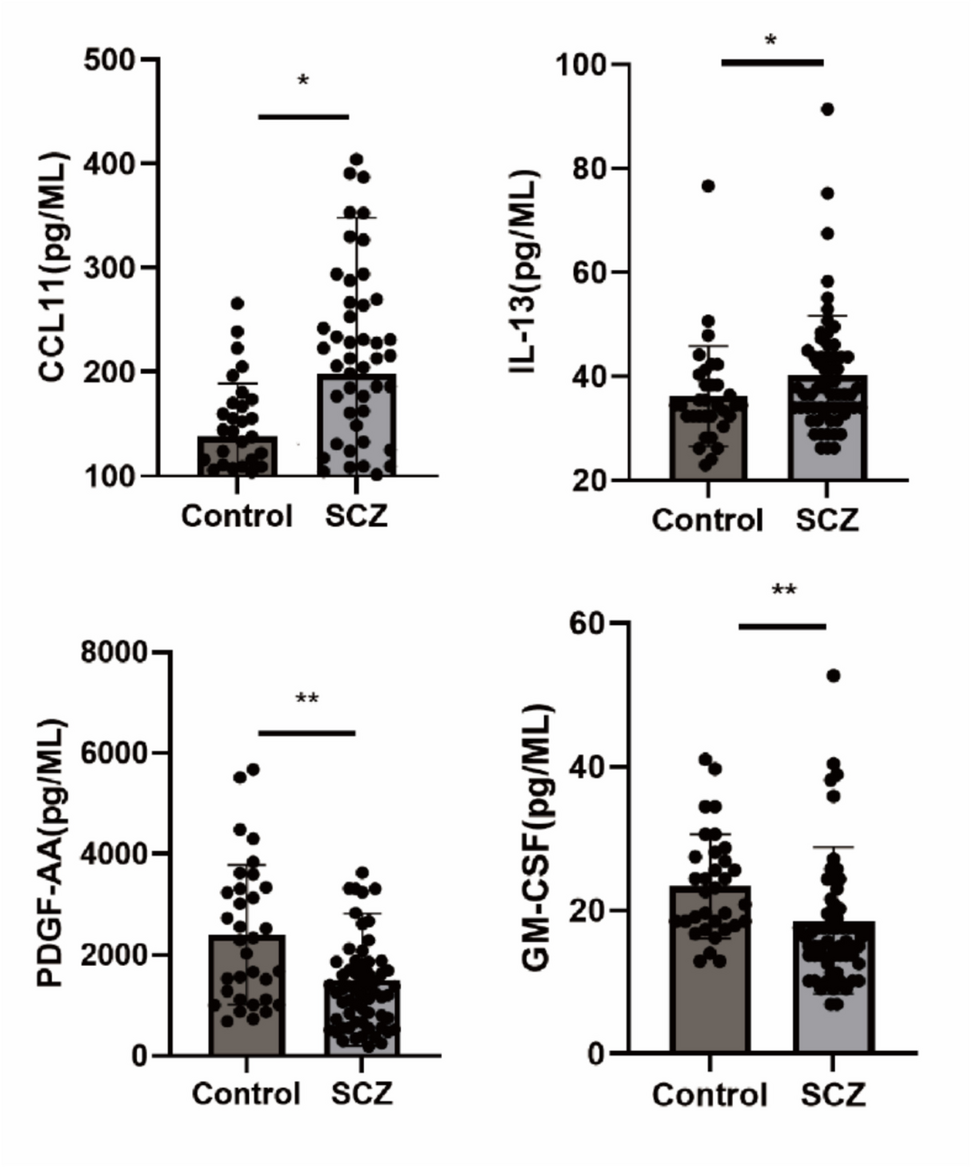
To minimize the impact of circadian rhythm fluctuations, venous blood samples were collected at either 10 a.m. or 4 p.m. Blood was drawn into ethylenediaminetetraacetic acid (EDTA) tubes and centrifuged at 1500 g for 15 min at 4 °C. The separated plasma was then stored at −80 °C until further analysis. Cytokine concentrations were assessed using the Luminex assay (R&D Systems, USA) following a 1:2 plasma dilution. A total of 44 cytokines were quantified simultaneously, with concentrations determined via four-parameter logistic curve fitting using MULTIPLEX Analyst software [19]. This fitting process was applied to both standards and samples. Detailed information, including the cytokine panel, standard curves, fitting outcomes, and coefficients of variation, is provided in the Supplementary Information.
Each cytokine was measured in duplicate, and concentrations were reported in pg/mL. To ensure data reliability despite the inherent sensitivity limitations of immunoassays, only cytokines detected in ≥ 80% of samples were included in the final analysis, leading to variation in the number of subjects considered for each cytokine. For cytokines that were undetectable in a given sample, values were imputed as half of the lower detection limit.
Isolation and Culture of Primary Hippocampal Neurons
Neonatal mice (within 24 h postnatal) were euthanized via cervical dislocation, and their brains were rapidly extracted into cold Hank's Balanced Salt Solution (HBSS). The hippocampi were carefully dissected and digested with 0.25% trypsin at 37 °C for 10 min. Digestion was halted by adding DMEM/F12 medium containing 10% fetal bovine serum (FBS). The tissue was then gently triturated to obtain a single-cell suspension. After filtration through a 70 μm strainer, the cells were centrifuged at 1000 rpm for 5 min, and the pellet was resuspended in fresh medium. The cells were seeded onto polylysine-coated culture dishes or slides and incubated for 4 h. Subsequently, the medium was replaced with Neurobasal medium supplemented with B27, L-glutamine, and penicillin–streptomycin. Cultures were maintained for 7–10 days with medium changes every 3 days before experimental use.
Lactate Dehydrogenase (LDH) Releasing Assay
Cytotoxicity in target cells was assessed according to the manufacturer's guidelines (C0018S, Biyuntian) by quantifying lactate dehydrogenase (LDH) release from the cells.
Reactive Oxygen Species (ROS) Determination
Primary neurons were exposed to varying concentrations of CCL11 and subsequently incubated with the fluorescent probe 2',7'-dichlorodihydrofluorescein diacetate (DCFH-DA) at a dilution ratio of 1:1000 at 37 °C for 30 min. Rosup, a known ROS activator, served as a positive control. Fluorescence, indicative of ROS levels, was quantified using a multifunctional microplate reader.
Western Blot Analysis
Neuronal or tissue samples were lysed in buffer containing protease and phosphatase inhibitors and protein concentrations were measured using a BCA assay kit. For SDS-PAGE, 20–30 μg of protein was mixed with 5 × SDS loading buffer and denatured at 95 °C for 5 min. The samples were then separated on 10–12% SDS-PAGE gels and transferred to PVDF membranes. The membranes were blocked with 5% nonfat milk for 1 h, followed by overnight incubation at 4 °C with primary antibodies against Drp1, p-Drp1, Fis1, TFAM, Mfn2, HVCN1, and β-tubulin. After three washes with TBST, membranes were incubated with HRP-conjugated secondary antibodies for 30 min at room temperature. Protein signals were detected using ECL chemiluminescence or an infrared imaging system, and ImageJ was used for quantitative analysis.
Real‑Time Quantitative Polymerase Chain Reaction
Total RNA was extracted from hippocampal tissue using the Trizol reagent. RNA purity was assessed via NanoDrop spectrophotometry, and 1 µg of RNA was reverse transcribed into complementary DNA (cDNA) using a reverse transcription kit. Quantitative PCR was performed in a 20 µL reaction mixture containing the cDNA template, specific primers at a concentration of 10 µM, SYBR Green qPCR Mix, and double-distilled water. Primer sequences are detailed in Supplementary File 2. The relative expression levels of target genes were calculated using the 2-ΔΔCt method, with β-actin serving as the internal reference gene.
Immunofuorescence Staining
Frozen Sects. (10 µm thick) or nerve cells fixed with 4% paraformaldehyde were permeabilized with 0.3% Triton X-100 for 10 min at room temperature. After washing with PBS, sections were blocked with goat serum for 1 h to prevent non-specific binding. Primary antibodies, including Drp-1, ATPB, Iba-1, CD68, 4HNE, and HVCN1 (antibody details provided in Supplementary File 2), were applied, and samples were incubated overnight at 4 °C. The following day, samples were washed with PBS and incubated with fluorescent secondary antibodies for 1 h in the dark at room temperature. After DAPI staining, cell images were captured using Olympus VS200 and Zeiss LSM900 microscopes. Fluorescence intensity and mitochondrial branch length were measured using ImageJ software, while ArivisVision4D was used to analyze the volume percentage of neuronal Drp-1/ATPB.
Electron Microscopy
Neurons were harvested and fixed with 2.5% glutaraldehyde at 4 °C overnight. After washing with phosphate-buffered saline (PBS), samples were further fixed with 1% osmium tetroxide for 1 h. The samples were then dehydrated through a graded ethanol series and embedded. Ultrathin sections were stained and imaged using a Talos 120 kV transmission electron microscope.
Mitochondrial Membrane Potential
Mitochondrial membrane potential was assessed using a commercially available assay kit (catalog no. T3168, Thermo Fisher Scientific). Primary hippocampal neurons were incubated with the JC-1 dye at a concentration of 10 μg/mL for 15 min. The JC-1 monomer was excited at 488 nm, while the JC-1 aggregate was excited at 550 nm. After washing the cells, the red/green fluorescence ratio was measured. Carbonyl cyanide m-chlorophenyl hydrazone (CCCP), a known mitochondrial uncoupler, was used as a positive control to demonstrate a reduction in mitochondrial membrane potential.
Mitochondrial Permeability Transition Pore (mPTP) Analyses
Mitochondrial permeability transition pore (mPTP) activity was assessed using a commercially available assay kit (catalog no. C2009S, Beyotime). Primary hippocampal neurons were washed twice with PBS and then incubated with calcein-AM for 15 min at 37 °C. Following incubation, cells were washed again with PBS and subsequently visualized using a fluorescence microscope equipped with an argon laser set to 488 nm.
Quantifying Mitochondrial Respiration
Primary hippocampal neurons were cultured in an XFE96 cell culture plate for 14 days. The cells were then treated with varying concentrations of CCL11 (0, 10, 25, 50, 75, and 100 ng/mL) for 24 h. Following treatment, the culture medium was aspirated, and the cells were incubated for one hour in a CO2-free incubator with Agilent Technologies basic medium (catalog no. 102353–100, Agilent Technologies), supplemented with 5.5 mM d-glucose and 0.68 mM l-L-glutamine. After incubation, oligomycin (1 μM), FCCP (2 μM), and antimycin A/rotenone (0.5 μM) were added to wells A, B, and C, respectively. Oxygen consumption rates were then measured and normalized to protein concentration.
Drug Administration and Stereotaxic Injection
The C57 mice were selected due to their genetic homogeneity and well-documented utility in translational neuropsychiatric research. All mice were sourced from Hangzhou Hangsi Biotechnology Company, a certified Specific Pathogen-Free facility. Experimental protocols involving animals were approved by the Animal Experimental Ethics Committee at Zhejiang University and were conducted in compliance with the guidelines established by the Animal Care and Use Committee of the Mental Health Center affiliated with Zhejiang University. To validate the role of CCL11 in vivo, mice were randomly assigned to either a Sham group or a CCL11 group. In the CCL11 group, 10 µg of CCL11 was dissolved in 200 µL, 100 µL, and 50 µL of PBS to prepare working solutions with concentrations of 0.05 µg/µL, 0.1 µg/µL, and 0.2 µg/µL, respectively, following the concentration gradient established by Saul et al. After nine weeks of isoflurane anesthesia, 1 µL of the working solution was administered bilaterally into the ventricles of the mice using a stereotaxic apparatus at a rate of 500 nL/min. Following injection, the glass needle was left in place for approximately one minute to minimize the risk of liquid leakage. For the Sham group, an equivalent volume of PBS was administered into the lateral ventricle to control for potential effects of the surgical procedure.
Four weeks before administering the drug, a stereotaxic injection was performed to introduce a viral combination of AAV2/9-hSyn-DIO-mRuby3.Mito-WPRE.pA and AAV2/9-hSyn-Cre-WPRE-pA into the hippocampus to visualize the mitochondrial network. The stereotaxic coordinates for hippocampal injection were as follows: anteroposterior (AP) − 2.3 mm, mediolateral (ML) ± 1.8 mm, and dorsoventral (DV) − 2.0 mm.
To investigate the potential reversal of neural damage mediated by CCL11 through the knockdown of hippocampal CCR3, mice were administered pAAV-CMV-shCCR3-EGFP and an empty viral vector. Four weeks post-injection, the distribution of EGFP green fluorescence in brain tissue slices was captured. Subsequently, mice were randomly assigned to one of three groups: the Sham group, the CCL11 + ShCtrl group, and the CCL11 + ShCCR3 group. A solution of adenovirus lacking fluorescent markers (1.3 × 10^12 vg/mL) was administered bilaterally into the hippocampus at a rate of 100 nL/min, with a total volume of 1 μL, to silence the CCR3 gene. AAV expression was allowed to proceed for four weeks. The recombinant AAV serotype virus was engineered by Shengbo Biotechnology. The interference sequence against CCR3 was 5’-GCATTCAACACAGATGAAATC-3’, and the control sequence was 5’-GTTCTCCGAACGTGTCACGTA-3’.
Open Field Test (OFT)
The objective of the open field test was to assess exercise-related behaviors and anxiety-depression responses in mice. The open field arena measured 50 cm in height, 50 cm in width, and 40 cm in depth. Prior to testing, the mice were acclimated to the behavioral room for at least two hours, during which they were gently handled to minimize stress responses. Following acclimatization, the mice were carefully placed at the center of the open field, and their behavior was recorded on video for 10 min. Data collection and analysis were performed using EthoVision 7.0 software. Key experimental metrics included the total distance traveled and the time spent in the central region of the arena over the 10-min period.
Prepulse Inhibition Test (PPI)
The sensory gating abilities of the mice were assessed using the Prepulse Inhibition (PPI) system (SA217, SansBio). Mice were placed in a transparent plexiglass box, connected to a power sensor that recorded the animals'reactions. A speaker mounted at the top of the test box delivered background noise and varying sound intensities. Auditory stimuli included a 120 dB shock stimulus and a weaker pre-pulse stimulus at intensities of 74 dB, 78 dB, or 82 dB. Upon presentation of these auditory stimuli, the mice exhibited a generalized muscle flexing and stretching reflex, characterized by jumpy behavior. PPI was calculated by measuring the response amplitude to the startle reflex using the power sensor. The experimental protocol consisted of eight consecutive blocks, each with different pre-pulse intensities, including: Block 1: Five pulse-alone trials at 120 dB. Subsequent blocks: A random sequence of (i) background noise at 70 dB, (ii) pulse stimulation at 120 dB, (iii) pre-pulse stimulation at 74 dB, 78 dB, or 82 dB, and (iv)-(vi) pre-pulse stimulation followed by 120 dB pulse stimulation after a 100 ms interval. The PPI% was calculated using the following formula: PPI% = [(amplitude of response to shock stimulus—amplitude of response to pre-pulse combined with shock stimulus)/amplitude of response to shock stimulus] × 100%.
Fear Conditioning Test
To assess hippocampal-dependent memory, we employed the fear conditioning paradigm as described in previous studies [20]. The experimental setup consisted of a chamber (26 × 26 × 50 cm) with a grid-patterned background on all sides. The chamber floor was equipped with a metal mesh capable of delivering mild electric shocks. On Day 1, mice were allowed to freely explore the chamber for 2 min, followed by a 30-s presentation of a 75 dB white noise stimulus, which was paired with a 0.6 mA foot shock for 2 s. This paired stimulation was repeated five times, with a 2-min interval between each cycle. On Day 2, the context fear conditioning assay was conducted by reintroducing the mice into the chamber for 3 min, during which their behavior was recorded using a digital camera. Subsequently, a sound cue fear assessment was performed after a 2-h interval. In this task, mice were placed in a novel compartment with altered background, metal mesh, and odor. Following a 30-s exposure to 75 dB white noise, the mice had a 3-min free exploration period. Freezing behavior, defined as remaining stationary for at least 1 s, was recorded and analyzed using FreezeView software.
Object Location Recognition Task (OLR)
The OLR task evaluated hippocampal-dependent spatial memory in three phases: adaptation, training, and testing. In the adaptation phase, mice were placed in a 50 cm × 50 cm × 40 cm box for 5 min. During training, two identical cylinders (A and B) were placed in the lower left and lower right corners of the chamber, and mice were allowed to explore for 5 min with their backs facing the objects. In the testing phase, 3 h later, one cylinder was replaced with a new cube, and the mice were reintroduced. The apparatus and objects were cleaned with 70% ethanol between phases to remove residual scents. Exploration time was measured using ANY-MAZE software when the mouse’s nose was within 2 cm of the object. The New Location Exploration Time Ratio was calculated as:
New Location Exploration Time Ratio = New Location Time/(New Location Time + Old Location Time);
The Discrimination Index was calculated as:
Discrimination Index = (New Location Time—Old Location Time)/(New Location Time + Old Location Time).
Mitochondria Respiratory Chain Complex Activity Measurements
Mitochondrial respiratory chain complexes I and IV activity was measured using a commercial kit (catalog no. 580238/580241, Absin Biological Technology). Absorbance was measured at 340 nm at two time points (A1 and A2, after 2 min), and the ΔA was calculated (A1—A2). Respiratory chain complex activity (U/mg) was determined using the provided formula.
Enzyme-Linked Immunosorbent Assay (ELISA)
The concentrations of IL-1β and CCL5 in hippocampal tissue samples were quantified using ELISA kits. Supernatants from mouse hippocampal homogenates were prepared and analyzed according to the manufacturer's protocols using the IL-1β kit (catalog no. KE10003, Proteintech) and the CCL5 kit (catalog no. Rab0077, Merck). All samples were assayed in triplicate.
Transcriptome Sequencing
Double-stranded complementary DNA (cDNA) was synthesized through reverse transcription of messenger RNA (mRNA) extracted from hippocampal tissue samples of five sham-operated mice and five mice treated with CCL11. Following purification, a library was constructed and underwent quality assessment before sequencing. The raw data were processed using fastp software for deconcatenation and low-quality filtering. HISAT2 was then employed to align the filtered data with the reference genome, resulting in the aligned reference genome. Gene alignment data were used to determine the read count for each gene. Quantitative analysis was performed using StringTie. Differential expression analysis was conducted with DESeq2, with the criteria for identifying differentially expressed genes set at|log2(FoldChange)|> 0.5 and padj < 0.05. Relevant pathways were identified through enrichment analysis.
Non-Targeted Metabolomics Assay
Non-targeted metabolomics analyses were performed by APExBIO Technology. Briefly, 400 μL of methanol: acetonitrile (3:1) was used to homogenize snap-frozen hippocampal tissue. The mixture was vortexed for 10 min and then centrifuged at 12,000 rpm at 4 °C for 10 min to precipitate proteins. The supernatant was removed and dried under vacuum. The residue was redissolved in 100 μL of a 50% methanol–water solution (1:1), which was then fully dissolved using ultrasound. A 100 μL aliquot of the supernatant was subjected to centrifugation for liquid chromatography-mass spectrometry (LC–MS) analysis. The chromatographic column used was the ACQUITY UPLC HSS T3, and mass spectrometric analysis was performed in both positive and negative ionization modes. Inter-group comparisons were performed using the Orthogonal Partial Least Squares (OPLS) model to derive Variable Importance in Projection (VIP) values. An independent samples t-test was used to calculate p-values to identify differentially expressed metabolites. The criteria for screening differentially expressed metabolites were VIP values greater than 1 and p-values less than 0.05.
Statistical Analysis
Statistical analysis was conducted using SPSS version 26.0 and GraphPad Prism version 9.0. For cytokine analysis, the D’Agostino-Pearson test was performed to assess the normality of continuous variables after removing outliers by the Grubbs method. Based on the results of the normality test, for variables that did not meet the assumption of normality, the Mann–Whitney U test was used. For normally distributed variables, analysis of t-test was performed.


Comments (0)