
Remember me


To investigate the effects of the WFS1 gene mutation (c.2389G > A), mutant mice were generated using the C57BL/6 background. The body weight of WFS1 mutant mice (WFS1MT) was found to be significantly lower than that of their wild-type counterparts (WFS1WT) (Supplementary Fig. 2A). However, the blood glucose concentration in WFS1MT mice was higher than in WFS1WT mice (Supplementary Fig. 2B). Histological analysis demonstrated disorganized cell arrangement in the outer nuclear layer of the retina and optic disc edema in WFS1MT mice, indicating visual impairment (Supplementary Fig. 2C, D).
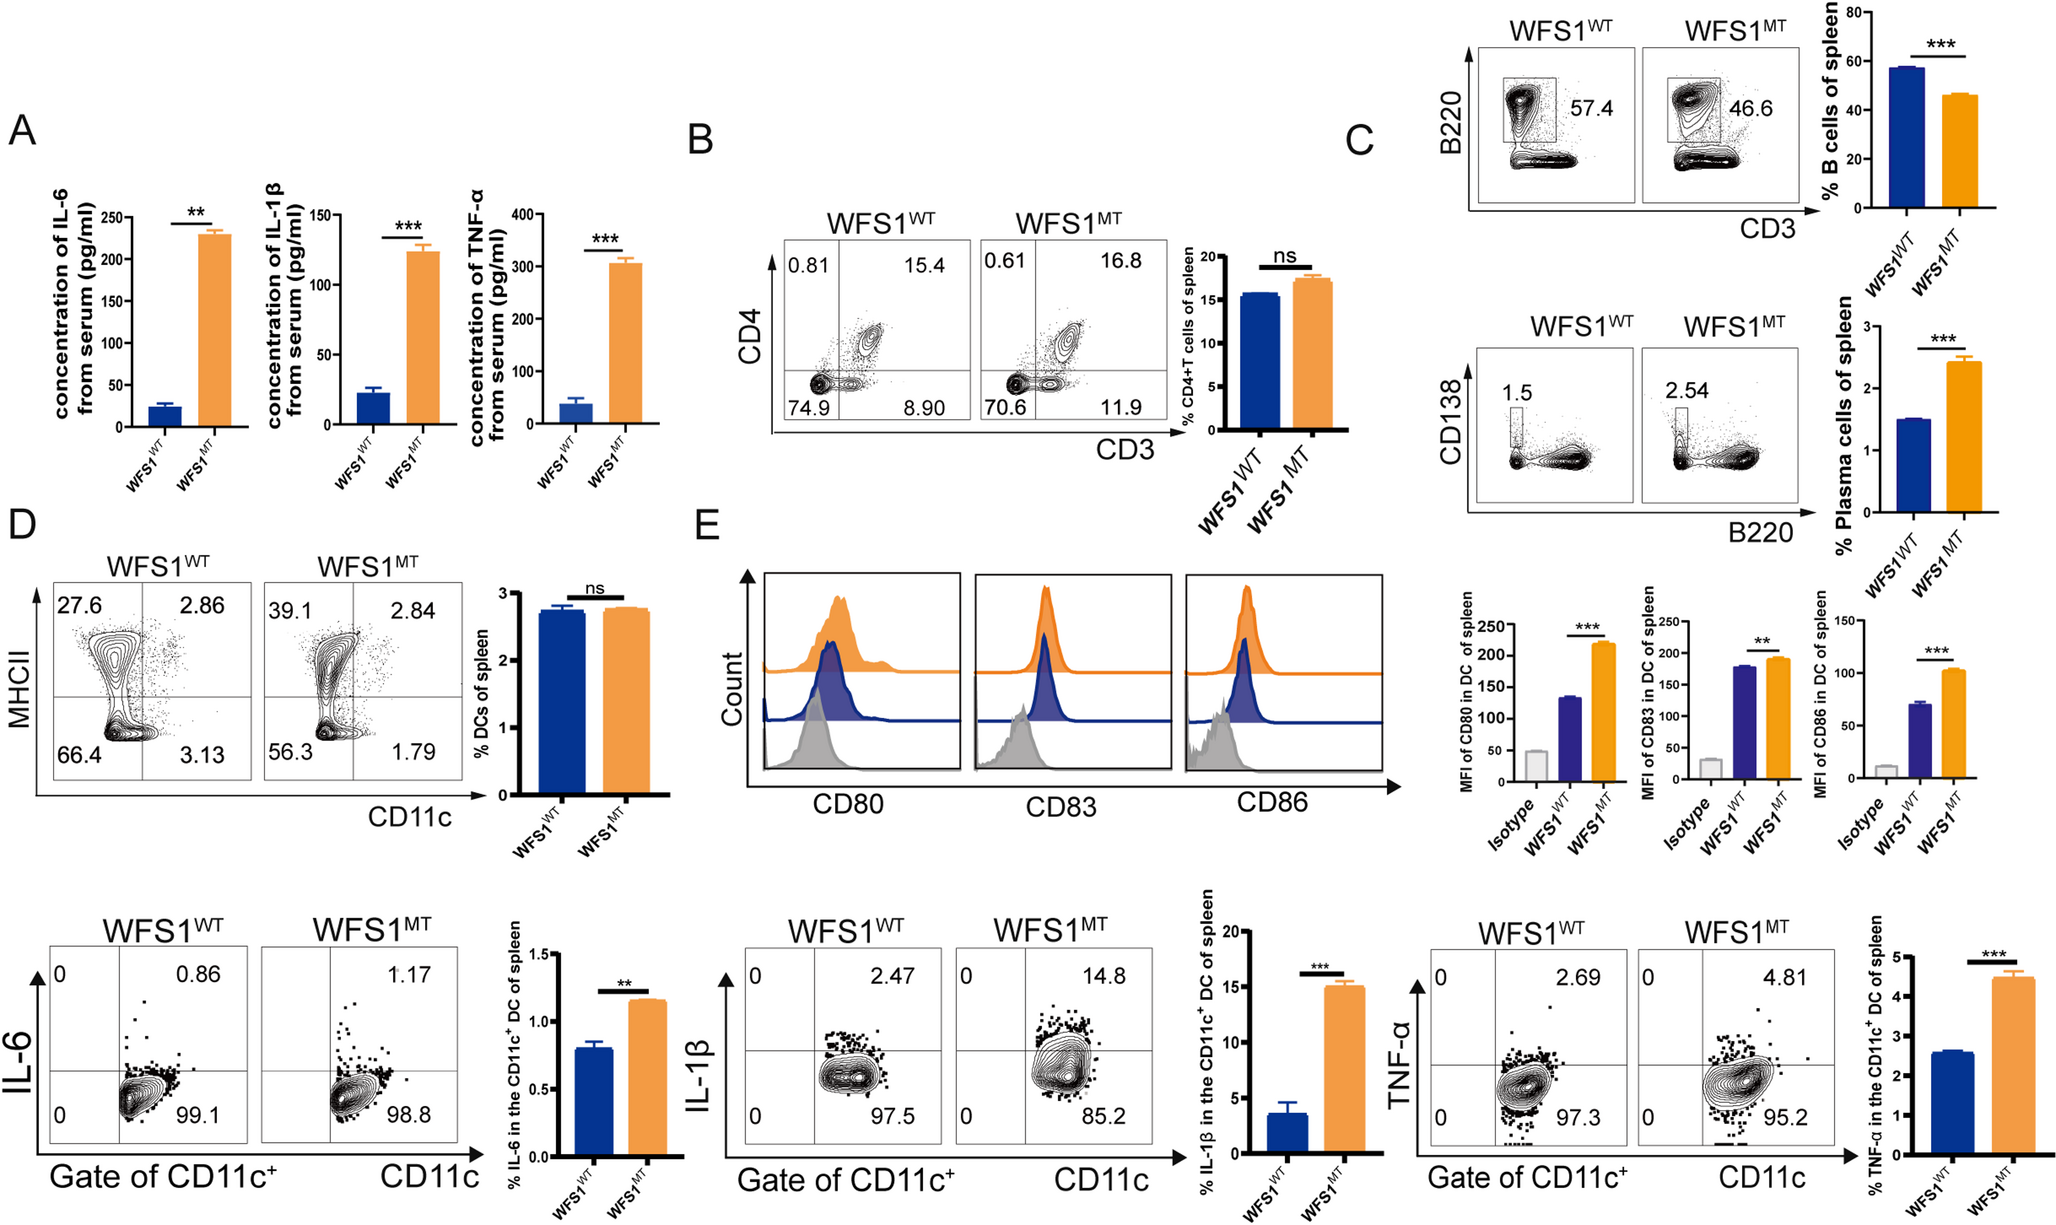
In addition to these classical symptoms of WS, WFS1MT mice exhibited significantly elevated serum concentrations of IL-6, IL-1β, and TNF-α compared to their wild-type counterparts (Fig. 1A). Dysregulation of immune cell subsets was also observed in the spleens of WFS1MT mice. The percentage of CD3+CD4+ T cells in the spleen was not significantly changed (Fig. 1B).
Fig. 1
Proinflammatory Cytokine Levels and Immune Cell Alterations in WFS1 Homozygous Mutant Mice. (A) IL-6, IL-1β, and TNF-α levels in the serum of wild-type (WFS1WT) and homozygous mutant (WFS1MT) mice were quantified using ELISA. (B) Proportions of CD3+CD4+ T cells were analyzed using flow cytometry in WFS1WT and WFS1MT mice. (C, D) Flow cytometry was used to evaluate B cells, plasma cells, and dendritic cells (DCs) in WFS1WT and WFS1MT mice. (E) Protein expression levels of CD80, CD83, CD86, IL-6, IL-1β, and TNF-α in splenic DCs of WFS1WT and WFS1MT mice were measured using flow cytometry. Data were analyzed using two-tailed t-tests. ns, not significant; *P < 0.05; **P < 0.01; ***P < 0.001.
The percentage of plasma cells (CD3⁻B220⁻CD138+) was also higher in the spleens of WFS1MT mice compared to WFS1WT mice but B cells (CD3⁻B220+) decreased (Fig. 1C). While the percentage of dendritic cells (DCs) in the spleen of WFS1MT mice was not different from that of WFS1WT mice (Fig. 1D), the expression levels of CD80, CD86, CD83, IL-1β, and TNF-α in DCs from WFS1MT mice were significantly increased compared to those in WFS1WT mice (Fig. 1E).
Collectively, these findings suggest that the WFS1 mutation promotes an increased production of plasma cells, and enhanced DC maturation and inflammation in splenic cells. These characteristics, including high basal levels of proinflammatory cytokines and disordered immune cells, are hallmarks of chronic inflammatory diseases [19,20,21]. The immune dysregulation observed in WFS1MT mice may result from abnormal endoplasmic reticulum stress (ERS) that is dysregulated by the WFS1 mutation [14,15,16].
WFS1 Gene Mutation (c.2389G > A) Increases ERS in Splenic CellsTo investigate the mechanism of inflammation induced by the WFS1 gene mutation (c.2389G > A), the gene and protein expression levels of WFS1 in WFS1MT and WFS1WT mice were initially measured. The expression of the WFS1 gene in splenic cells did not differ significantly between WFS1WT and WFS1MT mice. However, the protein expression of WFS1 in splenic cells of WFS1MT mice was higher than that observed in WFS1WT mice (Fig. 2A, B).
Fig. 2
Analysis of WFS1Expression and Endoplasmic Reticulum Stress in Splenic Cells of WFS1WT and WFS1MT Mice. (A) WFS1 transcript levels in the spleens of WFS1WT and WFS1MT mice, untreated or treated with 0.1 µM TG for 6 h, were assessed by real-time PCR. (B) WFS1 protein in the splenic cells of WFS1WT and WFS1MT mice, either untreated or treated with 0.1µM Thapsigargin (TG) for 6 h. (C) Endoplasmic reticulum stress in splenic cells was evaluated via immunofluorescence. Red fluorescence indicates endoplasmic reticulum localization, while blue fluorescence (DAPI) marks the cell nuclei. (D) The apoptosis rate of splenic cells from WFS1WT and WFS1MT mice, untreated or treated with 0.1 µM TG for 6 h, was determined using flow cytometry. Data were analyzed using one-way ANOVA. ns, not significant; *P < 0.05; **P < 0.01; ***P < 0.001
Upon stimulation with Thapsigargin (TG), an inducer of endoplasmic reticulum stress (ERS), both gene and protein expression levels of WFS1 in splenic cells of WFS1WT mice were elevated compared to that without stimulation (Fig. 2A, B). In splenic cells of WFS1MT mice, TG stimulation increased WFS1 gene expression, but no significant changes were observed in WFS1 protein levels between stimulated and unstimulated conditions (Fig. 2A, B).
Moreover, the ER stress (ERS) response in splenic cells was assessed using immunofluorescence, revealing higher levels of ERS in WFS1MT mice compared to WFS1WT mice (Fig. 2C). Following treatment with thapsigargin (TG), an ER stress inducer, ERS levels were further increased in splenic cells of both WFS1MT and WFS1WT mice. Notably, the magnitude of ERS was significantly higher in WFS1MT splenic cells than in those from WFS1WT mice under TG stimulation (Fig. 2C). These findings suggest that the WFS1 mutation promotes ERS in splenic cells, particularly under conditions of induced stress.
The percentage of apoptotic splenic cells was also elevated in WFS1MT mice compared to WFS1WT mice (Fig. 2D). TG treatment further amplified apoptosis in splenic cells, with a more pronounced effect observed in WFS1MT mice (Fig. 2D). These results indicate that the WFS1 mutation enhances apoptosis in splenic cells, especially under ER stress conditions. Although the c.2389G > A mutation did not directly affect WFS1 gene expression, it significantly altered WFS1 function, thereby influencing ERS and apoptosis in splenic cells.
Activation of the ERS Signaling Pathway in Splenic Cells of WFS1MT MiceGiven that the WFS1 mutation can impact ER activation and the components of the unfolded protein response (UPR), including CHOP, sXBP1, and ATF4 [22,23,24], the ERS signaling pathway was investigated in splenic cells isolated from WFS1MT mice compared to those from WFS1WT mice. The expression of key UPR markers, including CHOP, sXBP1, ATF4, and ATF6, was measured under both unstimulated conditions and TG-induced stress.
In the absence of TG stimulation, the gene expression of sXBP1, and ATF6 was significantly elevated in splenic cells from WFS1MT mice compared to those from WFS1WT mice, whereas the expression levels of CHOP and ATF4 did not differ (Fig. 3A). Under TG stimulation, the expression of sXBP1, CHOP, and ATF4 was significantly higher in splenic cells from WFS1MT mice than in those from WFS1WT mice, indicating an enhanced responsiveness to ER stress in WFS1MT splenic cells (Fig. 3A). These results suggest that, although the apoptosis-related genes ATF4 and CHOP were not activated under basal conditions, both apoptosis and XBP1-related pathways were triggered under ER stress.
Fig. 3
Analysis of ER Stress Markersin Splenic Cells. (A) Transcript levels of ATF6, ATF4, CHOP, sXBP1, and GRP78 in the spleens of WFS1WT and WFS1MT mice, untreated or treated with 0.1 µM Thapsigargin (TG) for 6 h, were measured by real-time PCR and normalized to GAPDH expression. (B) Protein expression levels of ATF6, ATF4, CHOP, and sXBP1 in splenic cells were assessed by flow cytometry. (C) CHOP and sXBP1 protein expression levels were analyzed in DCs, T cells, B cells, and plasma cells from the spleens of WFS1WT and WFS1MT mice using flow cytometry. Data were analyzed using one-way ANOVA and two-tailed t-tests. ns, not significant; *P < 0.05; **P < 0.01; ***P < 0.001
Protein expression analysis further revealed that ATF6, CHOP, and sXBP1 levels were increased in splenic cells of WFS1MT mice compared to WFS1WT mice (Fig. 3B). TG stimulation further augmented the expression of ATF4 and CHOP in WFS1MT splenic cells (Fig. 3B). These findings indicate that ER stress is activated in the splenic cells of WFS1MT mice, with CHOP and sXBP1 being predominantly upregulated under both basal and CHOP expression increased under stress-induced conditions. Thus, the WFS1 c.2389G > A mutation activates apoptosis and the XBP1 pathway, influencing ER activation in splenic cells.
The expression of sXBP1 was predominantly elevated in DCs, B cells, plasma cells, and T cells in WFS1MT mice (Fig. 3C), indicating that the XBP1 pathway was overactivated in these immune cell subsets. As XBP1 is a critical regulator of B cell differentiation, plasma cell function, and the activities of T cells and DCs [25,26,27,28,29,30,31], the WFS1 mutation triggered an upregulation of the XBP1 signaling pathway, thereby contributing to immune disorders. Additionally, CHOP expression was found to be elevated in DCs, and T cells of WFS1MT mice (Fig. 3C). Additionally, the expression of ATF6, ATF4, CHOP and sXBP1 proteins in BMDC of WFS1MT mice were higher than that of WFS1WT mice (Supplementary Fig. 3). The results showed that the endoplasmic reticulum stress pathway was activated in BMDC of mice with WFS1MT.
WFS1 Regulates the Maturation and Inflammation of DCsDCs possess strong antigen-presentation capabilities that are critical for activating adaptive immune responses [32, 33]. Therefore, further investigation was conducted to determine how the WFS1 gene mutation (c.2389G > A) regulates DC function. To analyze the role of WFS1 in DCs, shRNA specific for WFS1 (shWFS1) was utilized to suppress WFS1 expression. Following shRNA-WFS1 interference, the expression of CD80, CD83, CD86, MHC-II, IL-6, TNF-α, and IL-1β was significantly increased in DCs compared to DCs treated with shRNA-NC (negative control) (Fig. 4A, B). Under TG stimulation, the expression of these markers and cytokines in shRNA-WFS1-treated DCs was also elevated compared to shRNA-NC treated group (Supplementary Fig. 4A).
Fig. 4
Proinflammatory Cytokine Productionin DC2.4 Cells Following WFS1 Silencing. (A, B) Protein expression levels of CD80, CD83, CD86, MHCII, IL-6, TNF-α, and IL-1β in DC2.4 cells transfected with WFS1 shRNA were assessed using flow cytometry. (C) Apoptosis rates in the shRNA-NC and shRNA-WFS1 groups were determined by flow cytometry. (D) mRNA expression levels of WFS1, ATF6, ATF4, CHOP, and sXBP1 were quantified by real-time PCR in the shRNA-NC and shRNA-WFS1 groups. (E) Protein expression levels of WFS1, ATF6, ATF4, CHOP, and sXBP1 in DC2.4 cells were measured using flow cytometry. (F) Western blotting was performed to detect WFS1, ATF6, ATF4, CHOP, and sXBP1 protein levels in the shRNA-NC and shRNA-WFS1 groups, with GAPDH serving as a loading control. Data were analyzed using one-way ANOVA and two-tailed t-tests. ns, not significant; *P < 0.05; **P < 0.01; ***P < 0.001
In addition, shRNA-WFS1 treatment increased the percentage of apoptotic cells in DCs relative to the negative control group (Fig. 4C). The level of apoptosis in shRNA-WFS1-treated DCs was also higher than in DCs treated with shRNA-NC under TG stimulation (Supplementary Fig. 4B). TG treatment augmented apoptosis in shRNA-WFS1-treated DCs than without TG treatment (Supplementary Fig. 4B). These findings suggest that WFS1 regulates the maturation and functionality of DCs.
Following shRNA-WFS1 interference, the gene expression of ATF4 and sXBP1 was significantly increased compared to the negative control group (Fig. 4D). Similarly, the protein expression of ATF4, ATF6, sXBP1, and CHOP was elevated in shRNA-WFS1-treated DCs compared to the negative control group (Fig. 4E, F). Under TG stimulation, the expression of sXBP1 and CHOP in shRNA-WFS1-treated DCs was increased compared to shRNA-NC-treated DCs (Supplementary Fig. 4C). These results suggest that WFS1 controls the maturation and secretion of inflammatory cytokines by DCs through the XBP1 signaling pathway. Under endoplasmic reticulum stress (ERS), the CHOP-mediated apoptotic signaling pathway was activated, leading to DC apoptosis.
WFS1 Regulates DC Maturation through the XBP1/TMEM176A PathwayTo further investigate how WFS1 influences the maturation of DCs, RNA sequencing was employed to identify differentially expressed genes (DEGs) between DCs treated with shRNA-WFS1 and DCs treated with shRNA-NC. Among the DEGs, Tmem176a expression was found to be significantly reduced in shRNA-WFS1-treated DCs (Fig. 5A). RT-qPCR analysis confirmed that the gene expression of Tmem176a in shRNA-WFS1-treated DCs was lower than that in shRNA-NC-treated DCs (Fig. 5B). Flow cytometry analysis further indicated that the protein expression of TMEM176A in shRNA-WFS1-treated DCs was also reduced compared to DCs treated with shRNA-NC (Fig. 5B). Since TMEM176A is a regulatory protein that inhibits DC maturation and activity [34, 35], its decreased expression could promote DC maturation.
Fig. 5
WFS1 Regulates DC Maturation via the XBP1/TMEM176A Pathway. (A) A volcano plot of sequencing data comparing the shRNA-NC and shRNA-WFS1 groups. (B) TMEM176A transcript levels in DC2.4 cells from the shRNA-NC and shRNA-WFS1 groups were assessed by real-time PCR (left), and TMEM176A protein expression was analyzed by flow cytometry (right). (C) Analysis of transcription factors for the mouse TMEM176A gene using the GeneCards database revealed the involvement of XBP1. (D) TMEM176A transcripts in untreated DC2.4 cells and DC2.4 cells treated with the XBP1 inhibitor 3,6-DMAD (10 µM for 13 h) were quantified by real-time PCR. (E) TMEM176A protein expression in untreated DC2.4 cells and DC2.4 cells treated with the XBP1 inhibitor was detected by flow cytometry. (F) Flow cytometry was used to detect the expression of CD80, CD83, CD86 and MHCII in the DCs of the shRNA-WFS1 group after the XBP1 inhibitor 3,6-DMAD treatment (10µM for 13 h). Data were analyzed using one-way ANOVA and two-tailed t-tests. ns, not significant; *P < 0.05; **P < 0.01; ***P < 0.001
Furthermore, XBP1 was predicted to function as a transcription factor for Tmem176a (Fig. 5C). In the DC2.4 cell line, inhibition of XBP1 by treatment with 3,6-DMAD (10 µM) for 13 h [36] resulted in increased gene and protein expression of Tmem176a (Fig. 5D, E). Collectively, these findings suggest that WFS1 modulates ERS primarily through XBP1, which negatively regulates the transcription of Tmem176A to influence the maturation and inflammatory response of DCs. Furthermore, XBP1 inhibitor (3.6-DMAD) was used to treat DC cells with shRNA-WFS1 infection showed that the treatment of XBP1 inhibitor could affect the maturation of DC cells (Fig. 5F). Above all, WFS1 regulates the maturation of DCs by modulating XBP-1/Tmem176A expression.
WFS1 Gene Mutation (c.2389G > A) Did Not Aggravate Symptoms of EAU by Inducing Lymphocyte Apoptosis and Suppressing InflammationThe WFS1 gene mutation (c.2389G > A) has been associated with ER stress (ERS) and chronic inflammation in splenic cells. Based on this, it was hypothesized that mice harboring the WFS1 mutation would exhibit increased susceptibility to infection. To test this hypothesis, an experimental autoimmune uveitis (EAU) model, an infectious eye disease characterized by autoimmune inflammation, was established in wide type mice and WFS1 gene mutation mice (WFS1MT-EAU). Retinal HE staining showed the disorder of the inner and outer nuclear layers in WFS1WT-EAU mice, which proved that the EAU model were successfully induced (Fig. 6A). Contrary to expectations, WFS1MT-EAU mice did not exhibit more severe ocular symptoms (Fig. 6A). The percentages of total CD3+CD4+ T cells, DCs, B cells, and plasma cells in the spleens of WFS1WT-EAU mice were increased compared to WFS1WT mice (Supplementary Fig. 5A-C). Instead, the percentages of these cell subsets in the spleens of WFS1MT-EAU mice decreased compared to WFS1MT mice (Fig. 6B-D).
Fig. 6
The WFS1 Mutation (c.2389G > A) Did Not Aggravate Symptoms of EAU by Inducing Lymphocyte Apoptosis. (A) The retinal pathological changes in the eyes of wild-type mice, EAU mice, mutant mice and mutant mice with EAU model construction. (B, C, D) Proportions of T cells, DCs, B cells, and plasma cells in WFS1MT mice were assessed using flow cytometry before and after EAU induction. (E) Serum levels of IL-6, IL-1β, and TNF-α in WFS1MT mice were measured by ELISA before and after EAU induction. (F) Apoptosis rates of splenic cells in WFS1MT mice were evaluated by flow cytometry before and after EAU induction. Data were analyzed using T tests. ns, not significant; *P < 0.05; **P < 0.01; ***P < 0.001
However, serum levels of IL-6, TNF-α, and IL-1β were significantly elevated in WFS1MT-EAU mice compared to WFS1MT mice (Fig. 6E). Additionally, the apoptosis rate of splenic cells in WFS1MT-EAU mice was higher than that in WFS1MT mice (Fig. 6F). These findings suggest that under antigen peptide stimulation, the dysfunction of WFS1 induces lymphocyte apoptosis, leading to a reduction in lymphocyte proportions rather than exacerbating the inflammatory response. Consequently, the WFS1 gene mutation (c.2389G > A) did not aggravate uveitis symptoms. It is postulated that this mutation promotes immune cell apoptosis under emergency conditions, resulting in a decreased number of T cells insufficient to induce retinal damage, which typically depends on T-cell ocular infiltration. Moreover, apoptosis leads to the release of inflammatory factors, thereby triggering immune inflammation.
Comments (0)