Animal Maintenance
Male CBA/CaJShjh mice, aged 6–8 weeks (obtained from Shanghai Jihui Laboratory Animal Breeding Co., Ltd, China), were provided with adequate food and water and housed in standard cages. All mice were maintained under a 12-h light/12-h dark cycle. Mice of the same age were randomly assigned to each experimental group. Our study was confined to male mice due to documented sex differences in NIHL, with males exhibiting greater susceptibility [24]. This choice aimed to reduce the variability and facilitate a focused investigation of circadian sensitivity to NIHL. The applicability of these findings to female mice remains to be determined.
Noise Exposure Paradigm
Noise exposure was induced by exposing awake and unanesthetized animals to a calibrated reverberation chamber, where sound pressure level variations were ~1 dB across typical locations. Bandpass noise (2–20 kHz) at 107 dB sound pressure level (SPL) was delivered through an amplifier and loudspeaker (Yamaha, PX10, Japan) for 2 h. The SPL was calibrated to the target level before each acoustic exposure using an acoustic meter (Hangzhou Aihua, AWA6228+, China), as previously described [25]. Zeitgeber time (ZT) 0 corresponds to the onset of daylight (6 a.m.), while ZT 12 corresponds to the onset of night-time (6 p.m.). Experiments were performed on the daytime noise exposure (DNE) group at ZT 2–4 and the NNE group at ZT 14–16.
Auditory Brainstem Response (ABR) Recordings
ABRs were recorded in a sound-attenuating chamber with background noise levels <30 dB(A), using an electrophysiology workstation (Tucker-Davis Technologies, RZ6, USA). ABRs were recorded before noise exposure and 1 day and 14 days post-exposure. All animals were anesthetized using zoletil (50 mg/kg) and xylazine (20 mg/kg) by intraperitoneal injection, and body temperature was maintained at 37°C with an isothermal pad (Harvard Apparatus, 55-7020, USA). Subdermal needle electrodes were placed at the vertex of the skull (active), the mastoid area of the left ear (reference), and the right shoulder (ground). Free-field sound stimuli were delivered through a speaker (Tucker-Davis Technologies, MF1, USA) positioned 10 cm from the vertex. For consistency, all ABR recordings in response to acoustic stimulation (4000, 8000, 11314, 16000, 22627, and 32000 Hz) were made by the same experimenter. The stimulus started at 90 dB SPL and decreased in 5 dB SPL steps until one level below visible responses. Each waveform was averaged 400 times. Thresholds were defined as the lowest stimulus level at which a response was recorded, with the response amplitude being more than twice the height of the noise. Latencies and amplitudes of ABR wave I were measured using BioSigRZ software. Latency was defined as the time between signal onset and the peak, while amplitude was calculated by averaging ΔV of both sides of wave I [26].
Distortion Product Otoacoustic Emission (DPOAE) Recordings
DPOAEs arise from the nonlinearity of the cochlear response when stimulated at two closely-spaced frequencies, f1 and f2. The interaction produces sounds known as intermodulation distortion products (DPs), with the most intense occurring at a frequency of 2f1−f2. DPOAEs were measured before and 14 days after DNE and NNE, as described in our previous study [25]. The two stimulus frequencies (f1 and f2) were generated by an electrophysiology workstation (Tucker-Davis Technologies, RZ6, USA) driving two MF1 speakers, which delivered equal-intensity primary tones with a frequency ratio (f2/f1) of 1.2. The speakers were connected to the ear canal in a closed-field configuration. Stimuli ranged from 80 dB to 20 dB SPL, with f1 and f2 intensities decreased in steps of 5 dB SPL, targeting frequencies at 8000, 16000, and 32000 Hz. The amplitudes of DPs at the frequency 2f1−f2 were averaged 512 times. The DPOAE threshold was defined as the point at which DP can no longer be distinguished from the noise [27].
Scanning Electron Microscopy (SEM)
Mice were anesthetized and perfused intracardially with fixative (2.5% glutaraldehyde and 2% paraformaldehyde (PFA)). We collected cochleae immediately after cardiac perfusion and removed a piece of bone from the apical end of each cochlea. Fixative was gently injected through the round and oval windows, and the cochleae were incubated in 2.5% glutaraldehyde overnight at 4°C, followed by decalcification in 10% ethylene diamine tetraacetic acid (EDTA) at room temperature (RT) until completed. After removing the tectorial membrane, the organ of Corti was separated and post-fixed in 1% OsO4 for 1 h at 4°C. Specimens were then fixed in 1% thiocarbohydrazide for 30 min at RT, followed by another fixation in 1% OsO4 for 1 h at 4°C. The cochleae were subsequently dehydrated through a series of graded ethanol incubations, dried at the critical point, and mounted on stubs [28]. After sputter-coating with gold in a vacuum coater (Leica, EM ACE200, Germany), samples were characterized under a field emission scanning electron microscope (Zeiss, GeminiSEM 300, Germany) using a secondary electron detector.
Whole-Mount Staining of Cochleae, Confocal Imaging, and Analysis
Immediately after the mice were sacrificed, the temporal bones were removed and the cochleae of both ears were collected. 4% PFA solution was gently injected through the round and oval windows, and the cochleae were stored in the same solution overnight at 4°C. The 4% PFA was then replaced with 10% EDTA until decalcification was complete. The cochleae were dissected into the three turns and blocked with a solution containing 0.3% Triton, 5% bovine serum, and 5% donkey serum in 0.01 mol/L phosphate buffered saline (PBS) for 1 h at RT. The tissues were incubated overnight at 4°C with primary antibodies in blocking solution: rabbit polyclonal anti-Myosin VIIa (1:200, Proteus BioSciences, 25–6790, USA), mouse (IgG1) anti-CtBP2 (1:200, BD Biosciences, 612044, USA), mouse (IgG2a) anti-Glutamate Receptor (1:50, BD Biosciences, 556341, USA), goat polyclonal IgG anti-CD45 (1:100, R&D systems, AF114, USA), and rat (IgG2a) anti-CD68 (1:100, Bio-Rad, MCA1957GA, USA).
Following overnight incubation with primary antibodies at 4°C, the tissues were washed three times with 0.01 mol/L PBS and incubated with the species-specific secondary antibodies Alexa Fluor 488-conjugated goat anti-rabbit IgG (H+L) (Invitrogen, A-11008, USA), Alexa Fluor 633-conjugated goat anti-mouse IgG1 (Invitrogen, A-21126, USA), Alexa Fluor 555-conjugated goat anti-mouse IgG2a (Invitrogen, A-21137, USA), Alexa Fluor 488-conjugated donkey anti-goat IgG (H+L) (Yeasen Biotech, 34306ES60, China), and Alexa Fluor 568-conjugated goat anti-rat IgG (H+L) (Invitrogen, A-11077, USA) for 1 h at RT. After washing three times in 0.01 mol/L PBS, samples were mounted with DAPI Fluoromount-G (SouthernBiotech, 0100-20, USA) on clean glass slides.
Confocal images were acquired using a confocal laser scanning microscope (Carl Zeiss, Zeiss LSM 880, Germany) in z-stack mode and preprocessed to show the maximum intensity projection. Hair cells labeled with Myosin VIIa and macrophages in the basilar membrane (BM) and osseous spiral lamina (OSL) were examined and counted with a 20× objective lens. To quantify the number of ribbon synapses per inner hair cell (IHC), presynaptic CtBP2 puncta that overlapped with postsynaptic GluR2 puncta were considered a single synaptic unit, counted under a 63× oil immersion lens.
Single-Cell Isolation and Sequencing
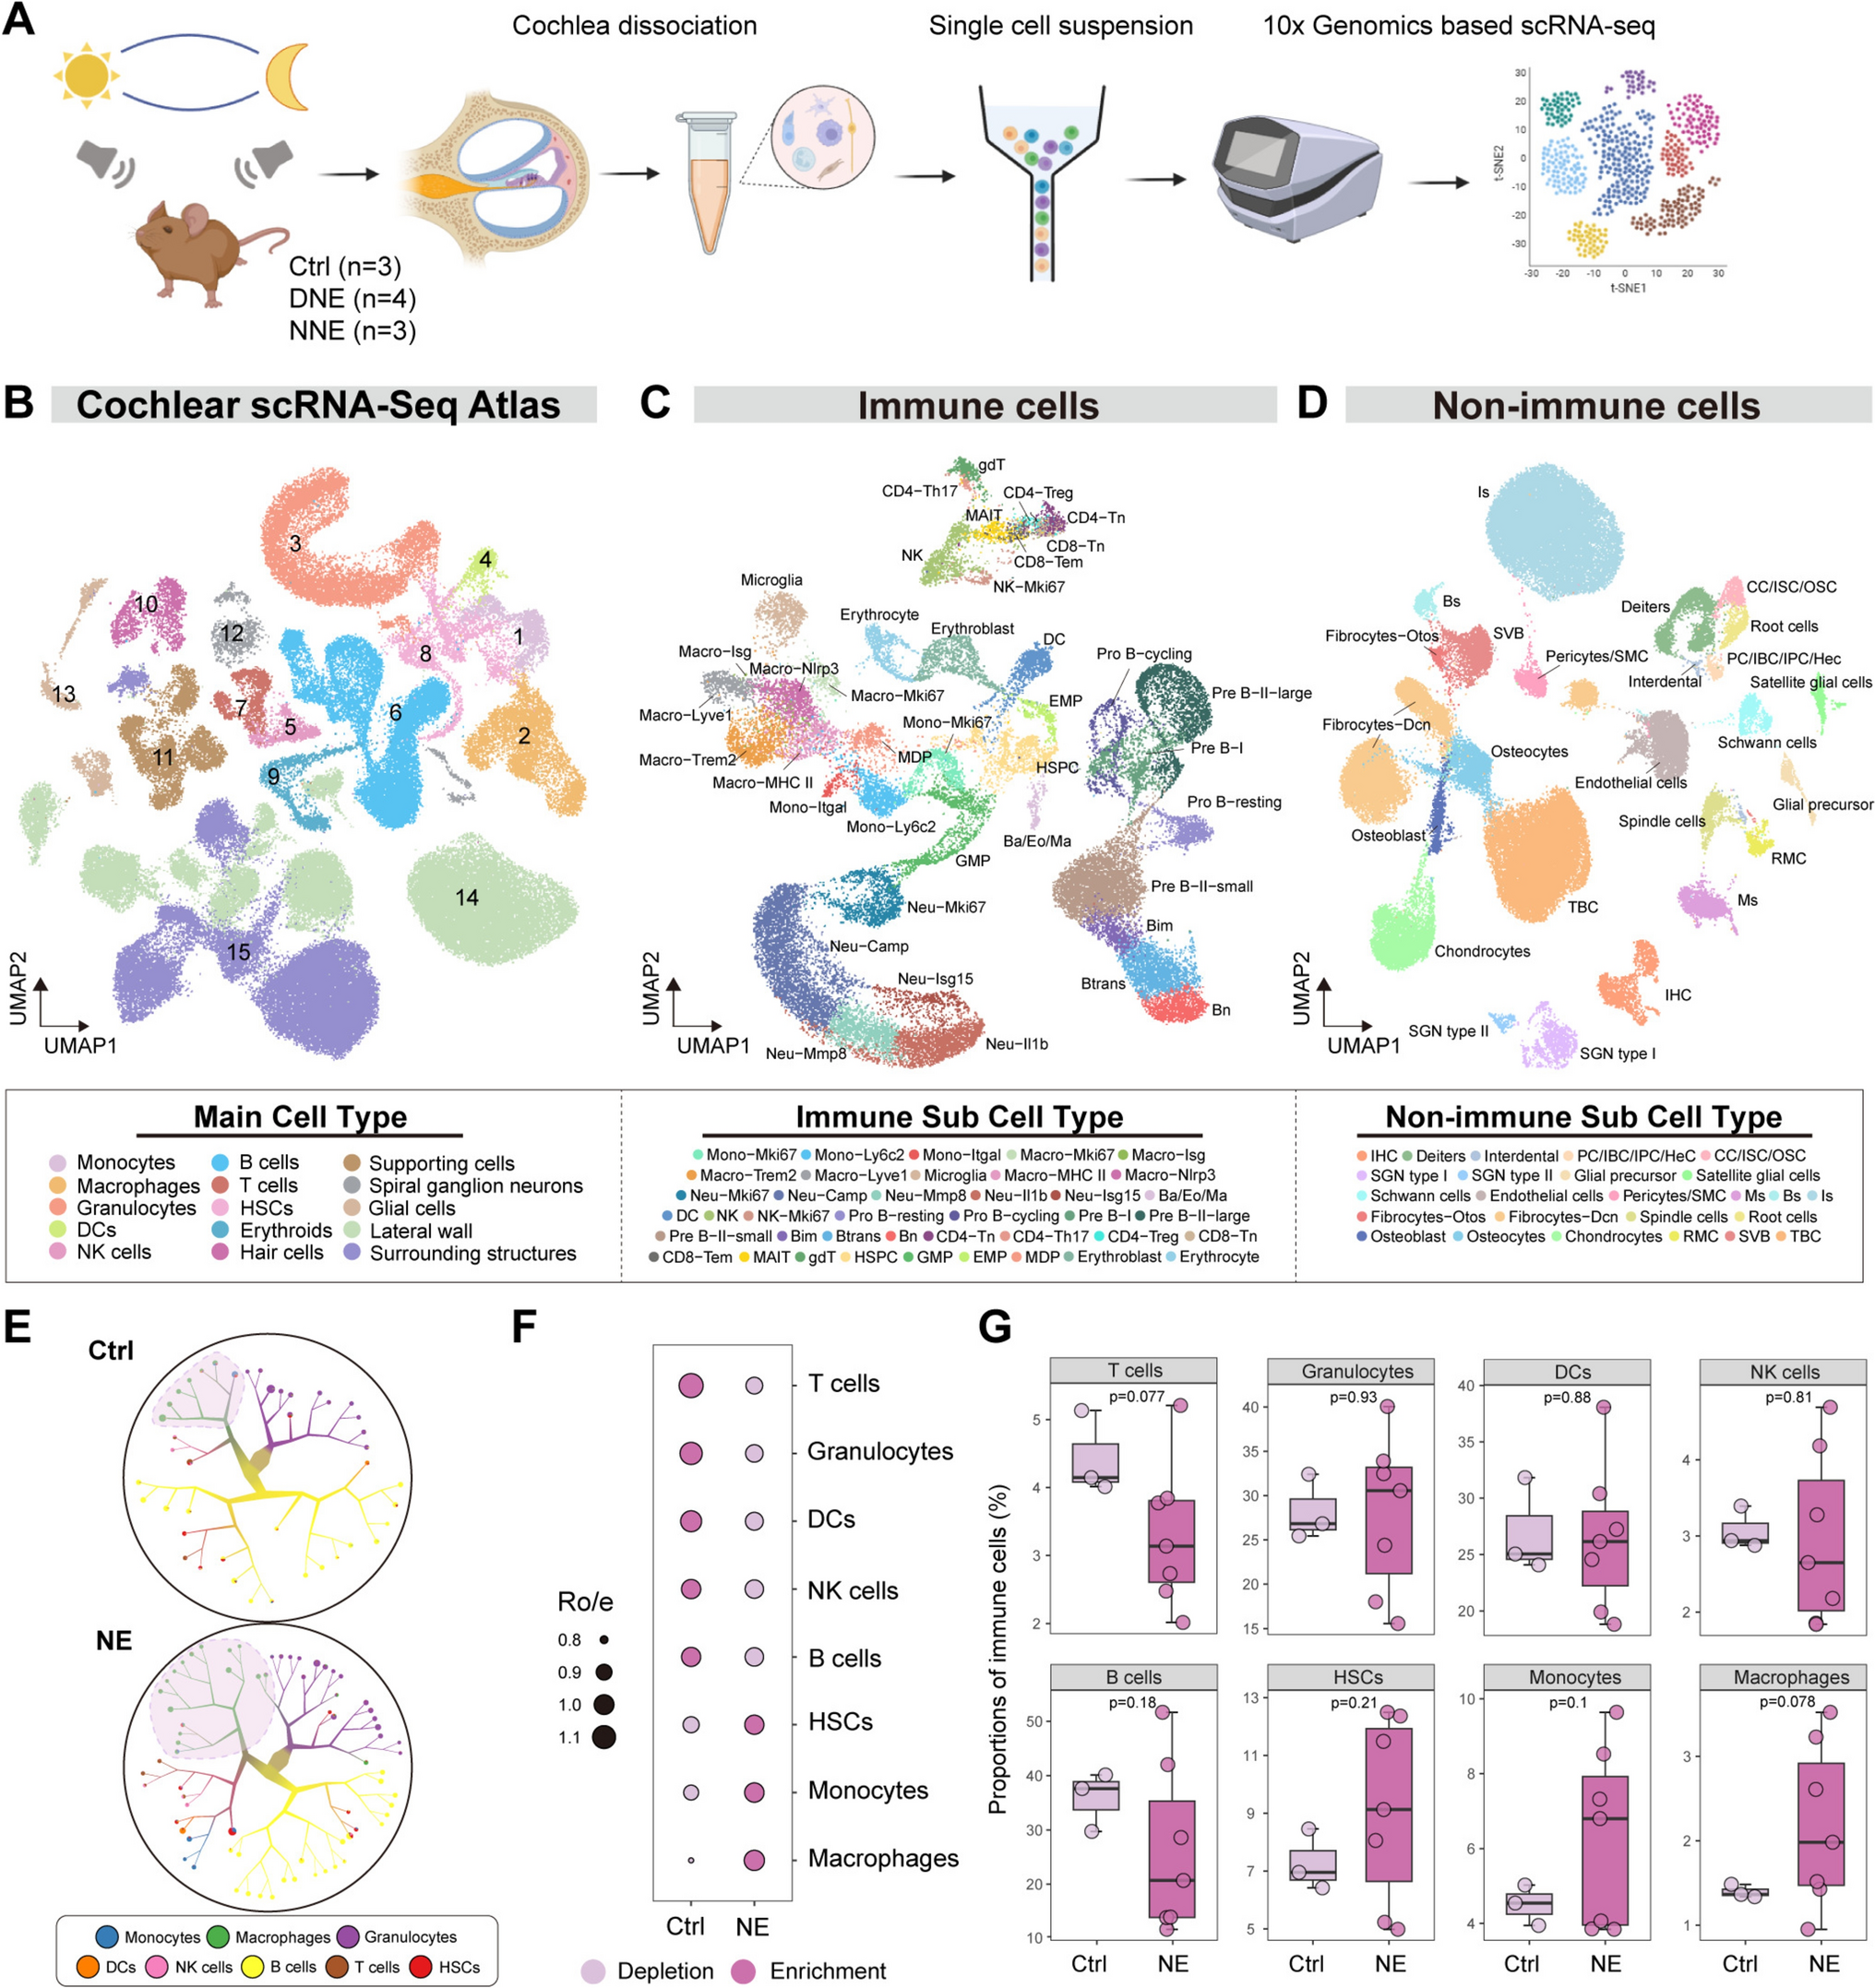
The organ of Corti, along with the lateral wall and modiolus containing the spiral ganglion, was isolated and dissociated into a single-cell suspension using a Dissociation Kit (Miltenyi Biotec, 130-096-730, Germany). Mouse cochlear cells were isolated in cold Dulbecco's PBS without Ca2+ and Mg2+, and 1% fetal bovine serum (Gibco, A3161001C, USA) was added to generate single-cell suspensions. Cells were then filtered through a 40-μm cell-strainer nylon mesh (Falcon, 352235, USA). Live cells (DAPI-negative, DRAQ5-positive) were sorted using a FACS Aria II (BD Biosciences, USA) and subsequently subjected to single-cell analysis. The sorted cells were sequenced using the 10× Chromium single-cell platform with 3' Reagent Kits, according to the manufacturer's protocol. The single-cell libraries were sequenced using the Illumina NovaSeq platform.
ScRNA-seq Data Quality Control, Processing, Annotation, and Visualization
The dataset was aligned and quantified using the CellRanger single-cell software suite (V3.1.0) with default settings. The CellRanger count function was used to quantify the sample-specific FASTQ file and aligned to the mouse reference genome (mm10). For downstream analysis, the filtered gene expression matrix was used.
The downstream analysis of scRNA-seq data was conducted using the single-cell toolkit Seurat (V5.1.0) [29] in R (V4.1.2). To ensure high-quality cells, only those with at least 500 detected genes and fewer than 10% mitochondrial genes were included. To minimize false positives related to biological heterogeneity and technical factors such as sequencing depth, feature counts were normalized using the LogNormalize function in Seurat [29] with a scaling factor of 10,000. For variable gene selection, we identified features with the highest coefficients of variation using the FindVariableFeatures function in Seurat [29], selecting the top 2,000 variable features for dimensionality reduction by default. To address batch effects, the principal component analysis matrix containing 40 components was transferred to Harmony (V0.1.1) [30]. In the batch-corrected space, uniform manifold approximation and projection (UMAP) implemented through the RunUMAP function in Seurat [29], was applied for dimensionality reduction, with visualization based on the resulting cell embedding coordinates.
We conducted systematic two-round unsupervised clustering using the FindClusters function in Seurat [29], setting the resolution at 1.0 and utilizing the top 30 principal components to define cell identities. In the first round of clustering, cells were divided into hematopoietic (Ptprc+, Hbb+) and non-hematopoietic types due to the presence of a hematopoietic system in the cochlea. Clusters exhibiting high expression of two or more lineage markers simultaneously were identified as putative doublets and excluded from further analysis [31]. The identification of major cell types and the removal of doublets were conducted iteratively to ensure the purity of all primary cellular compartments. An additional round of unsupervised clustering was then allied to identify fine-grained cell subtypes using the previously described methods. Marker genes for each cluster were identified using the Wilcoxon rank-sum test through the FindAllMarkers function in Seurat [29]. Only genes with |avg_logFC| >0.5, min.pct >0.5, and Padj < 0.05 were considered marker genes. Cell types were identified based on the expression of established marker genes, with the specific differentially-expressed genes (DEGs) for each cell type listed in Tables S1 and S2.
We applied cluster analysis using TooManyCells (V2.2.0.0) [32] to visualize the relationships among cell clades and identify significant differences between the control and noise-exposed groups. The cell clades facilitated the visualization of differences among cell subsets, with the background region specifically highlighting the activation of cochlear macrophages following noise exposure. To quantify cell type enrichment across groups, we calculated the observed versus expected cell numbers in each cluster using the formula Ro/e = Observed/Expected [33], where the expected cell numbers for each cell cluster are derived from the χ2 test. A cluster was considered enriched in a particular group if the Ro/e ratio was >1.
Functional Enrichment, Differential Gene Expression, and SCENIC Analysis
To assess pathway activity at the single-cell level, we used the VISION package (V3.0.1). Canonical pathway gene sets were obtained from the MsigDB database (V2023.2) [34, 35] and used to score individual cells. We utilized the FindMarkers function in Seurat [29] to identify noise-associated DEGs between the control group and the DNE or NNE group in non-immune cells. Only genes with |avg_logFC| >0.25 and Padj < 0.05 were classified as noise-associated DEGs (specific DEGs for each non-immune cell type are detailed in Table S3). To further annotate the functional implications of these DEGs, we applied Gene Ontology (GO) term enrichment analysis using ClusterProfiler (V4.2.2), with default settings (datasets: org.Mm.eg.db V3.18.0).
We applied single-cell regulatory network inference and clustering (SCENIC) analysis [36] to predict the transcriptional regulatory network in macrophages, using the 10,000 motifs database from RcisTarget (V1.14.0), along with GENIE3 (V0.16.0) and AUCell (V1.16.0). The normalized expression matrix generated by Seurat served as the input. After processing, the resulting matrix of transcription factor AUCell scores was integrated into the Seurat S4 object. Due to layout constraints, only 25 regulated targets per transcription factor were sampled and visualized using Igraph (V1.5.1).
Analysis of Ligand-Receptor Interaction
We used CellChat (V1.6.1) [37] to analyze ligand-receptor interactions between immune and non-immune cells using default settings. For each cell group, both outgoing and incoming interaction strengths were calculated. In addition, we used CellPhoneDB (V5.0) [38] to examine the ligand-receptor interaction between non-immune cells and immune cells, particularly macrophage clusters. Since the CellPhoneDB database includes both “ligand-receptor” and “receptor-ligand” notations for interactions, all interactions were standardized to consistently follow the ligand-receptor format.
Inner Ear Total RNA Extraction and Bulk RNA Sequencing
Cochleae were collected as described previously. The tissue was immediately transferred to a clean dish containing ice-cold RNAlater solution (Invitrogen, AM7024, USA). Total RNA was extracted from the excised tissue using the RNAiso Plus (Takara, 9108, Japan) following the manufacturer’s protocol. The purity and concentration of RNA were assessed using a NanoDrop 2000 spectrophotometer (Thermo Scientific, USA). The integrity and quality of the RNA were assessed using the Agilent 2100 Bioanalyzer (Agilent Technologies, USA). Libraries were then constructed using the mRNA Library Prep Kit (Yeasen Biotech, China) according to the manufacturer’s instructions. These libraries were sequenced on an Illumina HiSeq X Ten platform at Berry Genomics (Beijing, China), generating 150-bp paired-end reads. The raw reads in FASTQ format were initially processed using fastp (V0.23.4) [39], where low-quality reads were removed to obtain clean reads. The clean reads were subsequently mapped to the mouse reference genome (mm10) using the STAR (V2.7.10b) alignment tool [40]. The fragments per kilobase of transcript per million mapped reads [41] for each gene were calculated, and the read counts of each gene were determined using FeatureCounts (V2.0.6) [42].
Western Blotting Analysis
Total cochlear protein was extracted using RIPA lysis buffer containing 1% protease inhibitor cocktail (Roche Diagnostics, 11873580001, Germany) and 1% phosphatase inhibitor cocktail (Thermo Fisher Scientific, WG332461, USA), following the manufacturer’s instructions. Protein was quantified using the BCA protein assay kit (Beyotime Biotech, P0012S, China). Protein extracts were subjected to SDS-PAGE and transferred to PVDF membranes (Millipore, IPVH00010, and Immobilon-P, USA). After blocking with 5% non-fat dried milk for 1 h, the protein bands were incubated with primary antibodies at 4°C overnight. The following primary antibodies were used: rabbit anti-NLRP3 (Cell Signaling Technology, 15101, USA), rabbit anti-phospho-NF-κB p65 (Cell Signaling Technology, 3033, USA), rabbit anti-IL-1 beta (Abcam, ab234437, USA), rabbit anti-IL-18 (Abcam, ab207323, USA), rabbit anti-pro-caspase-1 (Abcam, ab179515, USA), and mouse anti-β-Actin antibody (Beyotime, AF0003, China). The next day, the membranes were washed with TBST (20 mmol/L Tris–HCl, 500 mmol/L NaCl, and 0.1% Tween-20) and then incubated with horseradish peroxidase (HRP)-conjugated secondary antibodies for 1 h. After washing three times, protein bands were visualized using an enhanced chemiluminescence kit (Meilunbio, MA0186, China) on an Amersham Imager 600 (GE Healthcare, USA). The images were quantified using ImageJ software (National Institutes of Health, USA).
Multiplex Immunohistochemical (mIHC) Staining and Imaging of the Cochlea
The fixation and decalcification processes were the same as those used for whole-mount staining of the cochlea described above. The cochleae were dehydrated through a series of graded ethanol incubations, then embedded in paraffin, and sectioned at 5–7 μm along the mid-modiolar axis. The sections were deparaffinized in xylene and rehydrated in a graded ethanol series. For antigen retrieval, an EDTA (pH 9.0) solution was preheated to 95°C for 15 min, and samples were stored until they cooled to RT. Endogenous peroxidase activity was blocked by incubating the samples in 3% H2O2 in 0.01 mol/L PBS for 20 min, followed by blocking with goat serum (Vector, S-1012-50, USA) for an additional blocking step.
Slides were then incubated with a primary antibody solution (1:1000 dilution) for 1 h at RT, labeled with HRP-conjugated secondary antibody for 20 min at RT, and visualized using tyramide signal amplification (TSA) fluorescent dyes (Panovue, 10001100100, China). Sections were prepared as previously described for additional antibodies, which required heating in citric acid buffer (pH 6.0) and sequential incubation with goat serum, primary antibodies, secondary antibodies, and TSA fluorescent dyes. The following primary and secondary antibodies were used: recombinant rabbit monoclonal anti-CD68 (Abcam, ab303565, USA), recombinant rabbit monoclonal anti-IL-18 (Abcam, ab223293, USA), recombinant rabbit monoclonal anti-IL-1 beta (Abcam, ab234437, USA), and the ImmPRESS® HRP Goat Anti-Rabbit IgG Polymer Detection Kit (Vector, MP-7451, USA). Following nucleus staining with DAPI, slides were scanned and images were acquired using a confocal laser scanning microscope (Carl Zeiss, Zeiss LSM 880, Germany).
Drug Treatments
Clodronate liposomes (CLs) (Yeasen Biotech, 40337ES08, China) were administered to mice via caudal vein injection at a dose of 200 µL per mouse. Injections were given once before noise exposure and again one day after. CY-09 (5 mg/kg, MedChemExpress, HY-103666, USA), an NLRP3 inhibitor with excellent selectivity and specificity [43], or a vehicle solution (5% DMSO, 40% PEG300, 5% Tween 80, and 50% saline) was administered intraperitoneally once daily for 10 consecutive treatments. Noise exposure was initiated 7 days after drug administration.
Statistical Analysis
We defined a statistically significant difference as P < 0.05. All sequencing data were assessed using R (V4.1.2) and experimental data were analyzed and plotted using GraphPad Prism (V8.0) software. For comparisons between two groups, unpaired two-tailed Student's t-tests were applied. For comparisons involving more than two groups, one-way or two-way analysis of variance (ANOVA) with Bonferroni's correction for multiple comparisons was utilized. Unless otherwise stated, bar plots are presented as the mean ± standard deviation (SD; error bar). All experiments were conducted in triplicate or greater and independently repeated.
Ethics Statement
All animal experiments were approved by and performed in accordance with the guidelines of the Institutional Animal Care and Use Committee of the Ninth People’s Hospital, Shanghai Jiao Tong University School of Medicine (approval number SH9H-2020-A712-1).


Comments (0)