
Remember me

The C57BL6/cmdb female mice (Experimental Medicine Centre, Medical University in Bialystok) were kept under pathogen-free conditions following Good Laboratory Practice standards. The mice were housed on a 12-h light/dark cycle with controlled temperature and humidity. The study was reviewed and approved by the Local Ethical Committee in Olsztyn, Poland (number 35/2019). The experimental asthma model was established as previously reported [27]. Briefly, female C57BL6/cmdb mice, aged 8–10 weeks, 5 animals per group (10 animals in total allocated randomly in the groups by research group members), were subjected to intranasal administration of 20 µl of HDM extract (Citeq) or saline (control group) for 3 weeks, with a 2-day break after every 5 days of exposure (Fig. 1A). Each administration delivered a dose of 100 µg of HDM, calculated based on total protein content (for detailed characteristics of the used HDM, please see online Supplementary Table S1). On day 22 of the experiment, the animals were sacrificed using overdosed isoflurane (Ramanweil) inhalation, followed by cervical dislocation. Subsequently, biospecimen collection, analysis, and biobanking were performed (Fig. 1A).
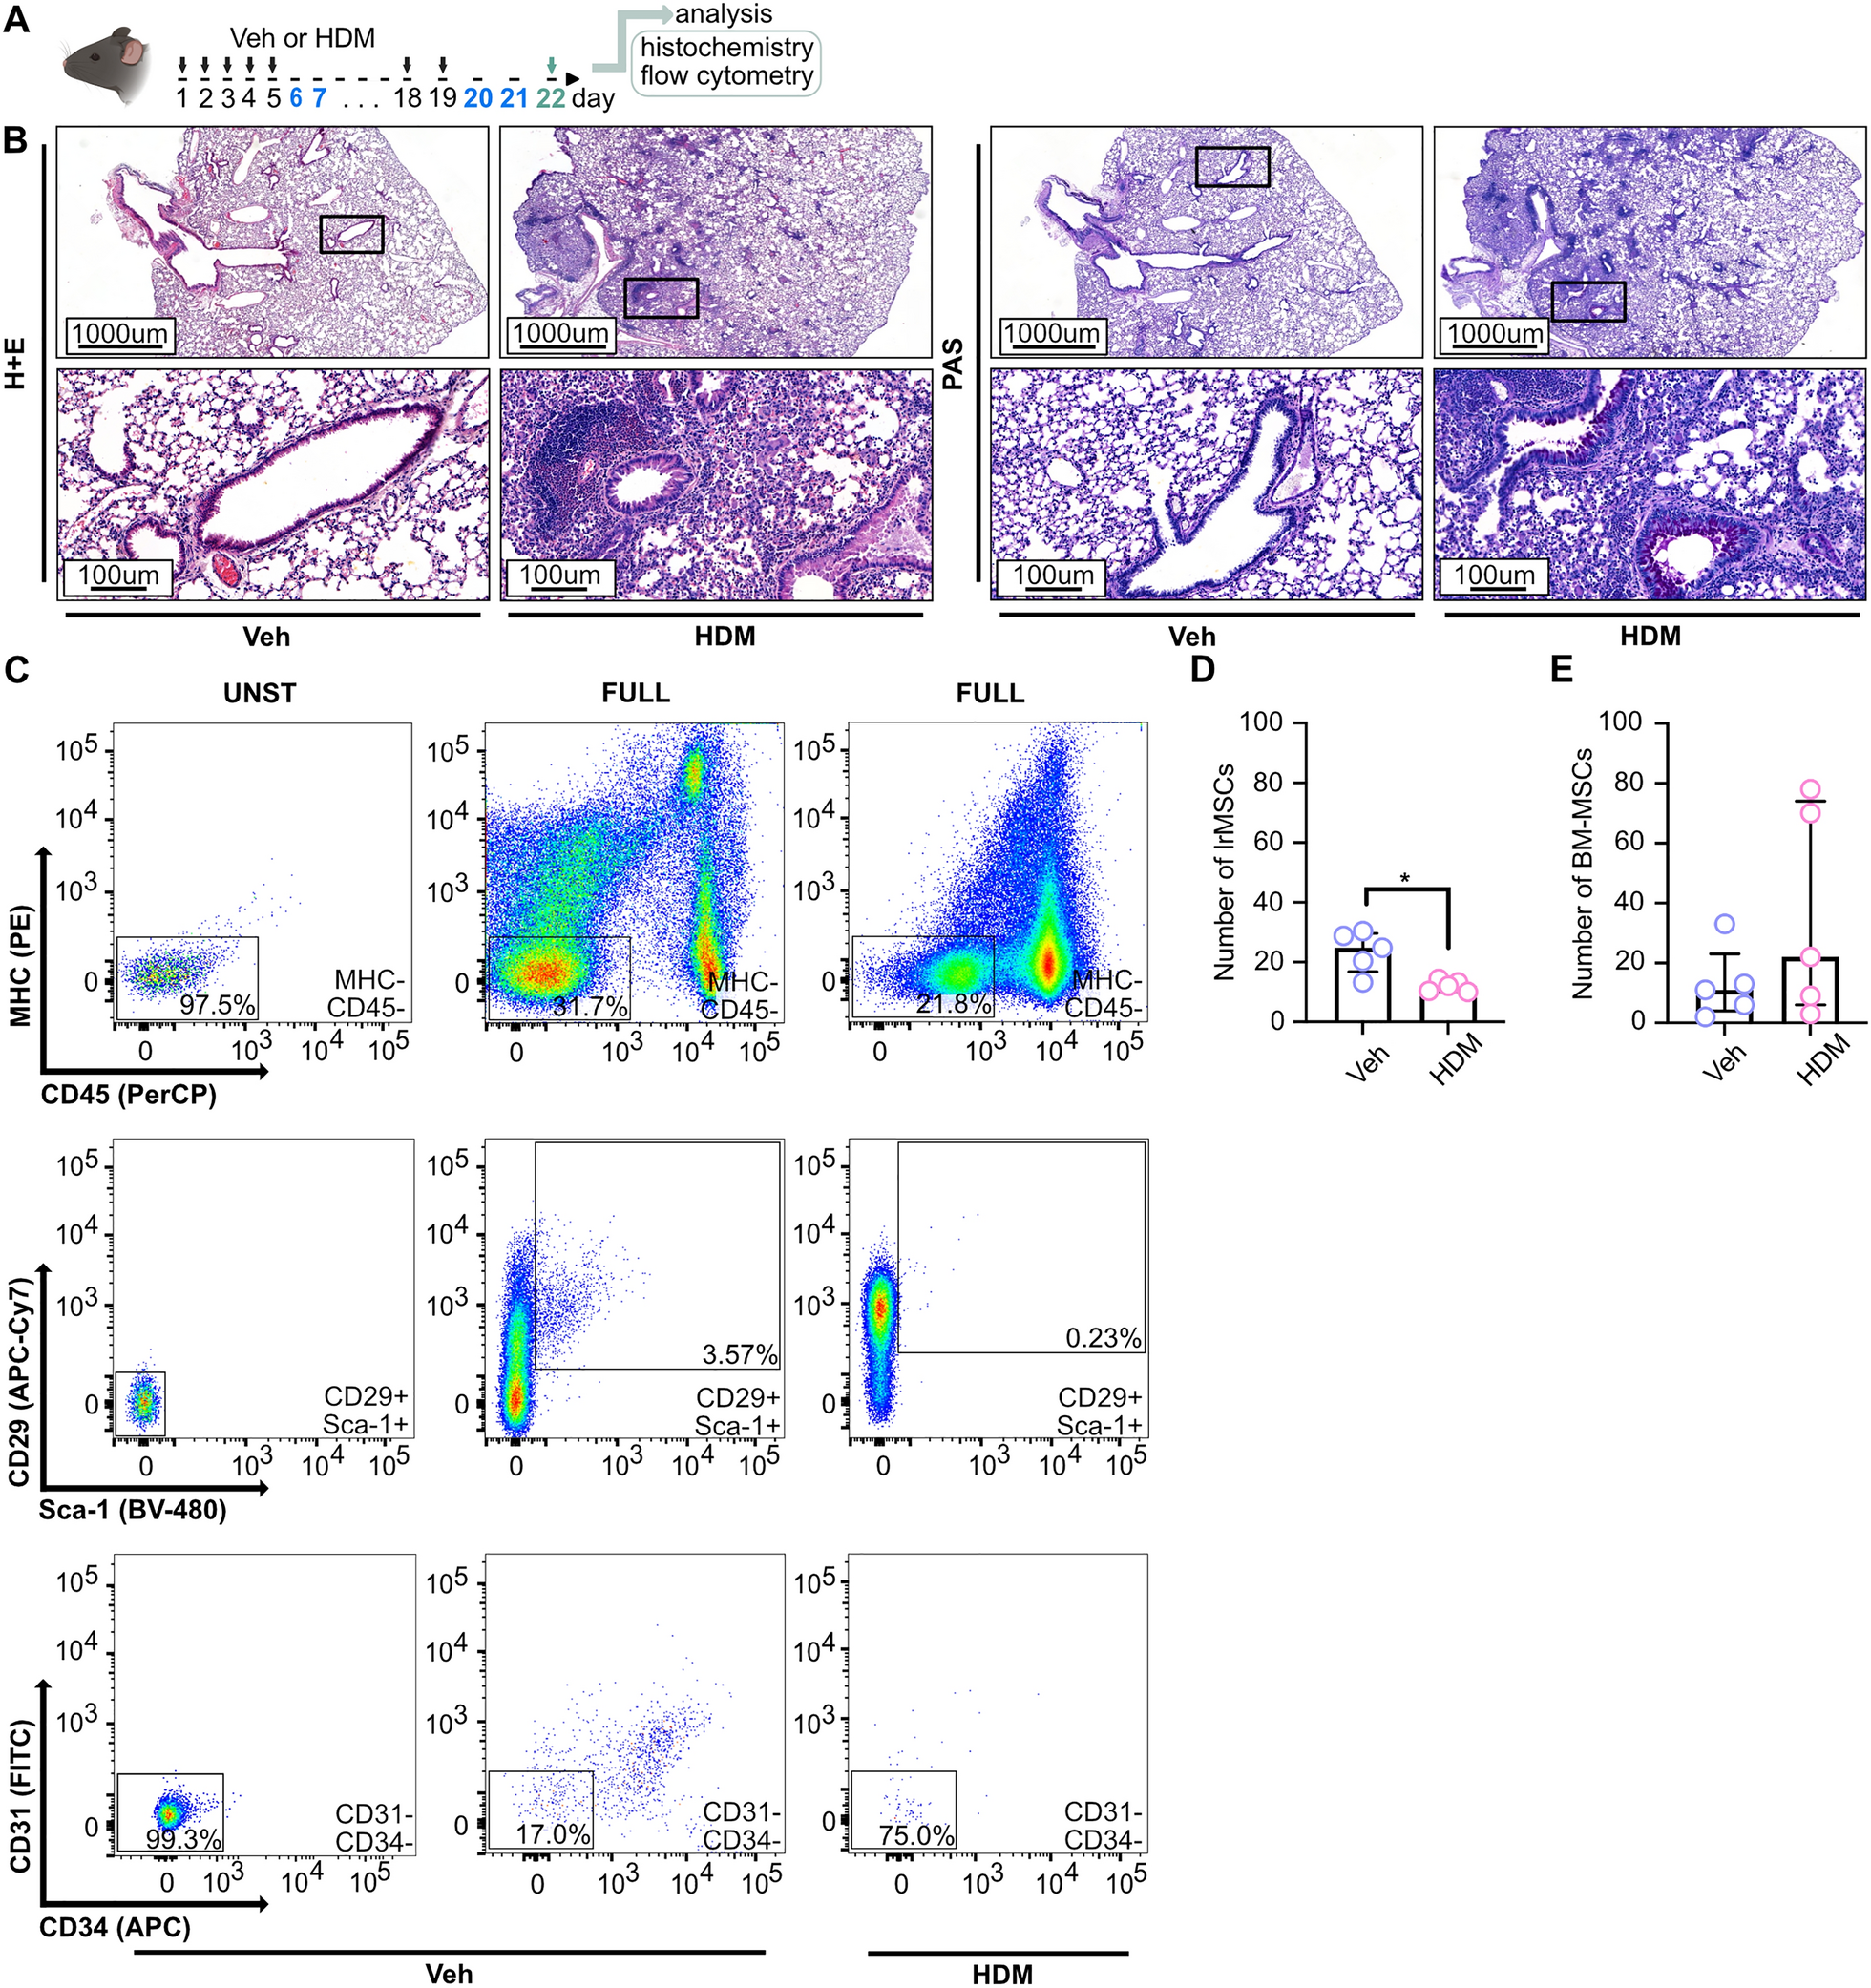
Fig. 1
The number of lrMSCs is decreased in asthmatic mice. A Schematic representation of the inflammatory phenotype induction in female C57BL6/cmdb mice via intranasal administration of house dust mite (HDM) extract (100 µg of protein) over three weeks. The exposure protocol included a cyclic pattern of five consecutive days of stimulation (black) followed by a two-day break (blue). The control group (Veh) received 0.9% sodium chloride (NaCl) as a vehicle. Mice were euthanized 72 h after the final HDM exposure (green), and lung tissue was collected for analysis: the upper left lobes were processed for histological staining, while the right lobes were used for flow cytometry. B Representative lung tissue Sects. (3 µm) demonstrate increased inflammatory cell infiltration, as visualized by hematoxylin and eosin (H&E) staining, and enhanced mucus production, as indicated by periodic acid-schiff (PAS) staining, in HDM-exposed mice compared to controls. C Gating strategy for lung-resident mesenchymal stromal cells (lrMSCs), identified within the CD45⁻ MHC⁻ population as CD29⁺ and Sca-1⁺ cells. D Summary of quantitative analysis of lrMSCs numbers in HDM-exposed mice compared to controls. E Summary of quantitative analysis of bone marrow (BM)-MSCs numbers in HDM-exposed mice compared to controls. Statistical significance was determined using the Wilcoxon test (*p < 0.05; n = 5)
Histochemical stainingsThe lungs were initially fixed in 4% paraformaldehyde (PFA, Santa Cruz Biotechnology), followed by paraffin embedding. Next, 3 µm-thick microtome sections were prepared and mounted on glass slides. Hematoxylin–eosin (H&E) staining served to evaluate inflammatory cell infiltration within the lungs, while periodic acid-schiff (PAS, Roche) staining was employed to assess mucus production, following standard protocols. The stained slides were visualized using a Panoramic 250 Flash III DX (3DHISTECH) and SlideViewer 2.8 software (3DHISTECH).
Isolation of lung resident Mesenchymal Stromal CellslrMSCs were isolated from the right lung lobes, which were initially washed with PBS (Corning), then cut into 2–4 mm pieces, and incubated for 45 min at 37 °C in 0.1% collagenase IV (1 mg/ml, Gibco). The resulting cell suspension was filtered through 100 µm cell strainers (Biologix) and then centrifuged at 400 g for 5 min. The lrMSCs were subsequently cultured in media from the MesenCult Expansion Kit (StemCell) supplemented with gentamicin (15 µg/ml, Gibco) until the second passage. Thereafter, lrMSCs were phenotypically and functionally analyzed according to the criteria set by the International Society for Cellular Therapy (ISCT) [29]. The cells exhibited adherence to plastic, expressed CD29 and Sca-1, lacked CD31, CD34, CD45, and MHC class II, and demonstrated the ability to differentiate into adipocytes and osteoblasts. Cell viability and density were evaluated by independent observers using trypan blue (Thermo Fisher Scientific) in the Bürker chamber, ensuring the preparation was of high quality for experimental use. The cells were used for functional T cell suppression assay.
Peripheral blood mononuclear cell isolationThe isolated human peripheral blood mononuclear cells (PBMCs) from a buffy coat were obtained from the Regional Blood Donation Centre, Bialystok. The collection of buffy coats was approved by the Bioethics Committee at the Medical University of Bialystok (number R-I-002/634/2018, approved 28 February 2019). Study participants provided written informed consent, and the study was conducted under the principles of the Helsinki Declaration. PBMCs isolation was performed using a density gradient centrifugation (Pancoll, PANBiotech) at 1200 g for 25 min. After 8–10 washing steps with MACS buffer (PBS supplemented with ethylenediaminetetraacetic, Invitrogen), remaining red blood cells were lysed by incubating the samples for 10 min with freshly prepared 1 × lysing solution (Pharm Lyse Lysing Buffer with cell culture grade water 1:10, BD Biosciences), followed by washing with PBS without calcium and magnesium ions (Corning). Cell viability and cell count were assessed using trypan blue (Thermo Fisher Scientific) in the Bürker chamber.
Human adipose tissue-derived mesenchymal stromal cell isolationAdipose tissue was obtained from donors qualified for abdominoplasty surgery and admitted to the 1 st Clinical Department of General and Endocrinology Surgery, Medical University of Bialystok Clinical Hospital. Adipose tissue fragments obtained from resected skin folds were collected following approval from the Bioethics Committee at the Medical University of Bialystok (APK.002.114.2021). Study participants provided written informed consent, and the study was conducted in accordance with the provisions of the Helsinki Declaration. Human adipose tissue-derived (hAD)-MSCs were isolated as previously described [28]. Briefly, tissue digestion with collagenase IV (1 mg/ml, Gibco) was followed by cell isolation, culture in Mesenchymal Stem Cell Basal Medium (ATCC) supplemented with 15 μg/ml gentamicin (Gibco), and expansion up to the second passage. Then, hAD-MSCs were identified following the criteria of the ISCT [29]. MSCs exhibited adherence to plastic, expressed CD73, CD90, and CD105, lacked CD45 and HLA-DR, and demonstrated differentiation potential into adipocytes, osteoblasts, and chondrocytes. Cell viability and density were verified by independent observers using trypan blue (Thermo Fisher Scientific) in the Bürker chamber, ensuring high-quality preparation for experimental usage.
PBMCs stimulationFreshly isolated PBMCs were directly seeded on 24-well plates (NEST) (1mln cells/ml) and incubated for 24 h in 5% CO2 at 37 °C in R10 medium (RPMI1640 supplemented with 10% Fetal Bovine Serum, PAN Biotech) either with 0.9% sodium chloride (NaCl) or in the presence of lipopolysaccharide (LPS) (0.25, 0.5, and 1 µg/ml, InvivoGen) or HDM (3.55, 7.1, 14.2 µg/ml, Citeq). Next, the cell stimulation medium was collected and centrifuged at 400 g for 5 min to remove any remaining cells and used for MSC stimulation.
hAD-MSCs stimulationThe optimized medium was specifically designed to stimulate hAD-MSCs, which were cultured in 24-well plates (NEST) in 5% CO2 at 37 °C with MSC basal medium (ATCC) at the 3rd passage upon reaching 70–80% confluence. At that point, hAD-MSCs were washed twice with PBS (Corning) and then exposed to a 1:1 mixture of MSC-specific medium and PBMC-conditioned medium, which was prepared immediately before use.
Simultaneously, hAD-MSCs were directly stimulated for 24-120 h with the same stimulants (LPS or HDM), following the same procedure previously applied to PBMCs, including control (NaCl). Moreover, hAD-MSCs cultured under the same conditions as described above were exposed directly to cytokines: IL-1β (25 ng/ml, R&D Systems), IFNγ (50 ng/ml, R&D Systems), TNF (25 ng/ml, R&D Systems), or a mix for 24 h. Stimulation with only NaCl served as a control (Veh).
MSCs differentiation analysisFollowing isolation, lrMSCs were differentiated into two mesodermal lineages: adipocytes and osteoblasts, using the Mouse Mesenchymal Stem Cell Functional Identification Kit (R&D Systems). Differentiation was evaluated using the kit-provided lineage-specific primary antibodies, namely goat anti-mouse fatty acid binding protein 4 (FABP4) for adipocytes (assessed after 14 days of differentiation), and goat anti-mouse Osteopontin for osteoblasts (assessed after 21 days of differentiation) according to the manufacturer’s protocol. Appropriate secondary antibodies were used for the detection of FABP4 and Osteopontin (donkey anti-goat IgG, Thermo Fisher Scientific).
The hAD-MSCs were differentiated after 24 h preincubation with LPS (1 μg/ml), HDM (14.2 μg/ml), IL-1β (25 ng/ml), IFNγ (50 ng/ml), TNF (25 ng/ml), or a mix of cytokines according to the protocol provided with the Human Mesenchymal Stem Cell Functional Identification Kit (R&D Systems). As a control, hAD-MSCs were stimulated with NaCl only. Differentiation was analyzed using the kit-provided lineage-specific primary antibodies, namely goat anti-mouse FABP4 for adipocytes (assessed after 14 days of differentiation), goat anti-human Osteocalcin for osteoblasts (assessed after 21 days of differentiation), and goat anti-human Aggrecan for chondrocytes (assessed after 21 days of differentiation) according to the manufacturer's protocol. Appropriate secondary antibodies were used for the detection of FABP4, Aggrecan (donkey anti-goat IgG, Thermo Fisher Scientific), and Osteocalcin (goat anti-mouse IgG1, Thermo Fisher Scientific). Finally, the slides were mounted in Prolong Gold with DAPI (Thermo Fisher Scientific) to stain the nuclei and analyzed using a Leica Stellaris 5 confocal microscope.
For quantitative image analysis, FABP4-positive adipocytes and Osteopontin- or Osteocalcin-positive osteoblasts were manually counted by visually identifying them using ImageJ software (NIH). Chondrogenic differentiation was quantified by measuring Aggrecan expression mean fluorescence intensity (MFI) using ImageJ (NIH) with fluorescence values normalized to background levels.
Flow cytometryThe total lung cells were isolated from the right lobes according to the protocol provided with the lung dissociation kit (Miltenyi Biotec), resuspended with MACS buffer, and passed through a 70 μm cell strainer (Miltenyi Biotec) to obtain a single-cell suspension. Cells were then stained with Armenian hamster anti-mouse CD29 (APC-Cy7, clone HMβ1-1, BioLegend), rat anti-mouse CD31 (FITC, clone 390, BioLegend), rat anti-mouse CD34 (APC, clone MEC14.7, BioLegend), rat anti-mouse CD45 (PerCP, clone 30-F11, BioLegend), rat anti-mouse Sca-1 (Alexa Fluor 700, clone D7, BioLegend), rat anti-mouse MHC class II (PE, clone M5/114.15.2, BioLegened) for 45 min at room temperature. After two washes in MACS buffer, cells were fixed in 1% PFA and analyzed within 24 h using a Canto II flow cytometer.
The AD-MSCs after 24-120 h exposed to used stimulants were stained with mouse anti-human: CD34 (Alexa Fluor 700, clone 581, BioLegend), CD45 (BB700, clone HI30, BD Biosciences), CD73 (FITC, clone AD2, BD Biosciences), CD90 (PE, clone 5E10, BD Biosciences), CD105 (APC, clone 43A3, BioLegend), and HLA-DR (PE-Cy7, clone L243, BioLegend) to confirm the phenotype.
PBMCs and hAD-MSCs were stained with Annexin V Apoptosis Detection Kit with Propidium Iodide (PI) (FITC, Invitrogen) to assess viability. Cells were washed twice with MACS buffer and resuspended in Annexin V Binding Buffer (Invitrogen). A 100 μl aliquot of the cell suspension was transferred to a new cytometry tube, followed by the addition of 5 μl of Annexin V and 10 μl of PI solution. After 15 min of incubation, 400 μl of Annexin V Binding Buffer was added to each tube, and the samples were immediately analyzed using the Symphony A1 cytometer and FlowJo 10.7.2. software (BD Biosciences).
Carboxyfluorescein succinimidyl ester (CFSE, Thermo Fisher Scientific), a fluorescent dye, was used to track PBMC proliferation. A 5 mM stock solution of CFSE, dissolved in dimethyl sulfoxide, was diluted in pre-warmed R10 media to acquire a 5 μM working solution. Then, cells with CFSE were incubated at 37 °C for 20 min in the dark. Next, PBMCs were centrifuged at 400 g for 7 min. The prepared cells were subsequently stimulated with Dynabeads mouse/human T-activator CD3/CD28 (Gibco) according to the protocol and analyzed after 96 h incubation in co-culture with lrMSC or hAD-MSCs, using murine or human PBMCs, respectively.
RNA isolation, qPCR, and mRNA transcript analysisTotal RNA was extracted from PBMCs using RNeasy Mini Kit (Qiagen) and from AD-MSCs after LPS or HDM stimulation using RNeasy Micro Kit (Qiagen) to evaluate the expression of selected genes designed by Primer-BLAST and synthesized by HPLC method (Genomed) (ACTB, 5’-ACAGAGCCTCGCCTTTGCC-3’, 5’-GATATCATCATCCATGGTGAGCTGG-3’; GAPDH, 5’-GGATTTGGTCGTATTGGGCG-3’, 5’- TCCCGTTCTCAGCCATGTAGT-3’; IL-6, 5’- CCACCGGGAACGAAAGAGAA-3’, 5’- TCTCCTGGGGGTATTGTGGA-3’). The quantity and purity of collected RNA were measured by a Nanodrop Microvolume Spectrophotometer (Thermo Fisher Scientific). Reverse transcription was conducted using the High-Capacity cDNA Reverse Transcription Kit (Thermo Fisher Scientific). The mix master for qPCR contained 5 µl SsoAdvanced Universal SYBR Green Supermix (BioRad), 2.5 μM of each primer, and 5 ng of cDNA. The parameters of the cycler were set as described: 10 min, 95 °C for hold; 40 cycles of PCR for 15 s, 95 °C, and 60 s, 60 °C; and melt curve for 15 s, 95 °C, and 60 s, 60 °C (StepOnePlus, Thermo Fisher Scientific). Data were normalized to the housekeeping genes, and the values were expressed as relative mRNA levels of specific gene expression as calculated using the 2−ΔΔCT method.
Additionally, total RNA was isolated from cytokine-stimulated hAD-MSCs as above. A total of 1 μg of RNA with a RIN > 8 was used for cDNA library preparation following the TruSeq Stranded Total RNA protocol (Illumina), and its quality was verified using the Agilent Technologies 2100 Bioanalyzer. Next-generation sequencing was performed on the Illumina HiSeq 4000 platform, generating 150 bp paired-end reads (2 × 75 bp). Sequencing quality was evaluated by FastQC version 0.11.5. Quality-filtered reads were mapped to the Human GRCh38 reference genome using the STAR aligner version 2.5.3a. Transcript per million (TPM) expression levels were acquired by running Salmon (v.1.10.1). The Index for running Salmon has been generated based on an ENSEMBL release 112, with the entire genome of the organism as the decoy sequence. This has been performed followin the Salmon manual by concatenating the genome to the end of the transcriptome and populating the decoys.txt file with the chromosome names.
ELISAAccording to the manufacturer’s instructions, the level of cytokines and growth factors, namely IL-6 and IL-10, was determined in cell culture supernatants through ELISA duo sets (R&D Systems). The plates were read using Varioscan Lux (Thermo Fisher Scientific) set to 450 nm, and the results were calculated relative to generated standard curves. The standard range for IL-6 was 9.38-600 pg/ml, and for IL-10 was 31.2-2000 pg/ml.
Statistical analysisStatistical analysis was conducted using GraphPad Prism version 9. The Wilcoxon test was employed to evaluate statistical significance, with a threshold of p < 0.05 considered significant.
Comments (0)