The work described in this paper has been reported in line with the ARRIVE guideline 2.0.
Culture and differentiation of hiPSCs into SMCs
hiPSCs were reprogrammed from cardiac fibroblasts with a CytoTune™-iPS Sendai Reprogramming Kit; four different lines of hiPSCs were used. hiPSC-C5 obtained from an explanted heart with approval from the Research Institutional Review Board (IRB) of the University of Minnesota [9]. hiPSC-GFP-Luciferase (hiPSC-GFP/Luc) was engineered from hiPSC-C5. Additional two hiPSC lines were reprogrammed from human atrial or ventricular cardiac fibroblasts (AhiPSCs or VhiPSCs, respectively) isolated from the left atrium and ventricle of an explanted heart with IRB approval from the University of Alabama at Birmingham (UAB) [10]. hiPSCs were cultured in mTeSR Plus media (StemCell Technologies, Canada) for 4–5 days until 80% confluent and dissociated with Versene (Thermo Fisher) two days before differentiation was initiated.
3D + 2D differentiation
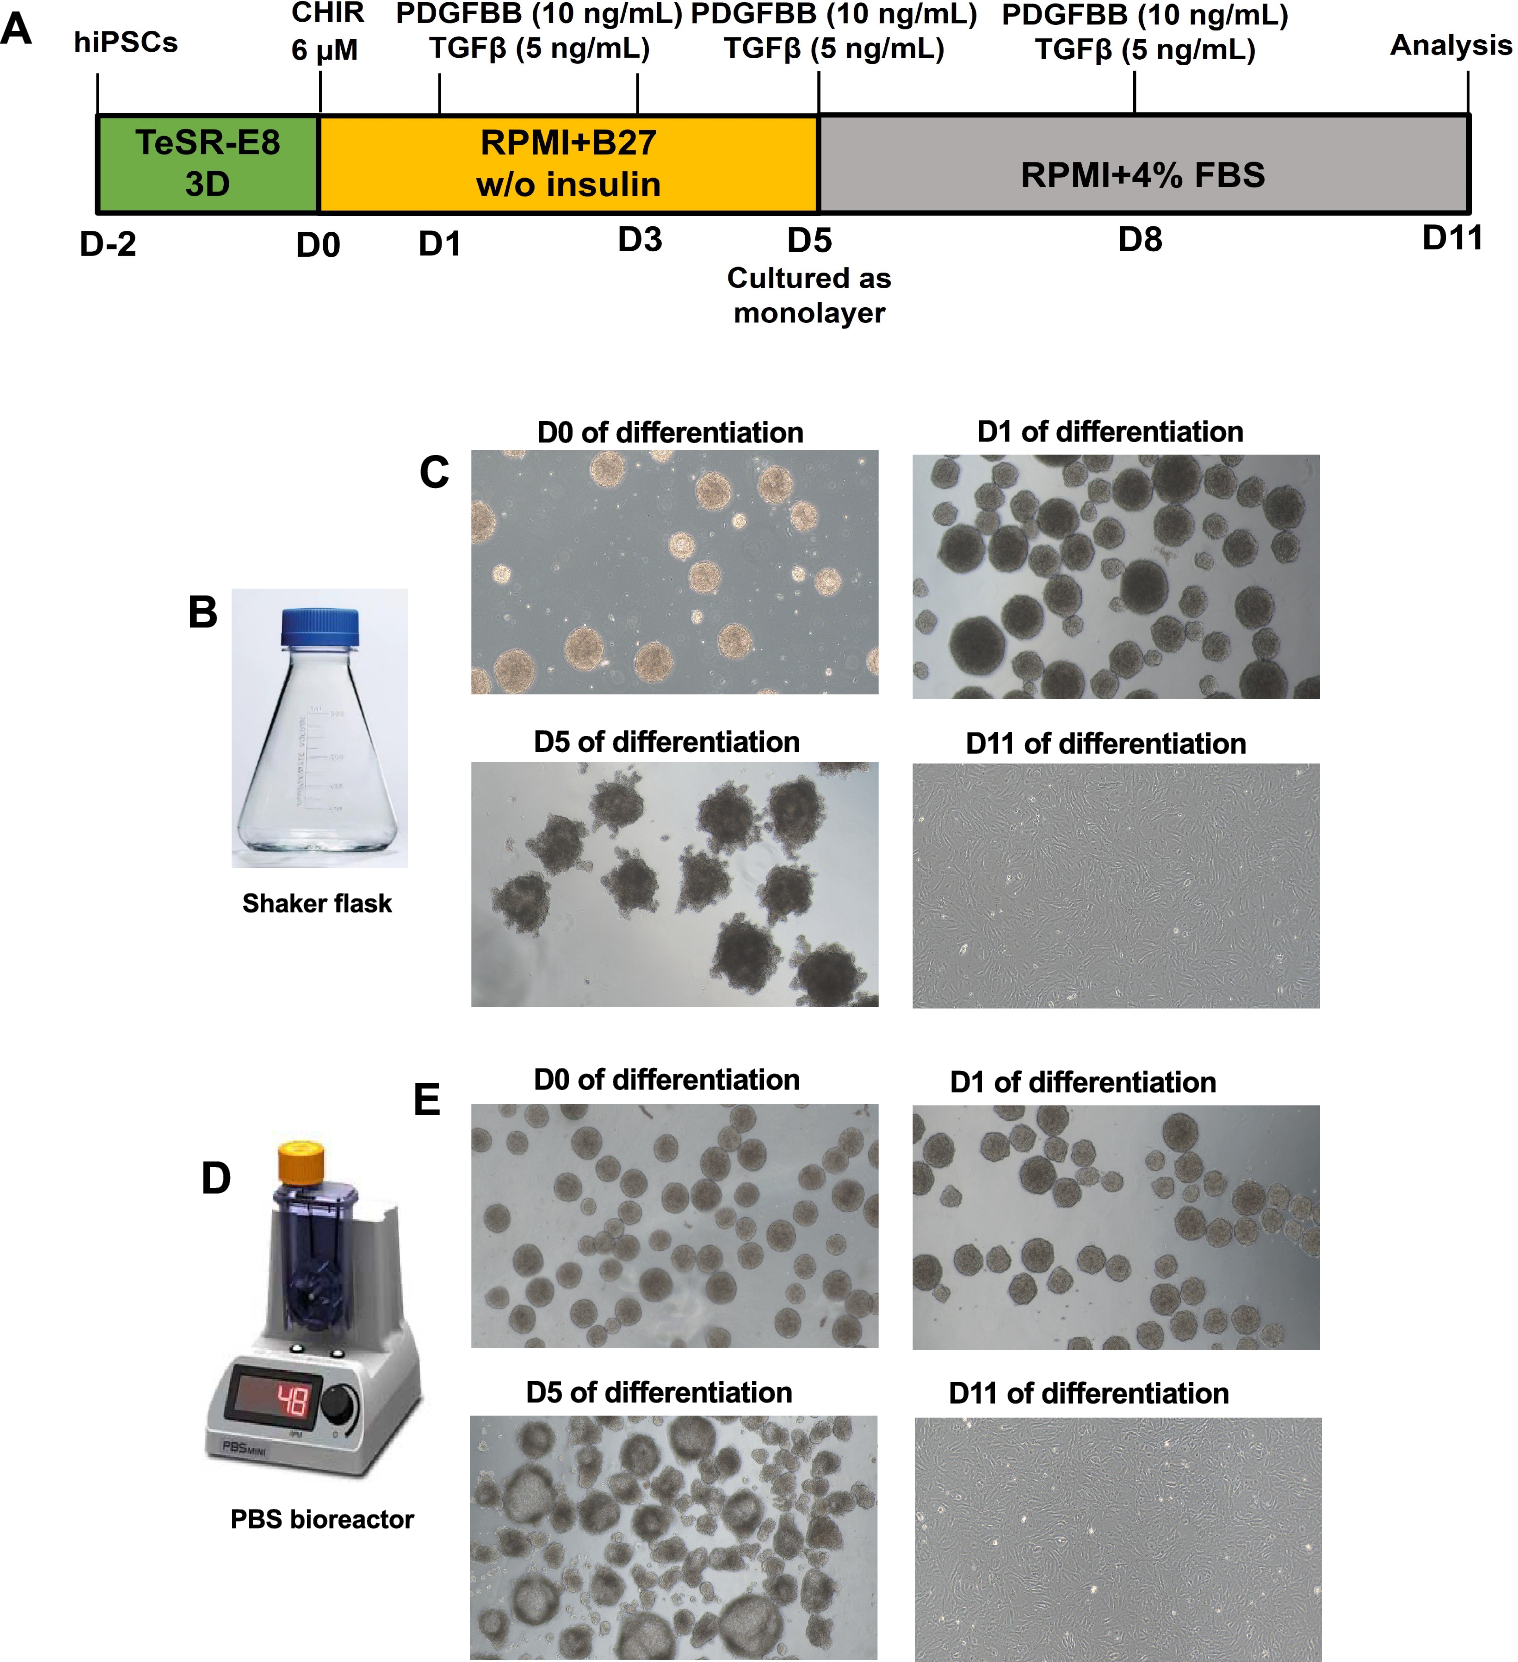
12 × 106 hiPSCs were seeded into shaker flasks (FPC0125S, TriForest)[11] or PBS-0.1 vessels (IA-0.1-D001, PBS Biotech) with 40 mL TeSR™-E8™3D seed medium (03990, StemCell Technologies, Canada) supplemented with 10 µM Y27632 (HY-10583, MedChem Express, USA) and cultured at 37 °C; flasks were cultured on a Belly Dancer shaker and PBS-0.1 vessels were cultured on a PBS-Mini Vertical-Wheel Bioreactor. 1.2 mL feed supplement (03993, StemCell Technologies, Canada) was added one day after seeding, and differentiation was initiated on Day 0 (D0) by replacing the 3D medium with 40 mL RPMI1640 (SH30027.02, Cytiva, USA) medium supplemented with 6 µM CHIR99021 (CHIR, MedChemExpress) and a 1:100 dilution of B27 without insulin (B27-, A1895601, Gibco, USA). On Day 1 (D1), the medium was replaced with 40 mL RPMI1640 medium supplemented with 10 ng/mL platelet-derived growth factor (PDGF)-BB (10572-H07Y-50, Sino Biological, USA), 5 ng/mL transforming growth factor β (TGFβ, 10804-H08H-50, Sino Biological, USA), and 1:100 dilution of B27–. The medium was refreshed on Day 3 (D3), and on Day 5 (D5), the spheroids were collected, dissociated into single cells, and cultured as monolayers in RPMI1640 supplemented with 4% fetal bovine serum (FBS, SH30910.03, Cytiva, USA), 10 ng/mL PDGF, and 5 ng/mL TGFβ for 3 days. The medium was refreshed on Day 8 (D8), and on Day 11 (D11), the differentiated hiPSC-SMCs were collected.
2D differentiation
6 × 10⁶ hiPSCs were seeded equally into each 6 wells of 6-well plate which were precoated with Geltrex (A1413302, Gibco, USA). 48 h later, differentiation was induced via the same series of medium changes used in the 3D differentiation protocols.
Quantitative real-time reverse transcription polymerase chain reaction (qRT-PCR)
qRT-PCR was performed as described previously [12, 13]. Samples were harvested on D0, D1, D3, D5, and D11 of differentiation. Total RNA was extracted using the RNEASY plus micro kit (74,134, Qiagen, USA), and reverse transcription was performed with the SuperScript® IV First-Strand Synthesis System (18091050, ThermoFisher Scientific, USA) as directed by the manufacturer’s instructions. qRT-PCR was performed with the PowerUp SYBR Green Master Mix (A25742, Applied Biosystems, USA) and appropriate primers (Table 1); thermal cycling was performed 40 times, and each cycle consisted of UDG activation for 2 min, enzyme activation at 95 °C for 2 min, denaturation at 95 °C for 1 s, and annealing at 60 °C for 30 s. Endogenous glyceraldehyde phosphate dehydrogenase (GAPDH) abundance was also measured and used as an internal control for normalization.
Table 1 Primers for qPCRFlow cytometry
Flow cytometry was performed as described previously [14, 15]. Briefly, cells were harvested, fixed in 4% paraformaldehyde (PFA), permeabilized with 0.1% Triton-X in DPBS, resuspended in DPBS supplemented with 2% FBS, incubated with primary antibodies (Table 2) for 30 min on ice, washed, incubated with secondary antibodies in 2% FBS for 30 min, washed again, resuspended in 2% FBS, and analyzed with an LSR Fortessa Flow Cytometer (BD Biosciences, USA). Only hiPSC-SMCs with adequate size and granularity were included in statistical analyses [14, 15].
Table 2 Antibodies used for flow cytometryImmunofluorescence staining
Immunofluorescence staining was performed as described previously [16,17,18]. Briefly, cells were seeded into 4-well chamber slides, fixed in 4% PFA, permeabilized with 0.1% Triton-X in PBS, blocked with Ultra V block for 7 min, incubated with primary antibodies (Table 3) in 10% donkey serum overnight at 4 °C. On the second day, cells were washed, incubated with secondary antibodies for 1 h at room temperature, stained with DAPI, washed, mounted in Vectorshield, and visualized with a confocal laser scanning microscope (Olympus FV3000 confocal microscope, Japan).
Table 3 Antibodies used in immunofluorescence stainingMigration assay
hiPSC-SMCs (2 × 10⁵ cells/well) were seeded into a 12-well plate containing smooth-muscle cell growth (SMCG) medium (Human Vascular Smooth Muscle Cell Basal Medium [M231500, Thermo Fisher] plus Smooth Muscle Growth Supplement [S00725, Thermo Fisher]) and cultured for 24 h to generate a monolayer of cells; then, the monolayer was scratched with a 200 µL pipette tip, washed with PBS, and incubated with fresh SMCG medium for 8 h. Images were collected with an Olympus CKX53 microscope.
Contraction assay
hiPSC-SMCs (2 × 10⁵ cells/well) were seeded into a 6-well plate in SMCG medium and cultured for 24 h; then, the medium was replaced with fresh SMCG medium supplemented with 50 µM of the prostaglandin H2 analog U46619 (SC-201242, Santa Cruz Biotech.) for 30 min, and images were collected with an Olympus CKX53 microscope.
Tube formation assay
Tube formation was evaluated as described previously [12, 19]. Briefly, 2.5 × 10⁴ cells were seeded in a 48-well plate that had been coated with Geltrex and incubated at 37 °C for 24 or 48 h; then, images were collected with an Olympus CKX53 microscope.
Murine hind limb ischemia (HLI) model and treatment
All protocols involving animals were approved by the Institutional Animal Care and Use Committee (IACUC) of the University of Alabama at Birmingham, Birmingham, Alabama, USA, and performed in accordance with the National Institutes of Health Guide for the Care and Use of Laboratory Animals (NIH publication No 85–23). In-house bred, twelve-week-old healthy, male and female NOD-SCID mice were used, and 2 animals were housed in one cage after surgery. All mice were housed at 25 °C with a 12 h light–dark cycle and had free access to food and water.
To determine whether differentiated hiPSC-SMCs had biological function to recover perfusion for the treatment of ischemic disease, HLI was induced in 15 NOD-SCID mice in a rodent surgery room as described previously, in which minimally 6 mice were required for each group [20, 21]. Briefly, mice were anesthetized with 2–2.5% isoflurane, hair was removed from the abdomen and rear limbs, and the right limb was disinfected with betadine and 70% alcohol. The femoral artery of the right hind limb was exposed and freed from the inguinal ligament via a longitudinal incision extending to a point just proximal to the patella. The artery and all branches from the inguinal ligament to the point where it bifurcates into the popliteal and saphenous arteries were closed with 8–0 polypropylene sutures; then, the wound was closed, and the animals were allowed to recover. Carprofen and buprenorphine were administered for at least 3 days after the surgical procedure, and the animals were randomly assigned to treatment with 1 × 10⁶ hiPSC-SMCs in 0.1 mL RPMI1640 (i.e., the hiPSC-SMC group, n = 6) or with 0.1 mL of cell-free RPMI1640 medium (i.e., the medium group, n = 9). Treatments were administered three days after HLI induction via four intramuscular injections into the center of the ligated area and the surrounding region. If mice had limb lost or limb volume reduced by 50% after femoral artery ligation, mice would reach humane endpoints and would be euthanized. Euthanasia was performed by sedating the mice with 2% isoflurane, then mice were decapitated under anesthesia.
Fluorescence angiography
To determine recovery of perfusion after HLI induction and treatment, mice were evaluated via fluorescence angiography on days 3 and 17 after HLI at small animal imaging facility core as described previously [22, 23]. Briefly, mice were anesthetized with 2–2.5% isoflurane and placed in a supine position; then, 100 µL of 0.9% saline mixed with 6.5 μL indocyanine green (ICG) fluorescent dye (2.5 mg/mL; ICN15502005, MP Biomedicals, Inc.) was injected into the tail vein. Immediately after dye injection, images of both hind limbs were collected with a LUNA Florence Angiography System (Model LU3000, Navodaq Technologies Inc., Canada) and analyzed. Measurements in the ischemic (right) limb were normalized to measurements in the nonischemic (left) limb and expressed as a percentage. People who did fluorescence angiogram and analysis were blinded to the treatment.
Immunohistochemistry
Mice were euthanized under anesthesia; then, the right and left limbs were collected, embedded into Tissue-Plus O.C.T. Compound (Fisher Scientific), and cut into cryosections[20, 21]. The cryosections were fixed in 4% PFA, permeabilized with 0.1% Triton-X, blocked in Ultra V block, and incubated with rat anti-mouse CD31 (553370, BD Biosciences) in 10% donkey serum overnight at 4 °C. On the second day, tissue samples were washed and incubated with donkey anti-rat IgG conjugated with Alexa-Fluor-488 (712-545-150, Jackson ImmunoResearch) for 1 h at room temperature. Then, tissue samples were incubated with phycoerythrin (PE)-conjugated mouse anti-smooth muscle actin (IC1420P, R&D Systems) for 30 min, stained with DAP, mounted with Vectorshield. To identify transplanted hiPSC-SMCs, cryosections were fixed, permeabilized, blocked, and co-stained with primary antibodies specific for human nuclear Ku80 (rabbit anti-human Ku80, 2180S, Cell Signaling) for overnight at 4 °C. On the second day, sections were washed and incubated with donkey anti-rabbit IgG conjugated with FITC for 1 h at room temperature. After washing, sections were stained SMA conjugated with PE for 30 min at room temperature. Then, sections were stained with DAPI, washed, and mounted with Vectorshield.
Fluorescence images were collected with an Olympus IX83 fluorescence microscope by blinded people who did not know animal group assignment, and vascular structures that were positive for CD31 expression, or for both CD31 and SMA expression were counted in 20 × high-power fields per section, 120 sections were cut from one leg of a mouse and one every ten sections were used for vessel staining. 7 animals from control group and 6 animals from SMC transplantation group were assessed for vessel density.
Statistics
Data are presented as mean ± standard deviation (SD) and analyzed using SPSS 20 software. Significant differences were identified via paired T-Test within the same group, independent T-Test for comparisons between two groups, or one-way analysis of variance (ANOVA) with the Tukey correction for comparisons among three or more groups. Statistical analyses were performed with SPSS software, and a P value of less than 0.05 was considered significant. If each mouse has left and right legs compared, paired T-Test should be used to get more power.


Comments (0)