Patient selection
This study was approved by the Narayana Nethralaya Ethics Committee (ECR/ 187/ Inst/ Kar/ 2013/ RR-16) and the institutional committee for stem cell research and therapy (NNF/ IC-SCR/ 05/MCDi) in adherence to the Indian Council for Medical Research (ICMR) guidelines and the tenets of the declaration of Helsinki. Written informed consent was obtained from the participants prior to recruitment and blood collection. The subjects were recruited from patients visiting department of cornea and refractive Surgery, Narayana Nethralaya, Bangalore, India. Clinical examination included slit lamp examination with topographic and pachymetric evaluation on the Pentacam HR (Oculus, Germany) and Orbscan (Orbtek, Bausch & 112 Lomb). Diagnosis of the MCD patients was based on the criteria laid by International Committee for Classification of Corneal Dystrophies (IC3D) [19] with the observation of macular opacities that are bilateral and asymmetric. Table 1, shows the details of the subjects in this study.
Table 1 Details of subjects and clinical descriptionGeneration of MCD patient derived iPSCs
10 ml of peripheral blood was collected from each of the two clinically identified MCD male patients and healthy adult male of Indian origin. Peripheral blood mononuclear cells (PBMCs) were isolated by density gradient centrifugation using lymphoprep (Stemcell Technologies, Vancouver, Canada) and cultured in StemSpan SFEM II medium (Stemcell Technologies, Vancouver, Canada) containing CD34+ expansion supplement (Stemcell technologies, Vancouver, Canada) for 72 h with medium change every 24 h and maintained in an incubator at 37 °C with 5% CO2. The PBMCs were transduced with CytoTune 2.0 Sendai viral reprogramming kit (Thermo Fisher Scientific, USA) with a multiplicity of infection (MOI) of 5/Per cell. The transduced cells were transferred to irradiated mouse embryonic fibroblasts (MEFs) (Thermo Fisher Scientific, USA) with the StemSpan SFEM II medium which was gradually replaced by mTESR1 medium (Stemcell Technologies, Vancouver, Canada) and maintained for 20 days, during which the reprogrammed cells formed colonies. The iPSCs were transferred onto ESC grade matrigel (Corning, USA) coated 12 or 6 well plate, maintained and expanded in mTeSR1 medium (STEMCELL Technologies, Vancouver, Canada). Mycoplasma contamination was checked with the Mycoplasma PCR Detection kit (EZdetectTM PCR Kit, HiMedia, India) as per the manufacturer's protocol.
Mutation analysis
2 ml of Peripheral blood was taken from MCD patients for total genomic DNA isolation by using QIAamp DNA blood mini kit (Qiagen, Hilden, Germany). Genomic DNA was amplified by PCR using primers covering coding regions of CHST6 gene [5] and listed in supplementary Table 2b. Bi-directional Sanger sequencing was performed to analyse the nucleotide changes in the cDNA of CHST6 as mentioned previously [5].
Karyotyping of the iPSC lines was performed with G banding at passage 14 at 450 resolutions. About 30 metaphase spreads were counted for analysis. Karyotype analysis was performed at Anand diagnostic laboratory in Bangalore, India.
Embryoid bodies (EB) assay
The MCD patient-derived and Ctrl iPSC colonies were initially dissociated into single cells using Accutase (Stemcell Technologies, Vancouver, Canada) for 5 min. Cells were seeded for embryoid body formation onto low attachment 96 well culture plate (Eppendorf, Germany) in StemFlex medium (Stemcell Technologies, Vancouver, Canada) for 7 days. The embryoid bodies formed were assessed for default differentiation as reported before [20].
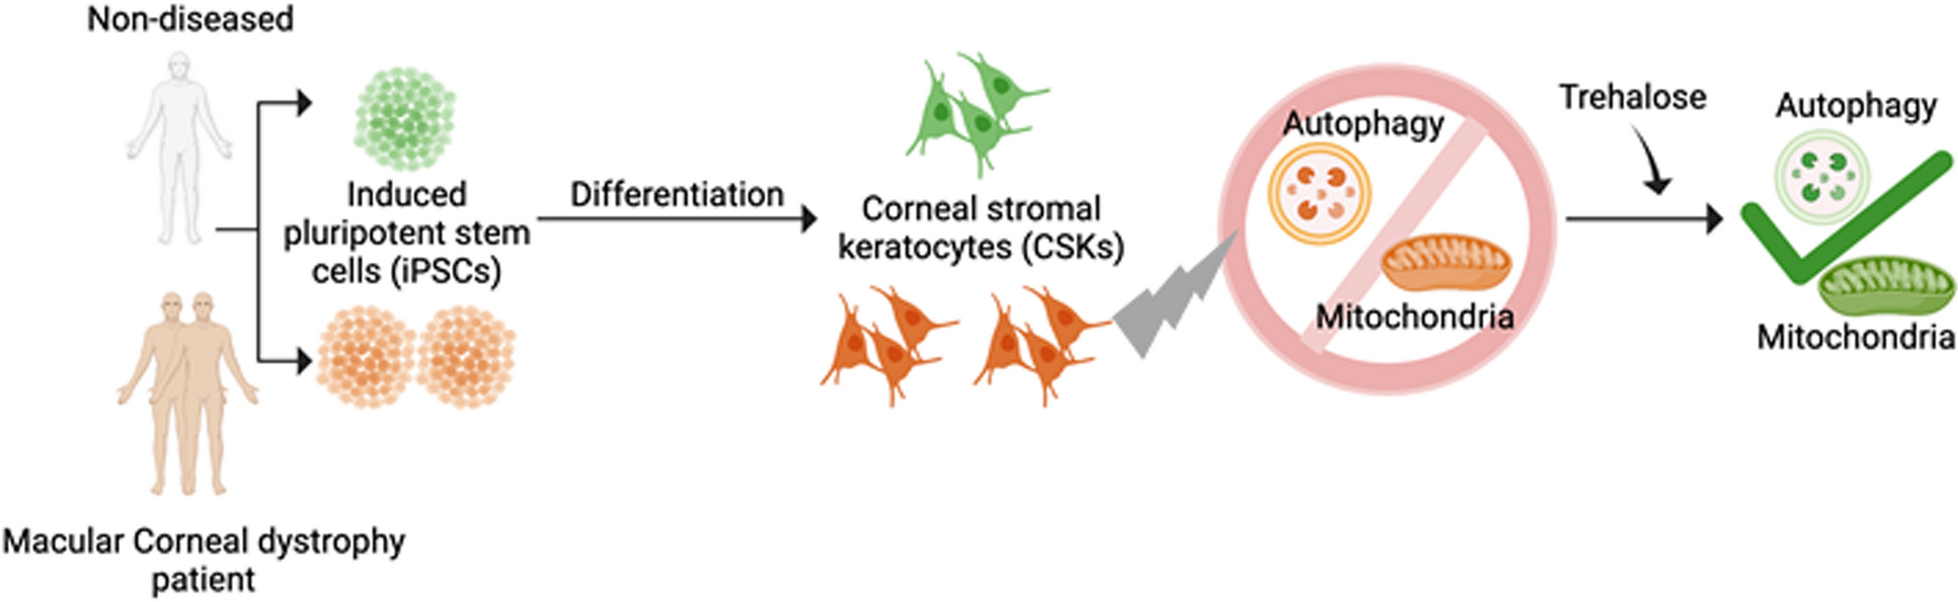
Differentiation of iPSCs to corneal stromal keratocytes via neural crest cell induction
Two-step protocol was followed towards directed differentiation of iPSCs to CSKs. First, the iPSCs were plated on growth factor reduced Matrigel (Corning, USA) and transitioned to neural crest medium which constituted of DMEM/F12 (Thermo Fisher Scientific, USA), 1% of B27 supplement (Thermo Fisher Scientific, USA), 1%- insulin-transferin-selenium (ITS) (SIGMA, USA), 1% - non essential amino acids (NEAA) (ThermoFisher Scientific, USA), 3 µM CHIR (Peprotech, USA), 5% FBS (ThermoFisher Scientific, USA), 1% Antibiotic–antimycotic (ThermoFisher Scientific, USA). Medium change was done daily and the NCC cells were harvested on day 7 for further differentiation to CSKs. NCCs were made to single cells suspension using Accutase (Stem cell technologies, Vancouver, Canada) and re-plated on growth factor reduced (GFR) matrigel (Corning, USA) at a density of 10,000 cells/ cm2. 2.5 μM of Y-27632 (Sigma, USA) was used in the media for the first 24 h. Transition to the CSK medium constituting of DMEM/ F12, 5% FBS, 0.1 mM ascorbic (Sigma aldrich, MO, USA) acid, 1% ITS, 1% NEAA, 100 ng/ ml of basic fibroblast growth factor (bFGF), 100 ng/ ml heparin, 1% antibiotic–antimycotic (all the components of the CSK medium was purchased from ThermoFisher Scientific, USA). The initial differentiation to CSK phenotype was carried out in the presence of fetal bovine serum (FBS) which was replaced subsequently by enhancing the percentages of ITS (3%), NEAA (3%) bFGF (150 ng/ml) and 1% chemically defined lipid concentrate (Thermo Fisher Scientific, USA) as a defined CSK maturation medium post 15 days in vitro. Final differentiation to CSK phenotype under serum-free defined conditions was carried out for 7 days. Cells were split in to 1:3 using Accutase (StemCell Technologies, Canada) intermittently during the NCC induction and CSK differentiation.
Trehalose (TRE) and chloroquine treatment of iCSKs
To assess cytotoxicity of trehalose, the iCSKs were cultured in 12 well plate format with a confluency of 0.5 × 10⁵ cells/well or in 8 well chamber slide (SPL life Sciences, Korea) having a confluency of 0.5 × 10⁴ cells/ chamber and treated with different concentration of trehalose (50–500 mM) for 24 h. The cells were observed under microscope for morphological changes and the viability was assessed using trypan blue (0.4%) (Sigma Aldrich, MO, USA). Propidium iodide (PI) uptake assay was carried out by incubating the iCSKs (untreated and treated with different concentrations of TRE) with 10 µM PI (Sigma Aldrich, MO, USA) for 15 min at 37 °C in 5% CO2 incubator. For positive control, the iCSKs were fixed with 4% paraformaldehyde (PFA) for 20 min at room temperature (RT) prior to the addition of PI and then processed for staining followed by washing 2 × 5 min with 1 × PBS. The Cells were then stained with fluoroshield DAPI 4’,6-diamidino-2-phenylindole (DAPI) (Sigma, USA) data shown in supplementary Fig. 5 (Fig. s5). The iCSKs (both Ctrl and MCD) were treated with trehalose (MP Biomedicals, France) at 100 mM for 24 h. Chloroquine (CQ) (Sigma, USA) treatment was performed in iCSKs at a concentration of 300 nM for 4 h.
Fluorescence staining and microscopy
The iPSC lines, respective EBs and the iCSKs generated from the MCD patients and healthy control (Ctrl) were processed for immunocytochemistry as previously described [20]. iCSKs were cultured on coverslips or 8-chamber cell culture slide coated with gelatin (0.1%) until ~ 80% confluent. iCSKs were treated with 100 mM of trehalose for 24 h and subsequently processed for respective assays. Proteostat staining performed as per the manufacturer instructions. Briefly, iCSKs were fixed in 4% paraformaldehyde for 20 min at 4 °C, washed twice in PBS and incubated with PBS containing 0.1% Triton X-100 (PBST) for 30 min at RT. Cells were then placed in a block solution containing 3% BSA (MP biomedicals, France), and 5% goat serum (Sigma, USA), in PBS for 1 h at room temperatute (rt) followed by primary antibodies (supplementary Table 1) and the samples were incubated overnight in a humidified chamber at 4 °C. The cells were washed and incubated with secondary antibodies conjugated to Alexa Fluor dyes 488, Cy3 (abcam, USA) for 1 h at rt. Coverslips were washed and counter stained with DAPI (Sigma, USA). Fluorescence staining of mitochondria and to probe its membrane potential, 100 nM Mitotracker Green FM (ThermoFisher Scientific, USA) and JC1 dye (Elabscience, USA) were prepared as per manufacturer’s instruction. Mitochondria were evaluated by live imaging of mitochondria using Nanolive microscopy (Nanolive, Switzerland). The mean fluorescence intensity (MFI) of the mitotracker-green stained live iCSKs was quantified from approximately 40 images (1 image per 5 min) for analysis for each independent experiment. Mean of three independent experiments were considered from t test statistical analysis. The number of immunopositive cells and the total number of cell nuclei stained with DAPI were determined by counting the number of cells in three randomly chosen microscopic fields per coverslips or five randomly chosen microscopic fields per chamber in chambered slide. Staining of lysosomes and protein aggregates was carried out using 100 nM Lysotracker Red DND-99 (ThermoFisher Scientific, USA) and proteostat (Enzo lifescience, USA) dye (prepared according to kit instructions) was added 30 min prior fixation with dark incubated at 37 °C. iCSKs incubated with 5 µM MG-132 for 16 h at 37 °C prior to incubation with proteostat dye which served as positive control. Fluorescence stained iCKSs were examined with an Olympus CKX53 inverted fluorescence microscope (Olympus, Japan). Images from < 6 randomly selected areas were obtained using the cellSens imaging software (Olympus, Japan). The threshold was set to exclude background staining for both channels and remained constant for all samples analysed. Fluorescence intensity measurements mean fluorescence was analysed in randomly selected areas using the ImageJ. The mean fluorescence intensities (MFI) of the JC-1 dye were taken under the red and green channel and the ratio of red/ green fluorescence intensity was measured reflecting the change of MMP.
Gene expression analysis
Real-time PCR was performed to assess the pluripotency, NCCs fate and the differentiation to CSK phenotype. Total RNA was isolated from the respective cell types using QIAamp RNA isolation Mini Kit (Qiagen, Hilden, Germany). RNA was reverse transcribed using iScript™ cDNA Synthesis Kit (Bio-Rad, Germany). The cDNA was amplified for the pluripotency genes Rex1, Oct 4, Nanog and 18S rRNA, as a internal Ctrl using qPCR master mix (KAPA SYBR FAST, Sigma, USA) to evaluate the pluripotency of the iPSCs. mRNA transcripts of Nestin, β-tubulin, Pax6, Sox17, Alpha-smooth muscle actin (αSMA), Alpha-fetoprotein (AFP), Brachury and Pax3 were evaluated in the differentiated EBs as markers for ectoderm, mesoderm and endoderm respectively. mRNA expression of Slug, Snail, nerve growth factor receptor (NGFR) was analysed to evaluate fate of NCC. CSK phenotype was assessed by quantifying the expressions of Aldh2a1, Collagen VI, Lumican, Thy1, TGFBiP, and Vimentin in the iCSKs. mRNA expression of autophagy markers LAMP1 and LC3 were analysed by the relative quantification (fold change) of target genes calculated by the 2^ − ΔΔCt method using 18S rRNA as the housekeeping gene. Primer sequences are listed in supplementary Table 2.
Western blot analysis
Total Proteins were extracted for western blot analysis from Ctrl-iCSKs and MCD-iCSKs at the density of 0.5 × 10^6 cells/well in CSK medium at 37 °C, 5% CO2 overnight incubation. Further cells were treated with or without Trehalose (100 mM–24 h) and chloroquine (300 nM–4 h). Post-treatment the cells were harvested and whole cell lysates were extracted using RIPA lysis buffer containing protease and phosphatase inhibitors (phosphostop, complete EDTA free protease inhibitor, (Roche life science, USA). Protein was extracted using the freeze–thaw method for three cycles the lysate was centrifuged at 13,000 rpm for 20 min at 4 °C. Protein concentration was measured using Bradford reagent (Biorad, USA). 20 µg of protein was loaded and run on 12% SDS PAGE, blotted onto PVDF membrane and blocked with 5% milk powder in TBST for 1 h RT. All primary antibodies were incubated overnight in the dark at 4 °C: LAMP1 (1:1000), LC3A/B (1:1000), SQSTM1/p62 (1:1000) and GAPDH (1:2000). All antibodies were purchased from Cell Signalling Technologies, USA. The secondary antibodies conjugated with HRP- horse radish peroxidase anti-rabbit, anti-mouse (1: 5000) and a chemiluminescence substrate (Biorad, Philadelphia, USA) to visualize the band (Image Quant LAS 500, GE Healthcare, Life Sciences, USA).
Live-cell imaging
Approximately 1500 iCSKs were cultured on an 8 well chamber slide (SPL life science, Korea) or 20,000 iCSKs on a glass bottom 35 mm cell culture dish (Cellvis, USA). The iCSKs were stained with 100 nM mitotracker Green (MTG) FM (ThermoFisher Scientific, USA) and 100 nM lysotracker red (LTR) DND-99 (ThermoFisher Scientific, USA) for 30 min under dark field and visualised in a 3D Cell Explorer (Nanolive, Switzerland) microscope using 60 X objective. Appropriate culture conditions were maintained using on-stage incubator maintains 37 °C and 5% CO2 (Oko-labs, Italy). Fluorescent imaging was done using green fluorescent proteins (GFP) and cyanine (Cy-3) filters with 500 ms (ms) of exposure with 50 percent light intensity at 5 min/ frame. All the acquisitions were done for a period of 4 h. ImageJ software was used to quantify stained mitochondrial and lysosomal mass in treated and untreated cells. Following were the steps followed for quantification: 1) The FITC & TRITC stained Nanolive videos were exported in ‘2d tiff’ format. Default settings were not disturbed, and fluorescent intensity images were exported. The rest of the steps were carried out in ImageJ. 2) The images were imported as a stack (File > Import > Image Sequence) and the imported stack was converted to 8-bit. (Image > Type > 8-bit). 3) Since the exported images contained only the fluorescence-stained regions (were already well distinguished by Nanolive), no further manual thresholding was done for the images. Batch processing was employed and stained intensity regions were quantified (Process > Batch > Measure). 4) We calculated following metrics: mean, standard deviation, area and area fraction of the stained regions for each image. Area fraction gives the percentage of stained pixels with respect to total number of pixels in the whole image. Area fraction was plotted and compared for treated and untreated cells. Mean of three independent experiments were considered from t test statistical analysis.
Statistical analysis
Data collected from experiments performed at least 4 times or biological replicates unless otherwise stated. Results were analysed as the mean ± the standard error of the mean (SEM), and data represented as bar graphs, and significance tested using Microsoft Excel (Microsoft office, 2010) and GraphPad Prism (v 9.3.1; GraphPad Software, Boston, Massachusetts USA, www.graphpad.com). p < 0.05 was considered statistically significant.


Comments (0)