Cell culture
Human umbilical cord mesenchymal stem cells (MSCs) were purchased from Pricella Biotechnology Co., Ltd. (Wuhan, China) and maintained in a commercially available complete culture medium (Pricella, China). MSCs from passages 3 to 5 were used in subsequent experiments. Rat cardiomyocyte H9c2 cells were purchased from ATCC (Manassas, VA) and cultured in Dulbecco’s modified Eagle’s medium (DMEM, Gibco, USA) supplemented with 10% fetal bovine serum (FBS, Gibco, USA) and 1% penicillin/streptomycin (PS, Gibco, USA). All the cells were cultured at 37 °C and 5% CO2, and the medium was replaced with fresh complete medium every 2–3 days until the cell confluence reached 70–80% for subculture.
Drug treatment
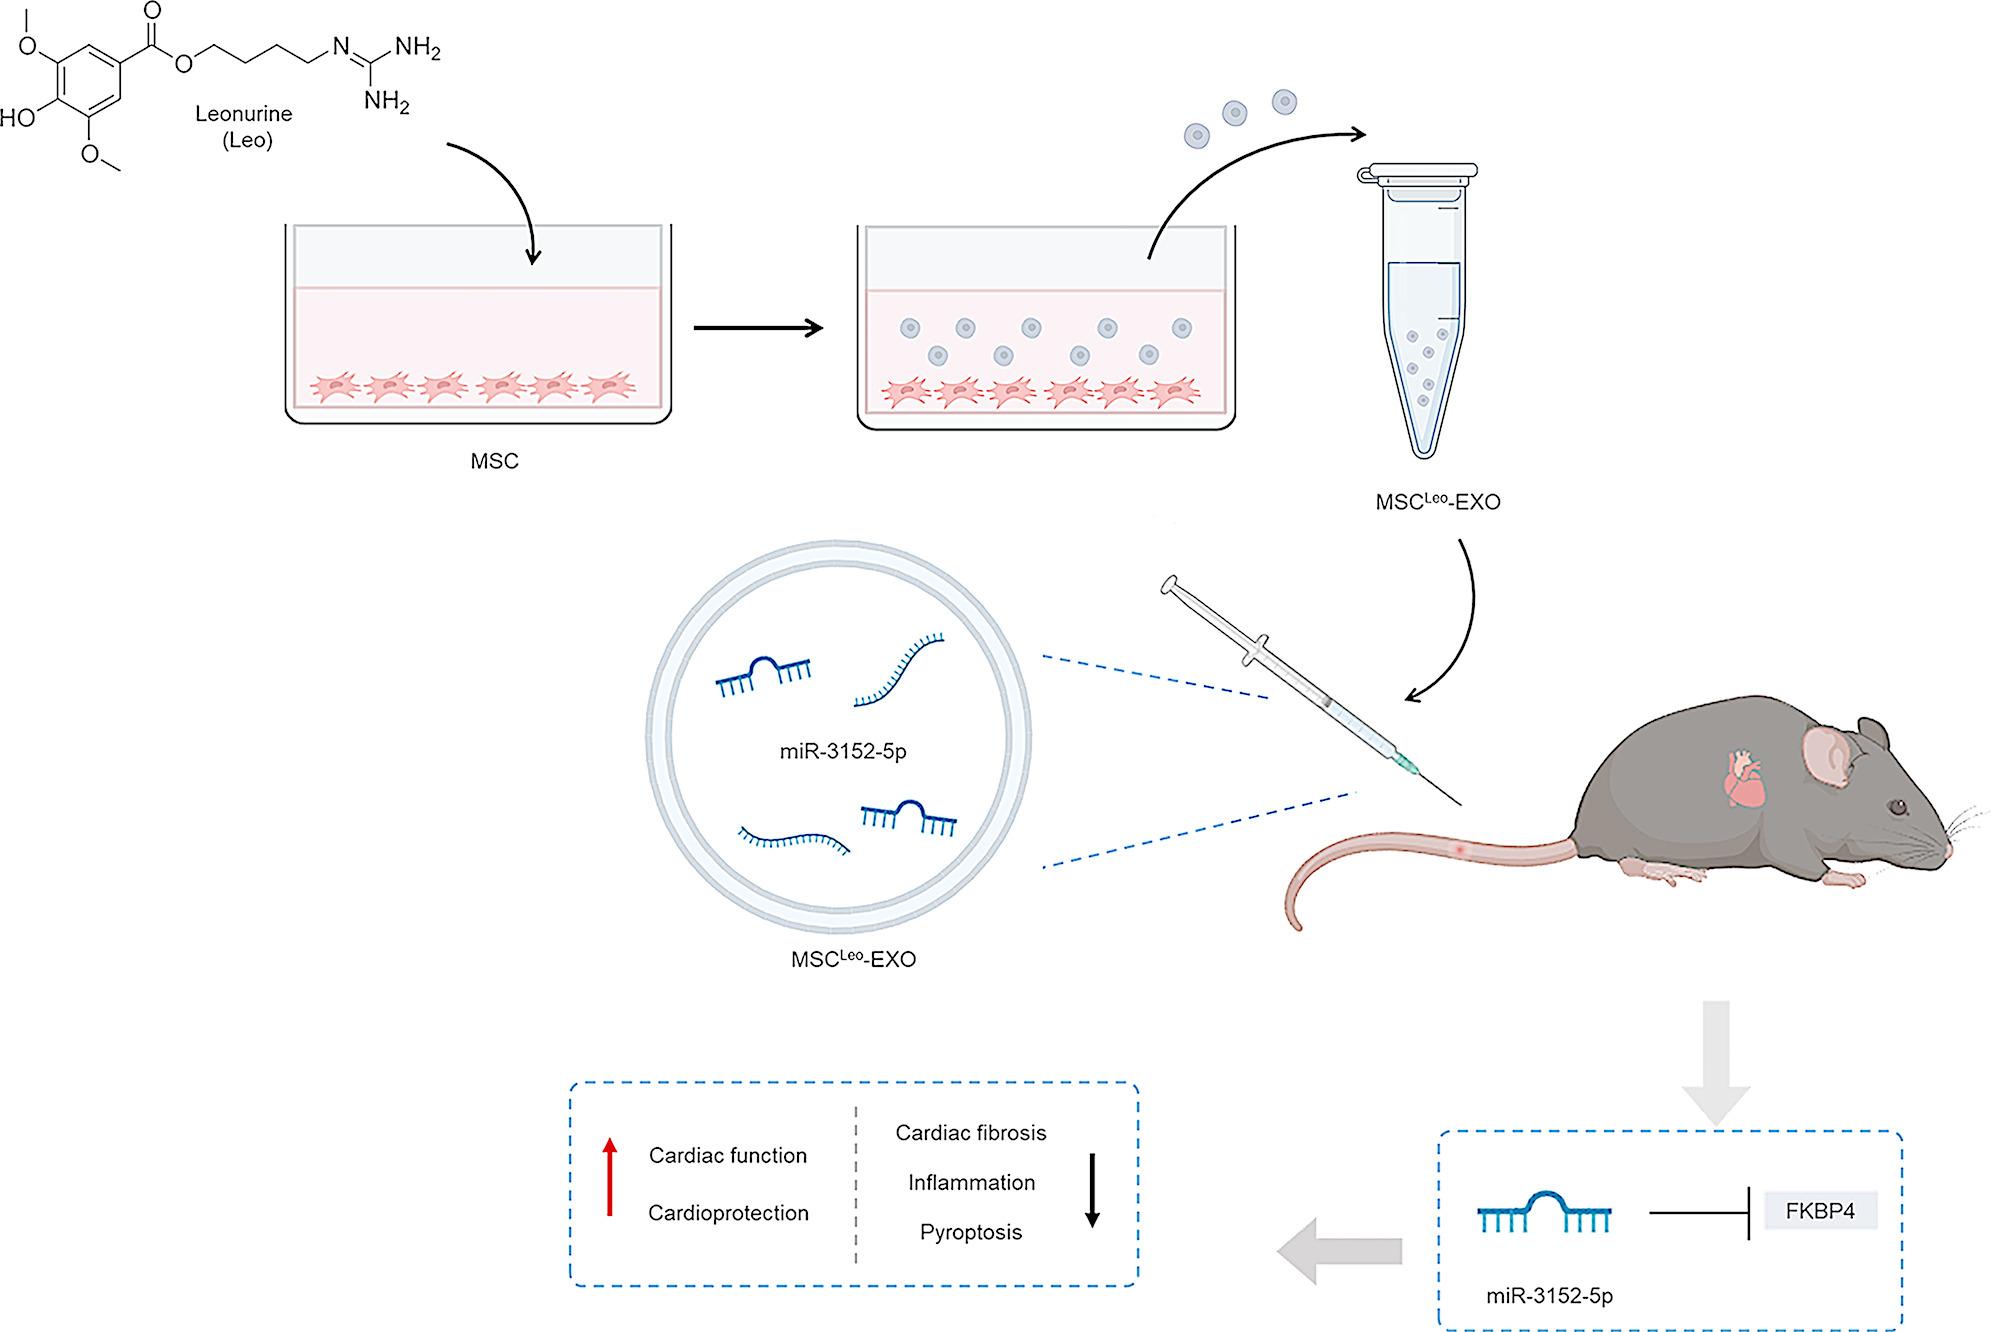
Professor Zhu Yi Zhun’s laboratory at Fudan University produced leonurine via a published method [31], and high-performance liquid chromatography revealed that the purity was greater than 99%. The culture media was changed to complete media supplemented with 20 µM leonurine for 48 h when the MSCs at passages 3–5 reached 50–60% confluence. Under the same conditions, a blank medium was added to the control group.
Preparation of exosomes (EXOs)
The conditioned medium of the above leonurine-pretreated or untreated MSCs was replaced with exosome expression serum-free medium (BasaIMedia, China) and cultured for another 48 h. Complete exosome isolation reagent (Thermo, USA) was used to extract EXOs from the collected conditioned media in accordance with the manufacturer’s instructions. To eliminate cell debris, the supernatant was centrifuged for 30 min at 2000 × g. A 30 kDa ultrafiltration tube (Merck Millipore, USA) was then used to centrifuge the supernatant at 4000 × g for 30 min to concentrate it. After the addition of the exosome isolation mixture at a 1:2 ratio to the concentrated medium, the mixture was vortexed and incubated overnight at 4 °C. After incubation, the exosome particles were precipitated using centrifugation at 10,000 × g for 1 h at 4 °C. Exosome particles (MSC-EXOs or MSCLeo-EXOs) were resuspended in phosphate-buffered saline (PBS) and kept at -80 °C for use in subsequent investigations.
Transmission electron microscopy (TEM) analysis
After being resuspended in TEM fixative (Servicebio, China), the prepared EXOs (1 × 10⁶ particles) or H9c2 cells were fixed at 4 °C for 2 h, dried via an ethanol gradient, and embedded at 37 °C for 2 h. Subsequently, the samples were divided into 60–80 nm pieces and placed on a copper grid with 150 mesh. They were then dyed in the dark with a 2% uranyl acetate saturated alcohol solution and cleaned three times with 70% ethanol. After that, a 2.6% lead citrate solution was used for negative staining, followed by three washes with Milli-Q water and drying overnight at room temperature (RT). Following drying, TEM (HITACHI, Japan) was used to examine the morphology of the EXOs.
Nanoparticle tracking analysis (NTA)
A total of 10 µL of the prepared EXOs was diluted 100 times with PBS and subjected to NTA analysis. Using NanoSight software (NS300, Malvern Instruments, UK), measurements were taken at 5 different locations to examine the size and concentration of the exosome particles.
In vitro labelling of EXOs
Purified EXOs were labelled with the fluorescent dye PHK26 (Solarbio, China) in accordance with the manufacturer’s instructions. In brief, EXOs (1 × 10⁸ particles) were resuspended in diluted PHK26 dye and incubated at RT for 5 min. Following incubation, the cells were quenched with FBS. To precipitate the EXOs, 0.971 M sucrose solution was added, and the cells were centrifuged at 190,000 × g for 2 h at 4 °C. For the following tests, the exosome pellet was reconstituted in PBS. The entire procedure was carried out in the dark.
Internalization of exos
H9c2 cells were plated at a density of 1 × 10⁵ per well in 6-well plates, and labelled EXOs (1 × 10⁶ particles/well) were added to H9c2 cells and incubated for 6 h. The cells were gently rinsed with PBS, fixed for 30 min with 4% paraformaldehyde (PFA), permeabilized for 10 min with PBS containing 0.1% Triton X-100, blocked for 2 h with 5% bovine serum albumin (BSA), and stained with α-SMA-FAM antibody (Thermo, USA), and stained with 2-(4-amidinophenyl)-6-indolecarbamidine dihydrochloride (DAPI) (Beyotime, China). The internalization of labelled EXOs by cells was observed and photographed via a fluorescence microscope (Leica Olympus ix73, Germany).
Hypoxia/reoxygenation (H/R) model and EXO treatment
An H/R model was constructed to simulate myocardial injury in vitro [32]. A tri-gas chamber (Don Whitley Scientific, UK) was used to cultivate H9c2 cells (2 × 10⁵ cells/well) in glucose-free and serum-free DMEM (Gibco, USA) supplemented with 0.1% O2, 5% CO2, and 94.9% N2 for 12 h at 37 °C in order to generate H/R, whereas the H9c2 cells in the control group were cultured under normal conditions (20% O2, 5% CO2, and 37 °C). The medium was subsequently exchanged for high-glucose DMEM containing complete supplements, and the cells were subsequently transferred to normal conditions for 2 h for reoxygenation. H9c2 cells in the MSC-EXO group or the MSCLeo-EXO group were pretreated with MSC-EXOs or MSCLeo-EXOs (1 × 10⁶ particles/well), respectively, for 12 h before hypoxia.
Apoptosis analysis
According to the manufacturer’s instructions, cell apoptosis was detected via an Annexin V-FITC apoptosis detection kit (Beyotime, China). In brief, the cells treated with EXOs or H/R were collected and centrifuged at 1000 rpm for 5 min. The supernatant was discarded, and 195 µL of binding buffer was added to the cell pellet. A total of 1 × 10⁵ cells were mixed with 5 µL of Annexin V-FITC and 10 µL of propidium iodide staining solution, incubated at RT for 20 min in the dark, centrifuged at 1000 rpm for 5 min, and washed twice with PBS. A flow cytometer (Beckman CytoFLEX, USA) was then used to detect apoptotic cells after the pellet had been reconstituted in PBS. FlowJo software was used to examine the proportion of apoptotic cells.
Mitochondrial staining
Prior to being subjected to EXO treatment and H/R, H9c2 cells were cultivated for 24 h after being seeded at a density of 1 × 10⁵ cells per well in 6-well plates. The cells were covered with MitoTracker Red (50 nM, Thermo, USA) and then incubated for 30 min at 37 °C in the dark. After incubation, the cells were stained with DAPI (Beyotime, China) after being fixed with 4% PFA for 30 min, and then rinsed three times with PBS. A fluorescence microscope (Leica Olympus ix73, Germany) was used to observe the intensity of mitochondrial fluorescence, and ImageJ software was used for analysis.
Hoechst 33342 staining
Prior to being treated with EXOs and H/R, H9c2 cells were cultivated for 24 h after being seeded in 6-well plates at a density of 1 × 10⁵ cells/well. In accordance with the reagent protocol, the cells were fixed with 4% PFA for 30 min, covered with Hoechst 33342 dye (Beyotime, China), and incubated at RT for 5 min in the dark. The shape of the cell nucleus was examined using a fluorescence microscope (Leica Olympus ix73, Germany) following three PBS washes, and the number of apoptotic cells was subsequently quantified.
Cardiac fibrosis model and EXO treatment
A transforming growth factor-β (TGF-β) model was constructed to simulate cardiac fibrosis in vitro [33]. After being seeded at a density of 1 × 10⁵ per well on 6-well plates, H9c2 cells were grown for 24 h. Then, the culture medium was replaced with DMEM containing TGF-β (10 ng/ml, Pepro Tech, USA) for another 48 h, while the normal group did not receive any treatment. H9c2 cells in the MSC-EXO group and the MSCLeo-EXO group were pretreated with MSC-EXOs or MSCLeo-EXOs (1 × 10⁶ particles/well) before TGF-β treatment for 12 h.
Immunofluorescence analysis
H9c2 cells treated with EXOs or TGF-β were fixed with 4% PFA for 30 min, permeabilized with 0.1% Triton X-100 in PBS for 10 min and subsequently blocked with 5% BSA for 2 h. Then, the cells were covered with primary antibodies and incubated overnight at 4 °C. Primary antibodies against α-SMA (1:200, Santa, USA), SMAD2 (1:200, Cell Signaling Technology, USA), GasD (1:200, Cell Signaling Technology, USA), NLRP3 (1:100, Sabbiotech, USA), Cas1 (1:200, Cell Signaling Technology, USA), and ASC (1:50, Santa, USA) were used. After being washed with PBS, the cells were covered with Alexa Fluor® 488- or 647-conjugated secondary antibodies (1:200, Jackson ImmunoResearch, USA) and incubated at RT for 2 h in the dark. Then, the cell nuclei were stained with DAPI (Beyotime, China). Images were observed and analysed via a fluorescence microscope (Leica Olympus ix73, Germany), and at least 3 photos were taken for each field of view. The fluorescence intensity was statistically analysed via ImageJ software. The entire process was carried out in the dark.
Animal study
The experimental protocol was approved by the Animal Ethics Committee of the Animal Center of the State Key Laboratory of Quality Research in Chinese Medicines, Macau University of Science and Technology. This work has been reported in line with the ARRIVE guidelines 2.0. All animals were purchased from SPF Zhuhai Bestone Biotechnology Co., Ltd. (Licence No. SYXK (Yue) 2020–0229) and received humane care.
A total of 40 male C57BL/6 mice (6–8 weeks, 18–22 g) were included in the experiment and were randomly divided into a control group (CON), an isoproterenol group (ISO), an MSC-EXO group, an MSCLeo-EXO group, and an MSCLeo(Si-3152)-EXO group. For 28 days in a row, the mice in the ISO group received subcutaneously of 30 mg/kg/day ISO. The mice in the MSC-EXO, MSCLeo-EXO, and MSCLeo(Si-3152)-EXO groups were injected with 1 × 10¹⁰ particles/0.1 mL of PBS containing MSC-EXO, MSCLeo-EXO, or MSCLeo(Si-3152)-EXO via the tail vein for 28 consecutive days after ISO injection. A daily dosage of sterile PBS was administered to the mice in the control group. After the study was completed, cardiac function was evaluated in all the animals. All the animals were subsequently euthanized by 100% CO2 asphyxiation followed by cervical dislocation, and heart tissues were collected for histological analysis.
In vivo imaging
For in vivo exosome tracking, 1,1-dioctadecyl-3,3,3,3-tetramethylindotricarbocyanine iodide (DiR) was incubated with the exosomes at 37 °C for 30 min, followed by centrifugation to discard the dye and resuspension in sterile PBS. On day 29 after EXO labelling, all the animals were anaesthetized with 2% isoflurane and imaged for 1–5 min via a small animal in vivo imaging system (BLT-IMAGING, China), and further fluorescence imaging of the heart was performed at 750–800 nm excitation/emission wavelengths.
Echocardiography
On day 29 after EXO intervention, all the animals were anaesthetized with 2% isoflurane and placed on a heating pad to maintain body temperature at 37 °C. The chests of the animals were shaved and coated with ultrasound gel (Aquasonic CLEAR, USA). Echocardiographic images were acquired via a Vevo F2 thoracic echocardiography system (Fujifilm VisualSonics, Canada), and the following measurements were recorded: ejection friction (EF), fractional shortening (FS), stroke volume (SV), left ventricular mass (LV mass), left ventricular end-diastolic diameter (LVEDd), left ventricular end-systolic diameter (LVEDs), left ventricular end-systolic volume (LVEVs), left ventricular end-diastolic volume (LVEVd), left ventricular end-systolic anterior wall thickness (LVAWs), left ventricular end-diastolic anterior wall thickness (LVAWd), left ventricular end-diastolic posterior wall thickness (LVPWs), left ventricular end-diastolic posterior wall thickness (LVPWd), and heart rate. To eliminate bias, the technicians performed the echocardiographic examinations in a blinded manner.
Histological analysis
After the echocardiographic results were recorded, all the mice were euthanized, the hearts were perfused with saline, and the hearts were quickly removed and preserved in 4% paraffin for 24 h. A paraffin tissue slicer was then used to cut the heart tissues transversely into 5 μm pieces after they had been dried in ethanol gradients and embedded in paraffin. Subsequently, dewaxing was performed using xylene. As directed by the manufacturer, heart tissue sections were stained with hematoxylin and eosin (H&E, Solebao, China), Masson staining (Masson, Solebao, China), and Sirius red staining (PSR, Solebao, China).
For immunohistochemical analysis, rehydration and microwave antigen retrieval were performed after dewaxing. Then, the sections were blocked with goat serum (BOSTER, China) for 1 h, covered with primary antibodies and incubated overnight at 4 °C. The primary antibodies used included CD31 (1:100, Abcam, UK) and NLRP3 (1:100, Sabbiotech, USA). The sections were washed with PBS containing 0.1% Tween-20 and incubated with the corresponding horseradish peroxidase (HRP) secondary antibody (1:200, Abcam, UK) for 1 h at RT before nuclear staining. All the tissue sections were photographed via a Leica DM2500 microscope (Leica, Germany), and the stained area was determined via ImageJ software.
Reverse transcription polymerase chain reaction (RT‒PCR)
The TRIzol reagent (Thermo, USA) was used to isolate the total RNA of cells or tissues in accordance with the reagent protocol for RT-PCR. Total RNA from the blood samples of the subjects was extracted and purified with the QIAam RNA Blood Mini Kit (Qiagen, Germany). The RNA purity and concentration were determined with a NanoJot (Thermo, USA). The RNA was reverse transcribed into cDNA via TransScript Uni All-in-One First-Strand cDNA Synthesis SuperMix for qPCR (TransGen Biotech, China) according to the provided guidelines. Real-time quantitative PCR was performed via TransStart Top Green qPCR SuperMix (+Dye I/+Dye II) (TransGen Biotech, China) on a CFX Opus Real-Time PCR System (Bio-Rad, USA). The PCR conditions were as follows: hold at 94 °C for 30 s. The cycling stages were performed at 94 °C for 5 s, 55 °C for 15 s, and 72 °C for 10 s, for a total of 45 cycles. The data were analysed with GAPDH as the reference gene.
For RT‒PCR of EXOs, the total RNA of EXOs was isolated via the miRNeasy Micro Kit (Qiagen, Germany). Whole RNA was reverse-transcribed into complementary DNA using the miRcute Plus miRNA First-Strand cDNA Kit (Tiangen, China). Using a CFX Opus Real-Time PCR System (Bio-Rad, USA) and the miRcute Plus miRNA qPCR Kit (SYBR Green) (Tiangen, China), quantitative real-time PCR was carried out to measure the expression of miR-3152-5p. The PCR conditions were as follows: holding at 95 °C for 15 min; 5 cycles of 94 °C for 20 s, 64 °C for 30 s, and 72 °C for 34 s; and cycling at 94 °C for 20 s and 60 °C for 34 s for 45 cycles. The data were based on U6 as the reference gene.
The PCR primers used for each gene were synthesized by Invitrogen and are listed in additional file 3. The data were analysed via the 2−ΔΔCt method to calculate relative RNA levels.
Western blot
Total protein was extracted from EXOs, cells, and tissues using protease/phosphatase inhibitors (Solarbio, China) and radioimmunoprecipitation analysis (RIPA) lysis buffer (Abcam, UK). A BCA protein quantification kit (Thermo, USA) was used to measure the amount of protein present. Protein samples were mixed with 4x LDS loading buffer (Thermo, USA) and heated at 100 °C for 10 min. Total proteins were separated via 7.5-15% gel (Epizyme, China) electrophoresis (stacking gel, 80 V; separation gel, 120 V) and transferred to a nitrocellulose membrane (300 mA, 120 min). The membrane was blocked with 5% BSA in TBST (TBS with 0.1% Tween-20) at RT for 1 h and then incubated with primary antibodies overnight on a shaker at 4 °C. The primary antibodies used included Alix, Talin-1, CD81, TSG101 (1:800, Santa, UK), PCNA (1:1000, Santa, UK), Bcl-2, Bax, Nrf2 (1:1000, Cell Signaling Technology, USA), HO-1 (1:1000, Santa, UK), α-SMA (1:800, Abcam, UK), Col1, Col3, FN1 (1:1000, Santa, UK), AKT, p-AKT, IL-1β, c-IL-1β, GasD, c-GasD, and Cas1 (1:1000, Cell Signaling Technology), After 5-min TBST washed, the membrane was incubated for 1 h at RT with the matching HRP secondary antibody (1:10000, Abcam, UK). Then, the protein bands were visualized with enhanced chemiluminescent luminescent solution (4 A Biotech, China) on a GE Amersham Imager 600 chemiluminescence imaging system (Cytiva, USA), the gray value was calculated via ImageJ analysis software, and the gray value of the target band was normalized to the gray value of β-actin.
Coimmunoprecipitation (co-IP)
Lysates of treated cells were prepared as described above. In accordance with the manufacturer’s guidelines (Thermo, USA), 10 µL of anti-mouse or anti-rabbit IgG immunoprecipitation beads were added to 200 µg of each sample, and the mixture was rotated in a microcentrifuge tube at 4 °C for 2 h for preclearing. The magnetic beads were washed 3 times with PBS mixed with 1 µg of anti-ASC (Santa Cruz, USA) primary antibody and rotated at RT for 2 h. Subsequently, the treated samples were incubated with magnetic beads containing ASC at 4 °C overnight with rotation. The supernatant was discarded, the precipitated beads were washed 3 times with PBS in lysis buffer (as described above), and the magnetic beads were resuspended in a mixture of elution buffer and 4x LDS (Thermo, USA) and heated at 100 °C for 10 min. The magnetic beads were discarded via a magnetic stand. The remaining immunoprecipitate was analysed by western blotting.
miRNA transfection
The miR-3152-5p inhibitor, mimic, and scrambled control (NC) were purchased from Beijing Qingke Biotechnology Co., Ltd. (Beijing, China). In accordance with the manufacturer’s protocol, MSCs were transfected with the miR-3152-5p inhibitor (50 nM) or NC diluted with Opti-MEM (Gibco, USA) via Lipofectamine RNAiMAX Reagent (Thermo, USA). After 10 h of incubation, the transfection medium was replaced with serum-free exosome expression medium (BasaIMedia, China), and the culture was continued for 48 h. EXOs from these MSCLeo(Si-3152)-Exo cells were isolated following Sect. 2.3 above. Additionally, H9c2 cells were transfected with the miR-3152-5p mimic (50 nM) or NC diluted with Opti-MEM (Gibco, USA) via Lipofectamine RNAiMAX Reagent (Thermo, USA) and incubated for 48 h.
siRNA transfection and overexpression
siRNAs targeting rat FKBP4, scrambled control siRNA, overexpression plasmids, and an empty vector control were purchased from Beijing Qingke Biotechnology Co., Ltd. (Beijing, China). H9c2 cells were transfected with 50 nM siRNA, plasmid, or scrambled control siRNA, and the empty vector was diluted with Opti-MEM (Gibco, USA) in accordance with the manufacturer’s instructions. The above dilutions were mixed via Lipofectamine™ 3000 Transfection Reagent (Thermo, USA) and transfected into H9c2 cells for 48 h.
miRNA sequencing
miRNA sequencing was performed on both MSC-EXOs and MSCLeo-EXOs. Isolation of total RNA from EXOs, construction of miRNA libraries, and EXO miRNA sequencing were performed by Hangzhou Lianchuan Biotechnology Company (Hangzhou, China). In short, the Illumina HiSeq 2000/2500 platform was used to sequence the miRNA sequencing libraries after they were created using the TruSeq Small RNA Sample Prep Kit (Illumina, San Diego, USA). Data analysis was subsequently performed via ACGT101-miR (v4.2). Differentially expressed miRNAs were identified by the criteria of a fold change > 1 and a p value < 0.05.
miRNA target genes prediction
The potential target genes of miR-3152-5p were predicted using the miRanda database (http://www.mirbase.org/), with the screening threshold set to a maximum free energy of less than − 10 kcal/mol. Based on the prediction results, we further integrated evidence from existing literature regarding the biological functions of the candidate target genes in cardiomyocyte physiology and cardiovascular regulation [34,35,36]. Through this comprehensive analysis, FKBP4 was identified as the primary candidate target gene of miR-3152-5p for subsequent experimental validation.
Dual-luciferase reporter assay
To create a luciferase reporter gene vector for the luciferase reporter gene assay, the 3′-UTR sequence of the location where FKBP4 (wild type) may bind to miR-3152-5p and the corresponding mutant 3′-UTR sequence were cloned and inserted into the pmirGLO vector. The wild-type or mutant luciferase vector was cotransfected with miR-3152-5p mimics or the negative control into 293T cells. The activity of luciferase was measured and analysed via a fluorescence detector (GloMax, Promega, USA).
Statistical analysis
The statistical results are presented as the means ± standard deviations (SDs) unless otherwise specified. All the data were processed and analysed via GraphPad Prism 9.1 software (GraphPad Software Inc., San Diego, CA). Unpaired Student′s t tests were used to compare differences between two groups. One-way analysis of variance (ANOVA) was used to compare differences between multiple groups. A p value less than 0.05 indicates a significant difference between groups.


Comments (0)