
Remember me
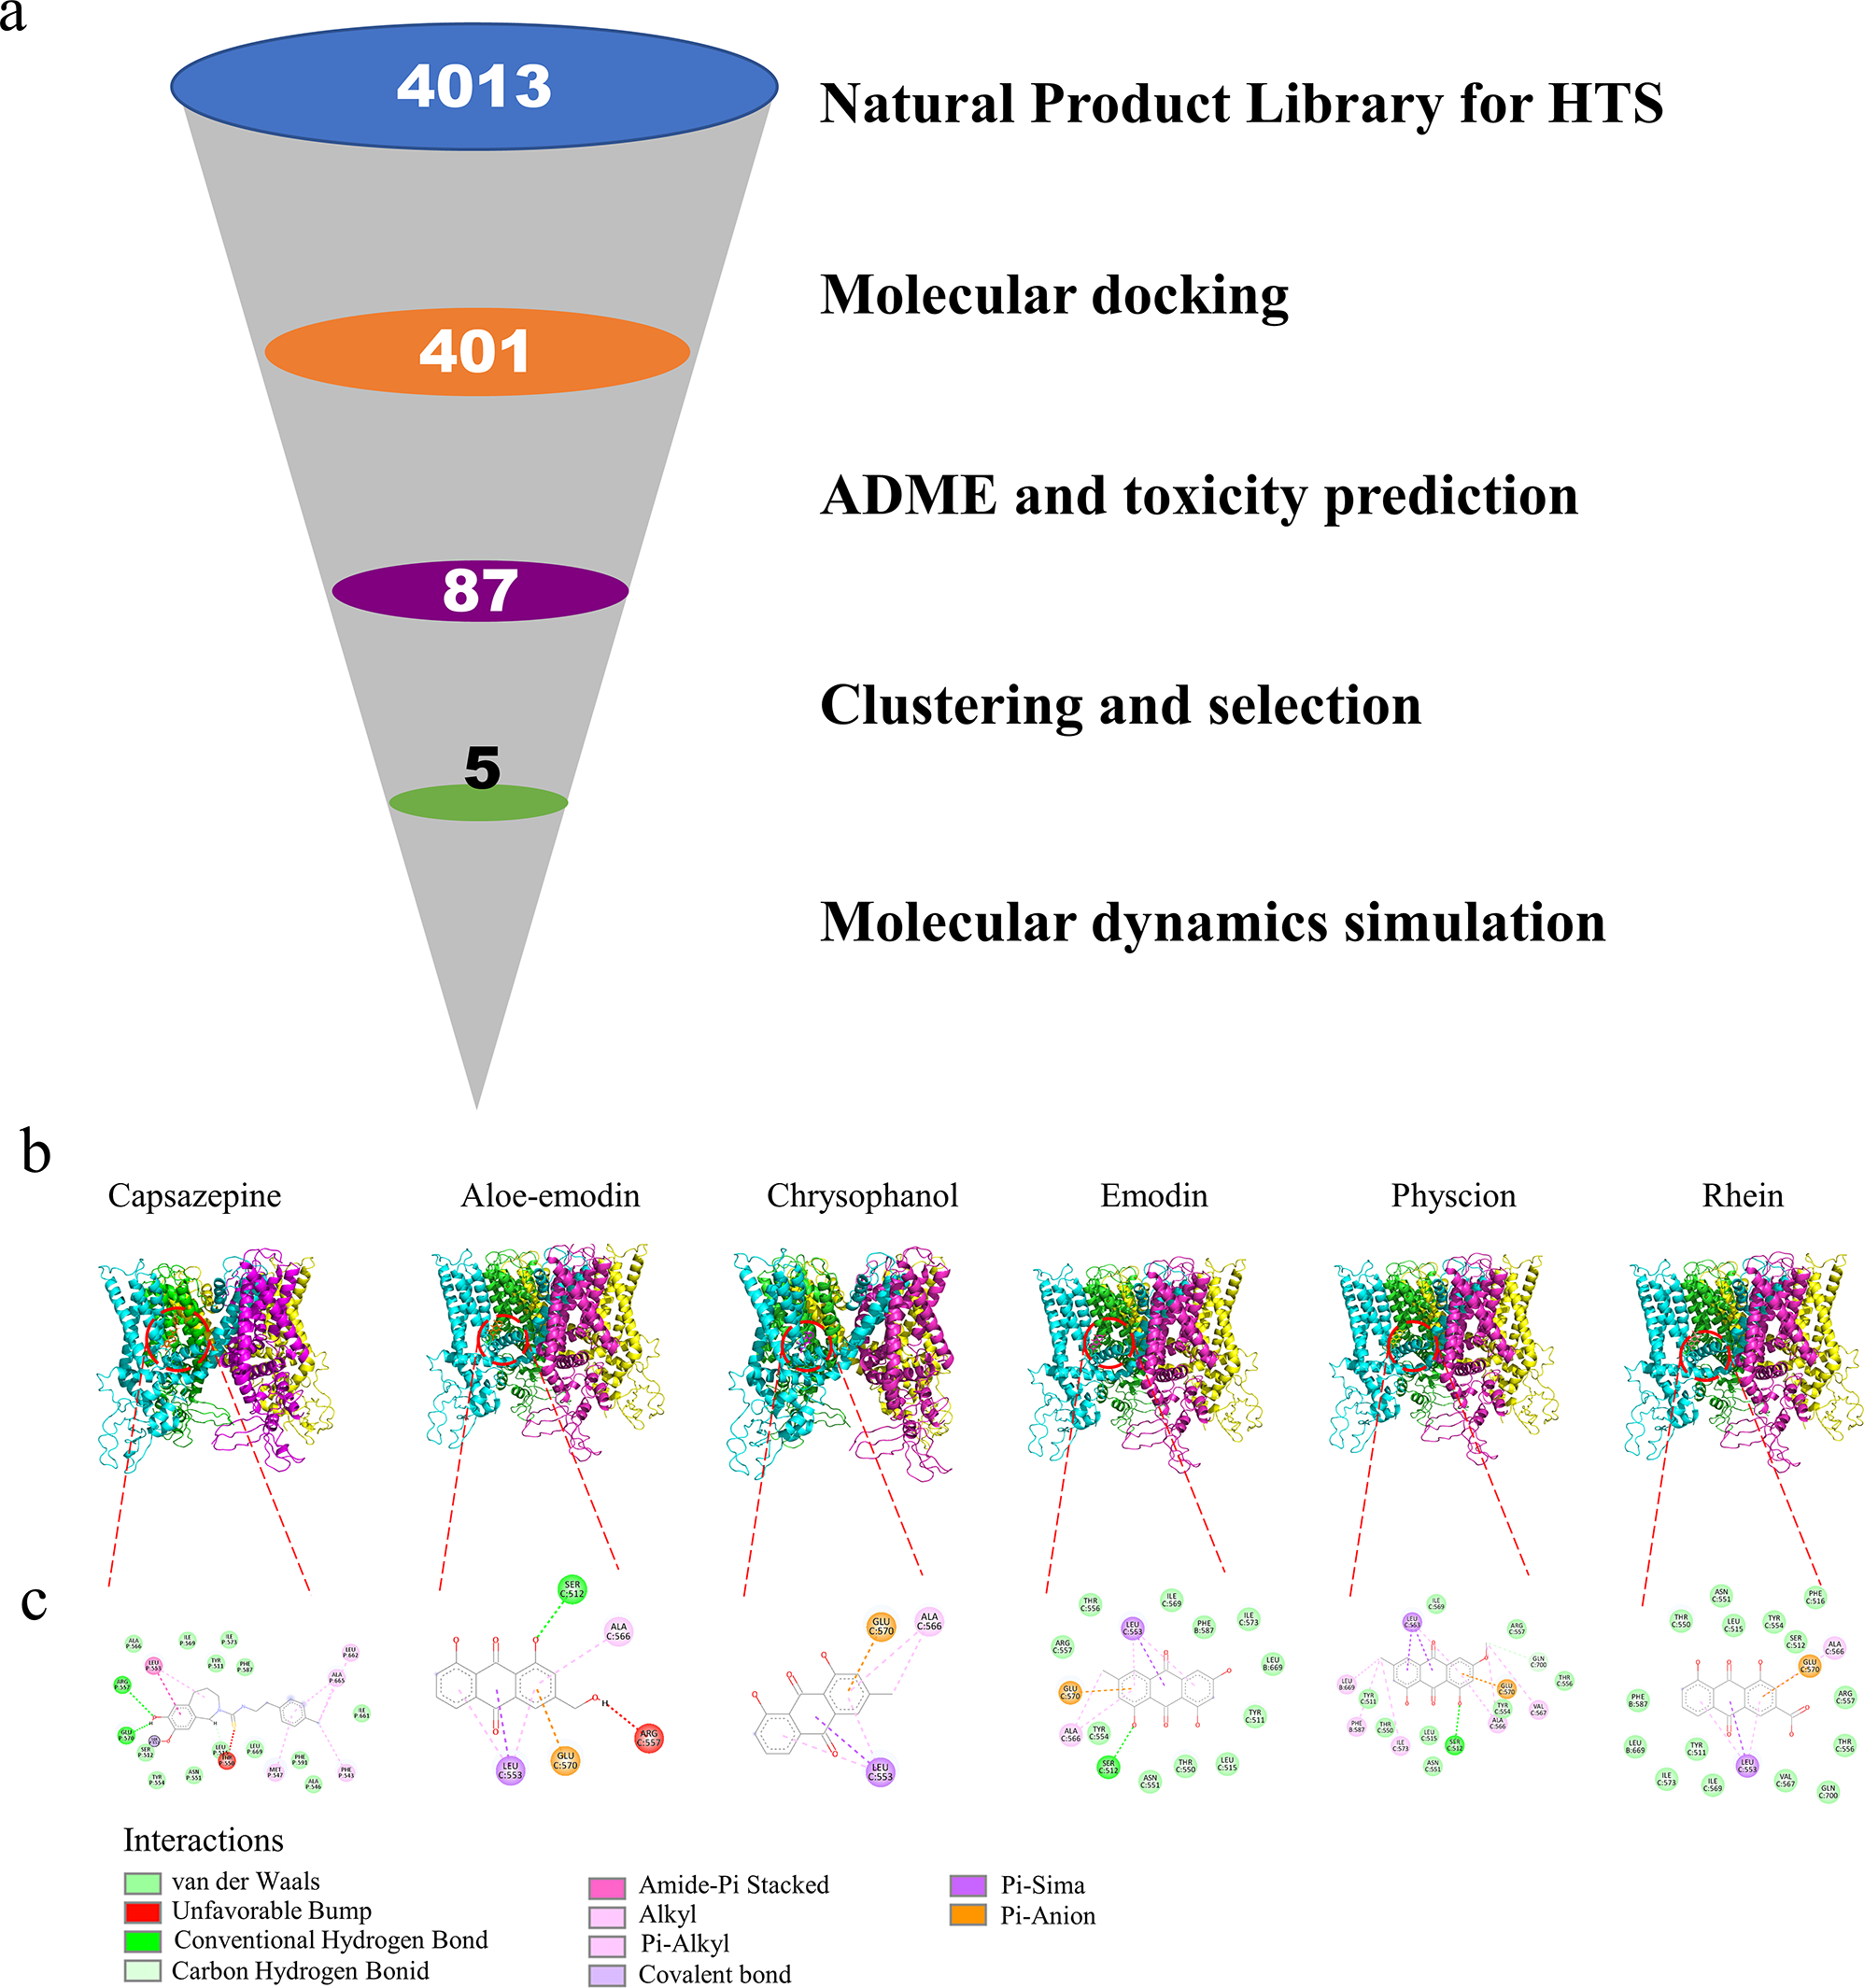


The objective of this study is to identify novel TRPV1 inhibitors and investigate their analgesic effects. The virtual screening workflow is illustrated in Fig. 1a. Natural Product Library for HTS L6000 comprising 4,013 phytochemicals was subjected to Vina-GPU 2.0 for docking against TRPV1. The top 10% of compounds were further evaluated for ADME and toxicity predictions. A total of 87 compounds were obtained and subsequently clustered for visual investigation. Ultimately, five compounds were selected: Aloe-emodin, chrysophanol, emodin, physcion, and rhein.
TYR511, LEU515, LEU547, THR550, ARG557 and GLU570 were the key residue for inhibition of TRPV1 [33, 34]. Aloe-emodin exhibited a pi-anion interaction with GLU570 while demonstrating an unfavorable interaction with ARG557 (Fig. 1b-c). Furthermore, chrysophanol exclusively interacted with GLU570 of TRPV1. Additionally, emodin displayed multiple interactions with TRPV1, involving TYR511, LEU515, THR550, ARG557, and GLU570. The docking analysis demonstrated that capsazepine engaged in multiple interactions with TRPV1, specifically with TYR511, LEU515, ARG557, and GLU570 (Fig. 1b). Similarly, physcion and rhein exhibited identical interactions with TRPV1 as emodin. The results revealed that emodin, physcion, and rhein demonstrated the most significant potency in inhibiting TRPV1. Subsequently, these five compounds underwent molecular dynamics simulation.
We employed AlphaFold3 for full-length TRPV1 modeling and utilized AlphaFold3 for physcion docking with TRPV1 (Figure S1). The results were consistent with those obtained using Vina-GPU. Physcion bound to the vanilloid-binding pocket of TRPV1, interacting with the same amino acids, including TYR511, SER512, LEU515, THR550, ASN551, LEU553, ILE569, GLU570, ILE573, and others. This indicated that the physcion-TRPV1 complex predicted by AlphaFold3 was highly consistent with our original docking pose. The cross-method agreement between these approaches confirmed the reliability of our screening results.
Fig. 1
(a) The virtual screening workflow. (b-c) Visualization of the interactions between TRPV1 and capsazepine, aloe-emodin, chrysophanol, emodin, physcion, and rhein
Molecular dynamics simulation of the five compounds with TRPV1Qualitative overview of MD simulationFigure 2a provided a qualitative overview of the positional sampling of the five ligands within the TRPV1 binding pocket during the 100-ns MD simulations. Visual analysis of the trajectories indicates varied degrees of conformational stability: emodin and rhein displayed higher positional fluctuations, whereas capsazepine and physcion maintained a relatively confined motion within the pocket, with aloe-emodin and chrysophanol exhibiting intermediate behavior.
Root mean square deviation (RMSD) of proteinThe RMSD value can be utilized to indicate the molecular motion dynamics throughout the simulation period. Upon binding with ligands, resulting in the conformational change of TRPV1 (Fig. 2b), the RMSD of TRPV1 continuously increased. Significant fluctuations were observed following the binding of chrysophanol or rhein with TRPV1. Aloe-emodin exhibited lower fluctuations but did not stabilize after 100 ns simulation. The RMSD of TRPV1 remained stable over the entire 100 ns simulation period when TRPV1 interacting with capsazepine. Conversely, after the binding of emodin or physcion with TRPV1, the RMSD of TRPV1 appeared more stable compared to the other small molecules.
RMSD of ligandUpon binding with TRPV1, emodin exhibited significant fluctuations at 50 ns. In contrast, rhein and aloe-emodin showed fluctuations around 20 ns, gradually increasing before stabilizing thereafter (Fig. 2c). Upon binding to TRPV1, capsazepine exhibited fluctuations around 20 ns, gradually increased, and eventually stabilized thereafter. The most stable behaviors were observed in physcion and chrysophanol. In comparison, chrysophanol displayed a minor fluctuation of around 75 ns.
Radius of gyration (Rg)Rg refers to the compactness of proteins, where a lower value of Rg indicates a tighter protein structure. In our results, it is observed that upon binding with chrysophanol or emodin, the Rg values of the protein consistently increased (Fig. 2d). Furthermore, upon the binding of aloe-emodin or rhein with TRPV1, the Rg values exhibited fluctuations over the simulation time. In contrast, the Rg value decreased consistently after physcion bound with TRPV1. The average Rg value for capsazepine was calculated to be 3.96, suggesting that its interaction with TRPV1 resulted in a more compact structure of TRPV1. The mean Rg value for physcion was 3.99, placing it third after aloe-emodin’s 3.98 and capsazepine’s 3.96, smaller than chrysophanol’s 4.00, emodin’s 4.01, and rhein’s 4.00.
Hydrogen bondsThese five compounds exhibited varying numbers of hydrogen bonds upon interaction with TRPV1. The average intermolecular hydrogen bonds formed between aloe-emodin-TRPV1, chrysophanol-TRPV1, emodin-TRPV1, physcion-TRPV1, rhein-TRPV1, and capsazepine-TRPV1 were 1.941, 2.891, 1.116, 2.225, 0.243, and 2.66, respectively (Fig. 2e). Notably, when physcion bound to TRPV1, it formed the third highest number of hydrogen bonds, which was lower than that of chrysophanol and capsazepine. This finding suggested that the binding of chrysophanol or physcion to TRPV1 resulted in a more stable interaction than that of the other compounds.
Solvent accessible surface area (SASA)SASA analysis enables the quantification of the proportion of protein surface accessible to solvent molecules and facilitates the investigation of interactions between complexes and solvents during MD simulations. A decreased SASA value signifies enhanced thermodynamic stability. The average SASA values for aloe-emodin-TRPV1, chrysophanol-TRPV1, emodin-TRPV1, physcion-TRPV1, rhein-TRPV1, and capsazepine-TRPV1 were 814.79 nm2, 818.84 nm2, 821.89 nm2, 809.04 nm2, 820.20 nm2, and 818.34 nm2, respectively (Fig. 2f). These findings suggested that physcion bound to TRPV1, leading to a more compact conformation of the TRPV1 protein.
Fig. 2
The MD simulation parameters of TRPV1 and capsazepine, aloe-emodin, chrysophanol, emodin, physcion, and rhein. (a) The superimposed trajectories of protein-ligand. (b) The RMSD values of TRPV1. (c) The RMSD values of aloe-emodin, chrysophanol, emodin, physcion, and rhein. (d) The Rg values of TRPV1. (e) The hydrogen bonds number formed by TRPV1 and ligands. (f) The SASA values of TRPV1
Principal component analysis (PCA)Principal Component Analysis (PCA) was applied to the displacements of Cα atoms to map the conformational landscapes and identify prominent alterations in collective motions during MD simulations [35]. The projections onto the first two principal components (PCs), specifically PC1 and PC2, represent dominant modes of motion and were used to visualize conformational changes. The results revealed that aloe-emodin, emodin, and physcion clustered in similar regions of the PCA subspace, reflecting comparable conformational dynamics upon TRPV1 binding. Furthermore, principal component analysis (PCA) indicated that capsazepine, chrysophanol, and rhein grouped closely in the PCA subspace and explored a wider conformational space (Fig. 3a), indicating greater conformational flexibility and distinct cluster patterns. Conversely, the TRPV1-physcion complex sampled a narrower region of the PCA subspace, reflecting restricted conformational dynamics and enhanced stability.
Gibbs free energy landscapes (FEL)Applying PCA to analyze the FELs allows for a comprehensive understanding of the conformational dynamics of the system [36]. The analysis revealed that aloe-emodin binding to TRPV1 resulted in a single local minimum, in contrast to chrysophanol and capsazepine which exhibited three local minima, and emodin, which showed two local minima (Fig. 3b). Furthermore, physcion binding to TRPV1 displayed two local minima but occupied a substantial conformational space compared to the other compounds. Rhein binding to TRPV1 produced three local minima. These findings suggest that TRPV1 can readily access local minima when interacting with physcion.
Protein-ligand interactionThe interactions between each residue of TRPV1 and the ligand were calculated during the dynamic simulation. Figure 3c illustrates the temporal interaction profile between each residue of TRPV1 and the ligand. Normalization was conducted throughout the simulation period, as depicted in Fig. 3d, where a probability of 1 signifies that the TRPV1 residue interacted with the ligand over the 100 ns simulation, and a probability of 0.9 indicates that the ligand interacted with the residue for 90 ns during the simulation. The top 5 TRPV1 residues binding with the ligand were selected and displayed in Fig. 3d.
The analysis revealed that capsazepine specifically interacted with residues TYR511, THR550, SER512, LEU557, and ILE570, with probabilities of 0.925, 0.92, 0.83, 0.785, and 0.68. Aloe-emodin interacted with key residues essential for TRPV1 inhibition, namely THR550, ARG557, and GLU570. However, only the probability of THR550 exceeded 0.705, while the probabilities for ARG557 and GLU570 were 0.435 and 0.420, respectively. In contrast, chrysophanol bound to TRPV1 and interacted solely with the key residue GLU570, with a probability of 0.925. Emodin exhibited interactions with key TRPV1 residues, including LEU515, TYR511, and THR550, with probabilities of 0.800, 0.610, and 0.520, respectively. Physcion interacted with crucial residues such as ARG557, THR550, and TYR511, with probabilities of 0.950, 0.645, and 0.580. Moreover, rhein showed interactions with LEU515, THR550, and TYR511, with probabilities of 0.655, 0.650, and 0.650, respectively.
To rigorously validate the accuracy of our interaction detection methodology used in Fig. 3c, we performed the molecular docking and molecular dynamics (MD) simulation between capsaicin and TRPV1 using the same virtual screening pipeline. We then compared the resulting ligand-protein interactions against the well-characterized binding mode of capsaicin documented in the literature. In our study, the molecular docking successfully reproduced the known “tail-up, head-down” conformation of capsaicin within the vanilloid-binding pocket of TRPV1 (Fig. S2a). The top interacting residues identified in our MD simulations (ranked by contact frequency) were: Y513, E572, L517, T552, and Y555 (Fig. S2b). This aligns closely with prior studies reporting Y513, T552, L517, A568, and E572 as dominant residues (based on interaction fraction, defined as the percentage of frames exhibiting specific interactions) [37]. Notably, 4 out of the top 5 residues overlap between our work and published data. Furthermore, numerous additional residues known to interact with capsaicin (e.g., A667, F545, F593, I663, L664, R559, N553) were consistently detected by our method, corroborating the reference data (Fig. S2c-d) [37]. This high degree of correspondence between our MD-derived interaction profile for capsaicin and the established literature data strongly validates the accuracy and reliability of our interaction detection pipeline employed for analyzing ligand binding modes in the study.
Fig. 3
Illustration of the molecular dynamics (MD) simulation profiles involving capsazepine-TRPV1, aloe-emodin-TRPV1, chrysophanol-TRPV1, emodin-TRPV1, physcion-TRPV1, and rhein-TRPV1 complexes. (a) Depiction of the two-dimensional protein conformational alterations throughout the simulation utilizing principal components PC1 and PC2 for the protein-ligand complexes. (b) Visualization of the Gibbs free energy landscapes of the protein-ligand complexes through three-dimensional representations of the protein conformational modifications. (c) Examine the interactions between TRPV1 residues and ligands throughout a 100 ns simulation. The 100 ns trajectory was segmented into 200 frames, each representing the binding status of ligands to TRPV1 residues at every 0.5 ns. Distinct colors denote each 0.5 nanoseconds interval (Panels are arranged in sequential order from left to right and top to bottom). (d) Analysis of the interaction probabilities between the top 5 TRPV1 residues and ligands
Overall, emodin, physcion, and rhein demonstrated interactions with a greater number of key residues involved in TRPV1 inhibition compared to the other compounds, suggesting that these three compounds could establish strong interactions with TRPV1 and possess higher potential for TRPV1 inhibition.
MMPBSA analysisThe MM-PBSA methodology was employed to compute the binding free energy of the five compounds associated with TRPV1. The outcomes revealed that physcion exhibited the lowest binding free energy, with emodin ranking second. Chrysophanol displayed the highest binding free energy, followed by aloe-emodin and rhein. These findings suggested that physcion demonstrated the strongest affinity for TRPV1 compared to the other compounds (Table 1).
Table 1 Energetic components of the binding energy for five compounds in complex with TRPV1 using MM-PBSA (kJ/mol)Calcium imagingCalcium imaging was conducted utilizing HEK293-hTRPV1 cellular models (Fig. 4). The application of capsaicin elicited a notable influx of calcium ions. The fluorescence intensity of HEPES was set as the baseline. Various concentrations of physcion, within the range of 15 to 25 µM, attenuated the calcium fluorescence triggered by capsaicin. These findings suggested that physcion exerted inhibitory effects on the calcium influx mediated by TRPV1.
Fig. 4
Calcium imaging depicting various concentrations (15–25 µM) of physcion on HEK293-hTRPV1 cells. (a) Illustrative images displaying the intracellular calcium fluorescence intensity of HEK293-hTRPV1 cells. (b) Normalized the average of relative calcium fluorescence intensity of physcion in HEK293-hTRPV1 cells. (c) Exemplary time-dependent profile of calcium fluorescence intensity in response to physcion in HEK293-hTRPV1 cells. Data are expressed as mean ± SD, Data were standardized to the HEPES control group. Statistical analysis by one-way ANOVA with Bonferroni’s post hoc test
Pain behavioral testsAcetic acid-induced abdominal stretchingFollowing the administration of 0.6% acetic acid, trunk curling and limb extension were observed in mice, indicative of stretching response (Fig. 5a). Upon administering 20 mg/kg CPZ, the number of stretches significantly decreased compared to the control group. Furthermore, administering 20 mg/kg physcion resulted in a more pronounced reduction in stretch number compared to the CPZ group.
Hot water tail-flick testThe hot-water tail-flick test was performed to assess heat pain sensitivity in mice. Treatment with 20 mg/kg of physcion elevated the thermal threshold in mice compared to the control group (Fig. 5b).
Hot plate testIn the hot plate test, the administration of 20 mg/kg CPZ did not prolong the latency of the hot plate test. Conversely, treatment with 20 mg/kg of physcion significantly elevated the thermal threshold in mice compared to the control group (Fig. 5c).
CFA-induced inflammatory painThe injection of CFA induced mechanical allodynia and thermal hyperalgesia, which were assessed using the von Frey test to measure the paw withdrawal threshold [38]. The findings revealed a significant decrease in the paw withdrawal threshold following CFA injection. Treatment with 20 mg/kg of CPZ did not restore the paw withdrawal threshold (Fig. 5d). However, the administration of 15 or 20 mg/kg of physcion significantly increased the withdrawal threshold. Furthermore, intraperitoneal administration of 20 mg/kg of physcion without CFA treatment did not affect the paw withdrawal threshold.
Bone cancer painThe intra-femoral inoculation of Lewis lung carcinoma (LLC) cells is a well-established model for studying bone cancer pain and evaluating the analgesic properties of pharmaceutical agents [39]. The hot plate and von Frey tests assessed the physcion’s thermal and mechanical analgesic effects (Fig. 5e-f). Results indicated that LLC inoculation significantly reduced the latency in the hot plate test and the paw withdrawal threshold in the von Frey test. However, treatment with 20 mg/kg of physcion notably increased both the latency in the hot plate test and the paw withdrawal threshold in the von Frey test.
Fig. 5
Assessment of the analgesic efficacy of Physcion across a variety of animal models. (a) The quantification of writhing episodes within 20 min following the administration of 0.6% acetic acid (n = 8). Thermal sensitivity was evaluated using the hot water tail-flick test (b) (n = 8) and hot plate assay (c) (n = 8). (d) The mechanical withdrawal threshold was determined through the von Frey test in the CFA-induced inflammatory pain model (n = 12–15). Thermal and mechanical sensitivities in the context of bone cancer pain induced by LLC inoculation were assessed viathe hot plate test (e) (n = 8) and von Frey test (f) (n = 16). The dose of CPZ was 20 mg/kg. The data are presented as mean ± standard deviation. Statistical analyses were performed using unpaired two-tailed Student’s t-test for (b) and one-way ANOVA with Bonferroni’s post hoc test for (a), (c), (d), (e), and (f). Ctrl indicates the control group; Veh indicates the vehicle group; CPZ indicates the capsazepine group; CFA indicates complete Freund’s adjuvant; LLC indicates Lewis lung carcinoma
The effect of physcion on inflammatory mediators in plasma and DRG during CFA-induced inflammatory pain in miceTo explore the underlying mechanism of physcion’s analgesic effect, we examined the inflammatory cytokines provoked by CFA-induced inflammatory pain in mice’s plasma and DRG. Our findings revealed that CFA administration led to an elevation in the secretion of inflammatory cytokines such as NO, IL-1β, IL-6, and TNF-α (Fig. 6a-d). Interestingly, treatment with 20 mg/kg of physcion notably attenuated the levels of these inflammatory cytokines.
Moreover, concerning mRNA expression, the injection of CFA not only impacted the mRNA levels of inflammatory genes like IL-1α, IL-1β, IL-6, IL-11, and CXCL10 but also influenced the expression of calcium-related genes such as PKC, CAMK2A, and CAMK2B (Fig. 6e-l). Conversely, treatment with 20 mg/kg of physcion markedly reduced the mRNA expression of both inflammatory and calcium-related genes.
Fig. 6
Impact of physcion on CFA-induced inflammatory pain in the plasma and the DRG of mice. (a-d) Plasma analysis: Influence of physcion on the secretion levels of NO, IL-1β, IL-6, and TNF-α (n = 7–8); (e-l) mRNA analysis of DRG: Influence of physcion on the mRNA expression levels of IL-1α, IL-1β, IL-6, IL-11, CXCL10, PKC, CAMK2A, and CAMK2B (n = 6). Data are presented as mean ± SD, statistical analysis by one-way ANOVA with Bonferroni’s post hoc test. Ctrl indicates the control group; Veh indicates the vehicle group
The anti-inflammatory effect of physcion on TNF-α-induced RAW264.7 cellsGiven the pivotal involvement of TNF-α in inflammation progression and our prior findings indicating the ability of CFA to induce TNF-α synthesis and subsequently trigger inflammation, our study concentrated on investigating the anti-inflammatory properties of physcion on TNF-α-stimulated RAW264.7 cells. Stimulation with 10 ng/ml of TNF-α resulted in a significant upregulation of mRNA expression of IL-1β, IL-6, IL-18, COX-2, TGF-β, and TNF-α (Fig. 7a-f). Treatment with 40 µM of CPZ decreased the mRNA expression levels, whereas varying concentrations of physcion ranging from 10 to 40 µM markedly attenuated the expression of these inflammatory genes.
Fig. 7
(a-f) The impact of physcion on the mRNA expression of IL-1β, IL-6, IL-18, COX-2, TGF-β, and TNF-α in TNF-α-stimulated RAW264.7 cells (n = 6). The dose of CPZ was 20 µM. Results are expressed as mean ± SD. Statistical evaluation was conducted using one-way ANOVA followed by Bonferroni’s post hoc analysis. In the experimental context, Ctrl denotes the control group, Veh represents the vehicle group, and CPZ signifies the capsazepine group
NF-κB/MAPK signaling pathways mediated the anti-inflammatory effect of physcionThe NF-κB/MAPK signaling cascade is triggered upon exposure to TNF-α [40]. Previous studies have demonstrated that blocking NF-κB can mitigate mechanically and thermally induced pain in rats caused by CFA [41]. This study aimed to investigate the anti-inflammatory properties of physcion on the NF-κB and MAPK signaling pathways. The findings revealed that exposure to 10 ng/ml TNF-α resulted in the increased phosphorylation of p65, IκBα, p38, JNK, and ERK1/2 (Fig. 8). Furthermore, treatment with 40 µM of CPZ attenuated the phosphorylation of p65 and IκBα. At the same time, it did not affect the phosphorylation of p38, JNK, and ERK1/2. Conversely, treatment with 40 µM of physcion exhibited a significant inhibitory impact on the phosphorylation of p65, IκBα, p38, JNK, and ERK1/2. These results suggested that physcion’s anti-inflammatory property was attributed to its ability to suppress the NF-κB/MAPK signaling pathways.
Fig. 8
Physcion’s impact on NF-κB and MAPK signaling pathways. RAW264.7 cells underwent treatment with CPZ (40 µM) or physcion (40 µM) for 1 h. Subsequently, (a) whole-cell lysates were obtained and subjected to immunoblotting using antibodies specific to p-p65, p65, p-IκBα, IκBα, p-p38, p38, p-JNK, JNK, p-ERK1/2, ERK1/2, β-actin, GAPDH, and β-tubulin. The fold change was assessed post-normalization with β-actin, GAPDH, or β-tubulin. The accompanying right panels depict the fold change as compared to the control: p-p65/p65 (b), p-IκBα/IκBα (c), p-p38/p38 (d), p-JNK/JNK (e), p-ERK1/2/ERK1/2 (f) (n = 6). The data is represented as mean ± SD. Statistical analysis was performed using one-way ANOVA with Bonferroni’s post hoc test. In the experimental context, Ctrl denotes the control group; Veh represents the vehicle group; CPZ signifies the capsazepine group; PHY indicates the physcion group
Comments (0)