Sample of polystyrene nanoparticles
The PNPs were purchased from Sigma-Aldrich (cat. no. 43302, St. Louis, MO, USA). An aqueous suspension (10% WT) of the sample with an average diameter of 100 nm and a density of 1.05 g/cm3 was used for the study. The PNPs suspension was stored at 2–8 °C. A standardized sample was used in the survey since the characterization of these particles showed that they were homogeneous and of the same size (100 nm) and consisted of poly[(divinylbenzene)styrene]. The standardized sample of PNPs was previously defined by their spherical shape, uniform surface, and synthetic polymeric composition, as confirmed by Scanning Electron Microscopy (SEM) and Energy Dispersive X-ray Spectroscopy (EDS) [8]. Their chemical identity was further validated by Fourier Transform Infrared Spectroscopy (FTIR), confirming the presence of characteristic polystyrene functional groups that influence their physicochemical properties, hydrophobicity, and potential for biomolecular interactions.
Cell culture and treatments
The colon adenocarcinoma cell line (Caco-2) from Sigma-Aldrich was used in the experiments. In Dulbecco’s minimal essential medium (DMEM) (Sigma-Aldrich, USA), Caco-2 was cultivated using a concentrate of non-essential amino acids (10 mg/mL) (NEAA) (Sigma-Aldrich, USA), 10% fetal bovine serum (Gibco, USA), and penicillin and streptomycin (10 mg/mL) (Sigma-Aldrich, USA). Cells were grown in an environment with 95% humidity, 5% CO2, and 37 °C. Twice a week, cells were passaged at 70–80% confluence and treated with 0.25% trypsin-EDTA solution (Sigma-Aldrich, St. Louis, MO, USA) to sustain cell culture.
The Trypan blue assay
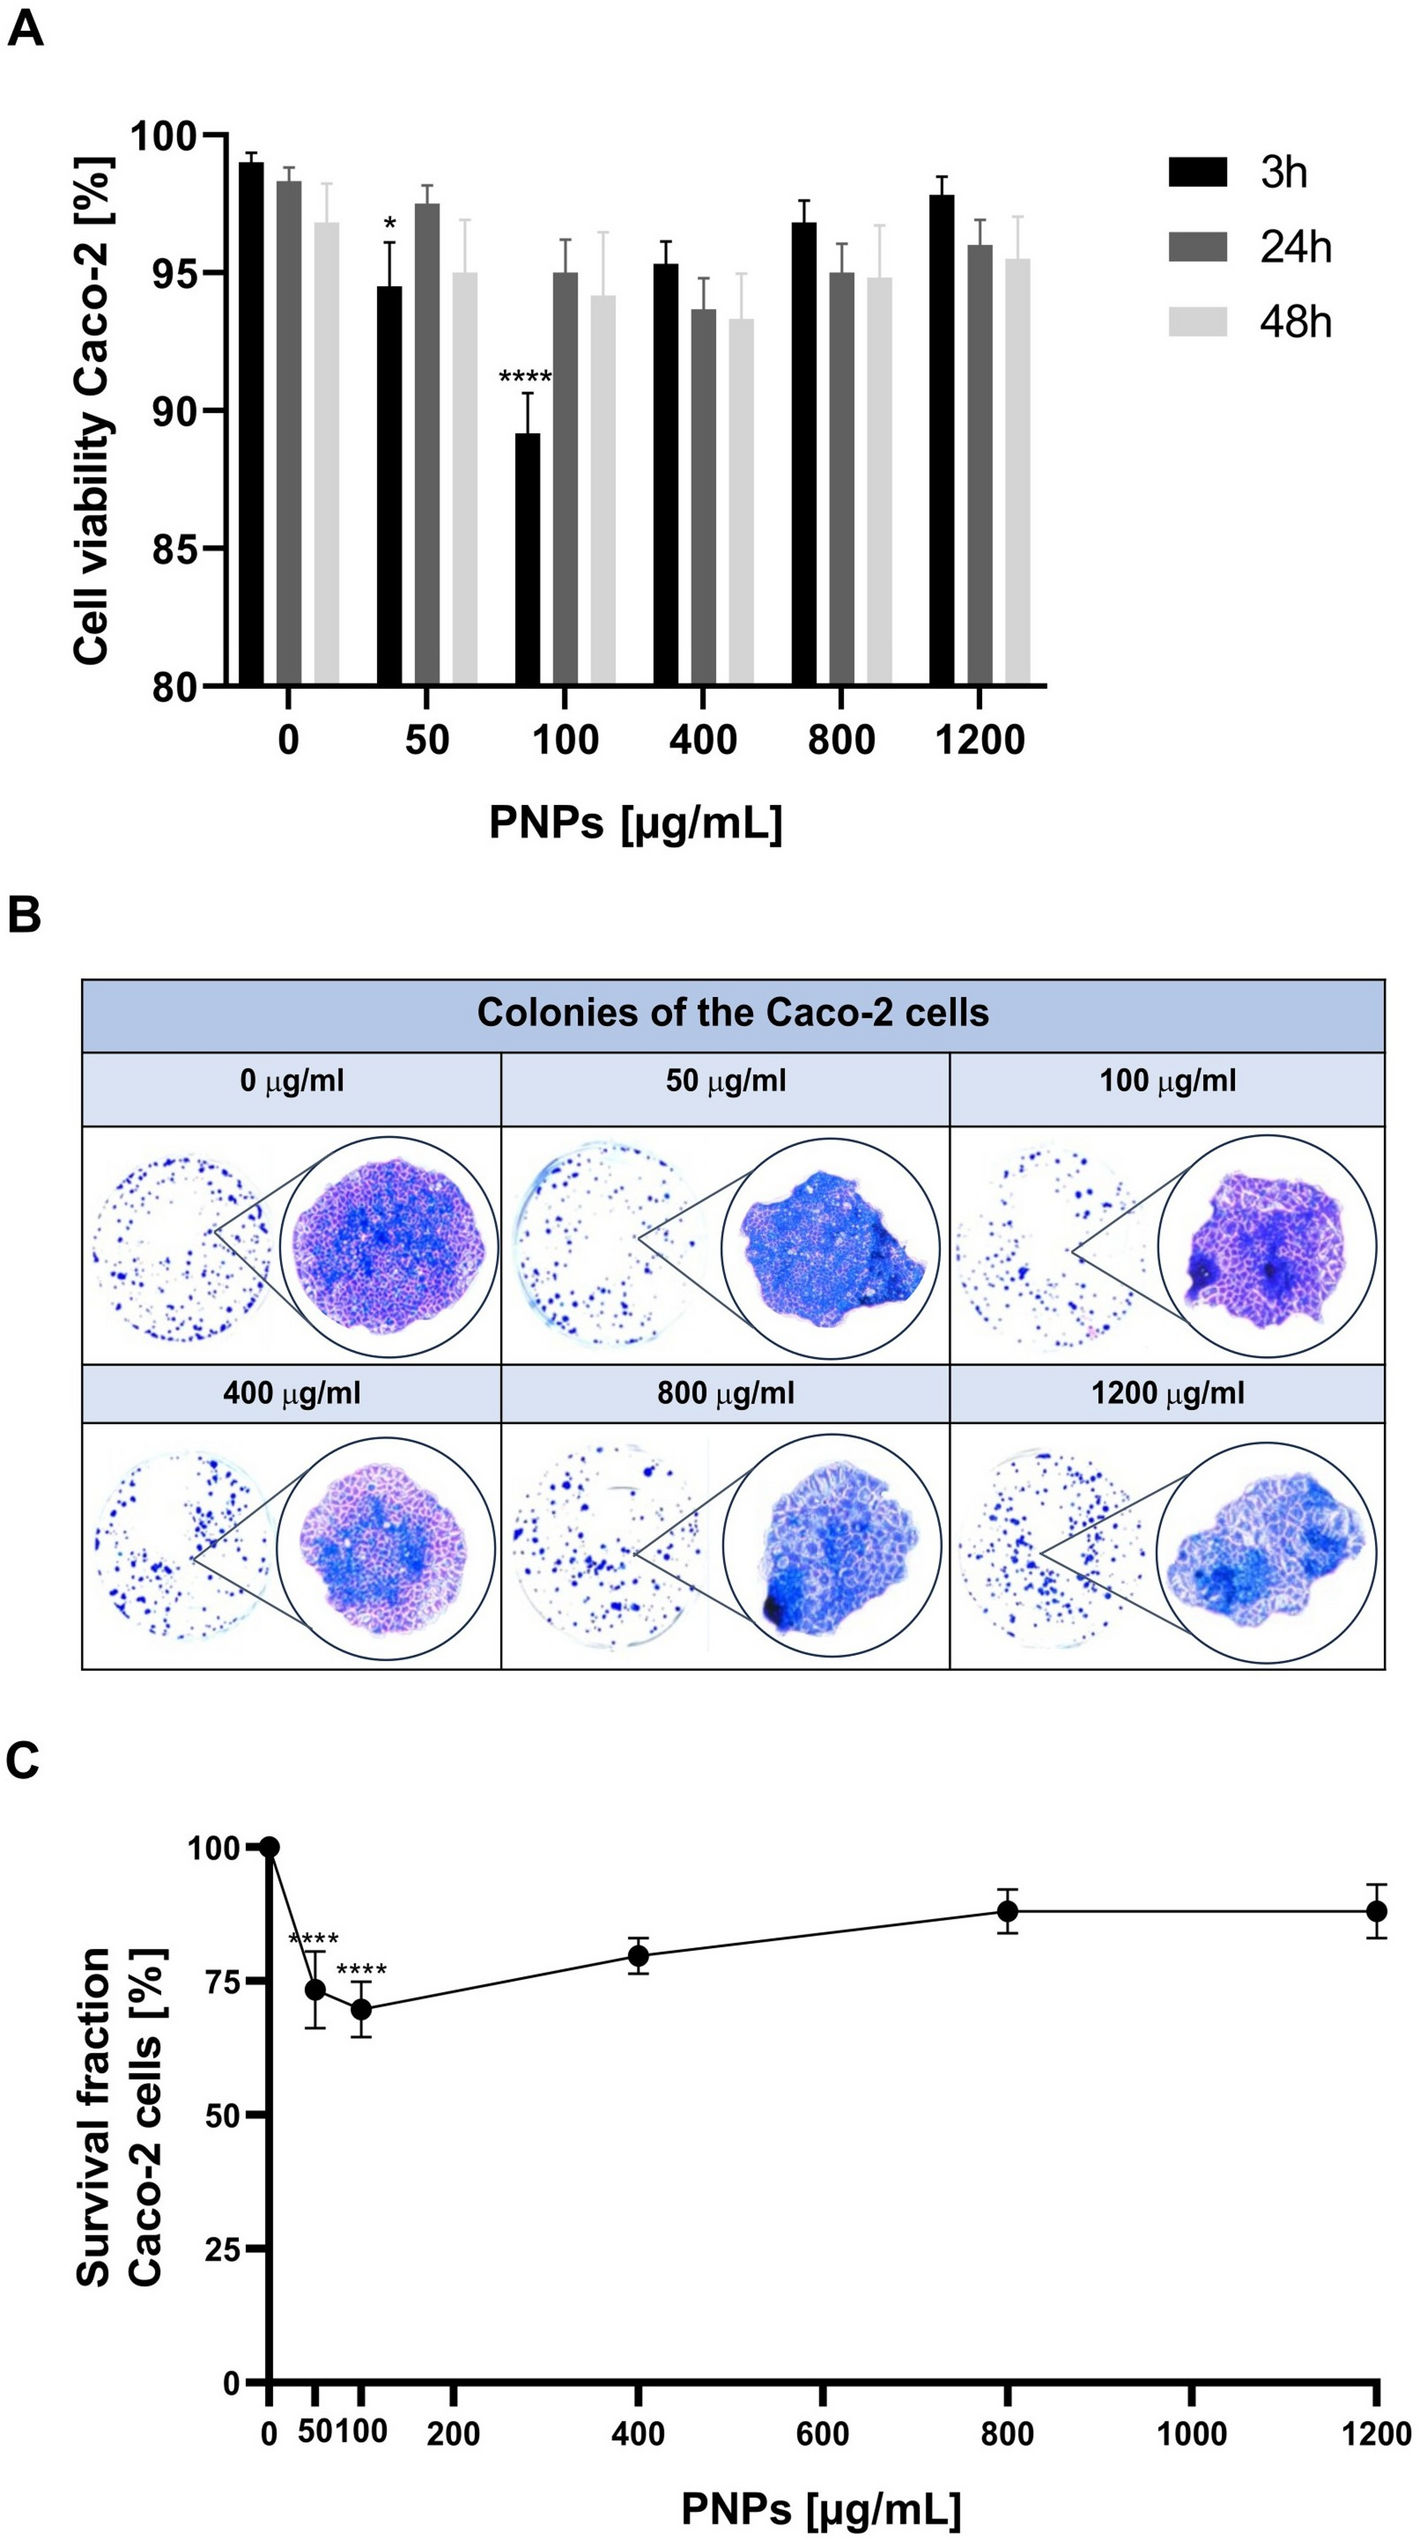
The viability of Caco-2 cells was assessed using 0.4% trypan blue solution (Bio-Rad). The cells were mixed with trypan blue (1:1 ratio– 10 µl of Caco- 2 cells + 10 µl of trypan blue stain). Before treatment, the cells were seeded on T-25 flasks, and were treated with trypan blue before they exceeded 70% confluence. Cell viability was evaluated after the cells were treated with PNPs concentrations of 0, 50, 100, 400, 800, and 1200 µg/mL. Cells were incubated for 3 h, 24 h and 48 h. Three biological replicates were performed for each concentration and incubation time. In two technical replicates, measurements were carried out using a TC20™ Automated Cell Counter (Bio-Rad, USA) on slides dedicated to this device. Cell viability in the test population was expressed as the content of viable cells (%) in the test cell population.
The clonogenic assay
After 24-hour treatment with the PNPs, cells were seeded in sufficient numbers to produce colonies within 1–3 weeks. A minimum of 50 cells was considered a single colony, and an assay was performed as published before [11,12,13]. Caco-2 cells were then seeded at 300,000 cells/well in 6-well plates in 2 mLDMEM, in at least three technical replicates, and after 24 h, the cells were treated with PNPs at concentrations of 0, 50, 100, 400, 800, and 1200 µg/mL. After another 24 h of exposure, 1,000 cells/well were seeded in 2 mL of fresh DMEM medium to form colonies and incubated at 37 °C / 5% CO2. After nine days, the cells were fixed and stained with Coomassie Brilliant Blue R-250 dye (Bio-Rad) (2 mL/well), incubating for 10–15 min at RT. The Coomassie solution was then collected and washed with the Coomassie Brilliant Blue R-250 wash-off solution (Bio-Rad). The residual buffer was removed by immersing the plates in warm tap water. Readings were performed the following day. Stained colonies were counted for individual images (of each well of a 6-well plate) saved in TIFF format. The colonies were counted using the automated countPHICS software [14]. The collected data on the number of colonies formed were then used to plot the survival curve.
Measurement of reactive oxygen species
A fluorescent DCFDA (2’, 7’-dichlorofluorescein acetate) probe was used to measure the level of reactive oxygen species in Caco-2 cells as described previously [15]. On the first day, the 96-well plate was treated with collagen diluted with 1:10 deionized water (Sigma-Aldrich) to prevent Caco-2 colon adenocarcinoma cells from detaching. On the next day, 50,000 cells per well were seeded. On the third day, cells were treated with PNPs at 0, 50, 100, 400, 800, and 1200 µg/mL concentrations in at least three technical replicates and 1.5 mM of H2O2 (Sigma-Aldrich) as a positive control. After 24 h, the cells were washed with PBS (VWR), followed by incubation with 10 µM DCFDA (Sigma-Aldrich, USA) in HBSS (Sigma-Aldrich) (100 µl per well) for 3 h at 37 °C, 5% CO2. Fluorescence intensity was measured using a Fluoroskan ASCENT microplate reader (Thermo Fisher Scientific, USA) at 485 nm/520 nm wavelengths.
Flow cytometric analysis of cycling cell populations
Analysis of cell cycle phases in the Caco-2 line after exposure to PNPs was performed by flow cytometry technique using immunofluorescence staining of cells that had incorporated bromodeoxyuridine (BrdU) using an Apoptosis, DNA Damage and Cell Proliferation Kit (BD Pharmingen™), as published before [13]. For the experiment, 1 × 10⁶ Caco-2 cells were prepared after 24-hour incubation with 100 µg/mL PNPs and 2-hour incubation with etoposide (Sigma-Aldrich), as a positive control with a final concentration of 50 µM. Cells were washed with PBS solution (VWR) and then treated with 1 mM BrdU from BD Pharmingen™ kit. Incubation was carried out for 60 min. at 37 °C, 5% CO2. were collected by trypsinization, washed with 1% BSA/PBS (Sigma-Aldrich), fixed and permeabilized with BD Cytofix/Cytoperm™ Fixation/Permeabilization Solution, BD Cytofix/Cytoperm™ Plus Permeabilization Buffer (BD Pharmingen™) and stained with PerCP-Cy5.5 Mouse Anti-BrdU Antibody (BD Pharmingen™) at 5 µl/sample. After a 20-minute incubation at RT, staining was performed with 1 µg/mL DAPI (BD Pharmingen™) diluted in 1% BSA/PBS. Analysis was performed using the BD™ LSR II flow cytometer equipped with FACSdiva software. Each experiment was conducted on different cell batches. The data were presented as an original multiparameter cell cycle analysis (G0-G1, S, G2-M).
Quantification of apoptotic cells dependent on PARP-1 cleavage
1 × 10⁶ Caco-2 cells were prepared after 24-hour incubation with 100 µg/mL PNPs and 2-hour incubation with etoposide (Sigma-Aldrich), as a positive control with a final concentration of 50 µM. Cells were washed with PBS solution (VWR) and then treated with 100 µl of 1 mM BrdU from BD Pharmingen™ kit. Incubation was carried out for 60 min in a cell incubator at 37 °C, 5% CO2. Then cells were collected by trypsinization, washed with 1% BSA/PBS (Sigma-Aldrich), fixed and permeabilized with BD Cytofix/Cytoperm™ Fixation/Permeabilization Solution, BD Cytofix/Cytoperm™ Plus Permeabilization Buffer (BD Pharmingen™) and stained with PE Mouse Anti-Cleaved PARP (Asp214) antibody (BD Pharmingen™) in a 5 µl/sample volume. After a 20-minute incubation at room temperature, additional staining was performed with 1 µg/mL DAPI (BD Pharmingen™) diluted in 1% BSA/PBS. An assay was performed using the BD™ LSR II flow cytometer equipped with FACSdiva. Each experiment was performed on different cell batches.
Alkaline comet assay
For the experiment, 1 × 10⁵ Caco-2 cells grown on T-75 flasks, were prepared after a 24-hour incubation with 100 µg/mL PNPs and a 2-hour incubation with etoposide (Sigma-Aldrich), a positive control with a final concentration of 50 µM. To 500 µl of dissolved agarose (Bio-techne, R&D Systems) was added 50 µl of cells immersed in chilled 1 mL PBS (VWR), then applied 50 µl each to two CometSlide wells (Bio-techne, R&D Systems) and spread over the entire surface. The slides were placed in the dark for 10 min at 2–8ºC. The next step was to subject the cells to lysis by immersing the slides in lysis solution (Bio-techne, R&D Systems) for 60 min at 4 °C. The samples were then incubated in an alkaline unwinding solution (pH > 13) (NaOH pellets 0.4 g; 200 mM EDTA, pH 10 250 µl; H2O 49.75 mL) for 20 min at RT (in the dark). Electrophoresis was carried out in a cooled Comet Assay Tank (Cleaver Scientific), immersing the slides in an alkaline buffer, pH 13 (NaOH granules 8 g; 500 mM EDTA 2 mL; H2O 1 L). After electrophoresis, the samples were washed, fixed with 70% ethanol (POCH), and thoroughly dried. After fixation, cells were stained by applying 100 µl of diluted SYBR Safe solution (Invitrogen) to each sample for 30 min in the dark. The samples were dried and analyzed under a Leica TCS SP5 confocal microscope (Leica, Germany) at 502/530 nm wavelengths. The comet assay images were analyzed (% of DNA in head and % of DNA in tail) using OpenComet v1.3.1 software as described previously [16]. For each treatment group, at least 50 comets were scored per biological replicate. Three independent experiments (n = 3) were performed.
Flow cytometry analysis of DNA double-strand breaks
1 × 10⁶ Caco-2 cells grown on T-75 flasks were prepared after 24-hour incubation with 100 µg/mL PNPs and 2-hour incubation with 50 µM etoposide (Sigma-Aldrich), as a positive control. Cells were washed with PBS solution (VWR) and then treated with 1 mM BrdU from BD Pharmingen™ kit. Incubation was carried out for 60 min. at 37 °C in 5% CO2. Then cells were collected by trypsinization, washed with 1% BSA/PBS (Sigma-Aldrich), fixed and permeabilized with BD Cytofix/Cytoperm™ Fixation/Permeabilization Solution, BD Cytofix/Cytoperm™ Plus Permeabilization Buffer (BD Pharmingen™) and stained with Alexa Fluor® 647 Mouse Anti-H2AX (pS139) antibody (BD Pharmingen™) at 5 µl/assay. After a 20-minute incubation at room temperature, staining was performed with 1 µg/mL DAPI (BD Pharmingen™) diluted in 1% BSA/PBS Sigma-Aldrich). An assay was performed using the BD™ LSR II flow cytometer system and FACSdiva software. Each experiment was performed on different cell batches.
RNA isolation and cDNA synthesis
According to the manufacturer’s instructions, total RNA was isolated from Caco-2 cells grown on T-75 flasks, using the RNeasy Mini Kit and protocol provided by the manufacturer (Qiagen, TX, USA) with DNaseI treatment. The RNA’s concentration and purity were assessed using µDrop™ Duo Plates in a Multiskan SkyHigh microplate reader (Thermo Scientific, DE, USA). RNA samples from three biological replicates were prepared from control Caco-2 cells and cells treated with 100 µg/mL PNPs. Each sample (1 µg RNA) was subjected to reverse transcription using the iScript cDNA Synthesis Kit from Bio-Rad, employing RNase H + MMLV reverse transcriptase in a final reaction volume of 20 µl, as specified in the kit’s instructions.
qPCR assay
The expression of genes was assessed in two Caco-2 cell lines (untreated vs. nanoparticle PNPs-100 µg/mL treated) using a PrimePCR assay with a custom-designed SYBR plate (Bio-Rad), following the manufacturer’s protocol. This custom plate targeted 14 genes involved in the DNA damage response (DDR): PARP3, OGG1, LIG3, LIG1, ATM, ATR, TP53BP1, XRCC1, RAD51, BRCA1, XRCC4, PARP2, PARP1, and H2AFX, with ACTB serving as the reference gene. The qPCR reaction utilized 1 µl of cDNA, iTaq™ Universal SYBR® Green Supermix (Bio-Rad), and primers preloaded in a 96-well plate, following the protocol for custom SYBR Green® reaction setups. The qPCR experiments were performed using a CFX Opus 96 Real-Time PCR System (Bio-Rad), and gene expression data were analyzed with CFX Manager™ Software (Bio-Rad). Controls included a PCR performance test and a reverse transcription control assay (RT) to verify the corresponding stages of the experiment. The average ΔCt for the control group (derived from untreated Caco-2 cells) was used as a calibrator, with ΔΔCt calculated by subtracting this value from each ΔCt value. Fold change was then determined using the standard Eq. 2^-(ΔΔCt) as described previously. Gene expression for each gene was assessed based on three biological replicates.
Statistical analysis
All experiments were performed in at least three independent biological replicates to confirm reproducibility. Results were displayed as mean ± SEM by Prism 4 (GraphPad Software Inc). One-way ANOVA was used to analyze experimental data. Dunnett’s post-hoc test was used for multiple comparisons of trypan blue exclusion assay, clonogenic assay, and ROS measurement, where multiple concentrations were compared against the control. P-values were considered significant: *p ≤ 0.05, **p ≤ 0.01, ***p ≤ 0.001 and ****p ≤ 0.0001.


Comments (0)