
Remember me
After a one-week acclimation period, the modeling process began on Day 0 (D0). On this day, mice received a tail vein injection of AAV9 adenovirus (titer: 1 × 10¹³) from Nanjing Zhongke Shikang to establish a systemic gene-editing model. Gene modifications were performed using the BPIFB4 CDS sequence and siBPIFB4 sequence, with full sequences provided in Supplementary Material 1. On Days 1 and 29, mice were intranasally administered lipopolysaccharide (LPS; 30 μg/6 μL). From Days 2 to 30, mice were subjected to passive smoke exposure in a sealed chamber for 1 h per session, 5 days per week, and for 4 consecutive weeks (Ziyun brand cigarettes, Kashgar, China). The modeling timeline is illustrated in Fig. 1.
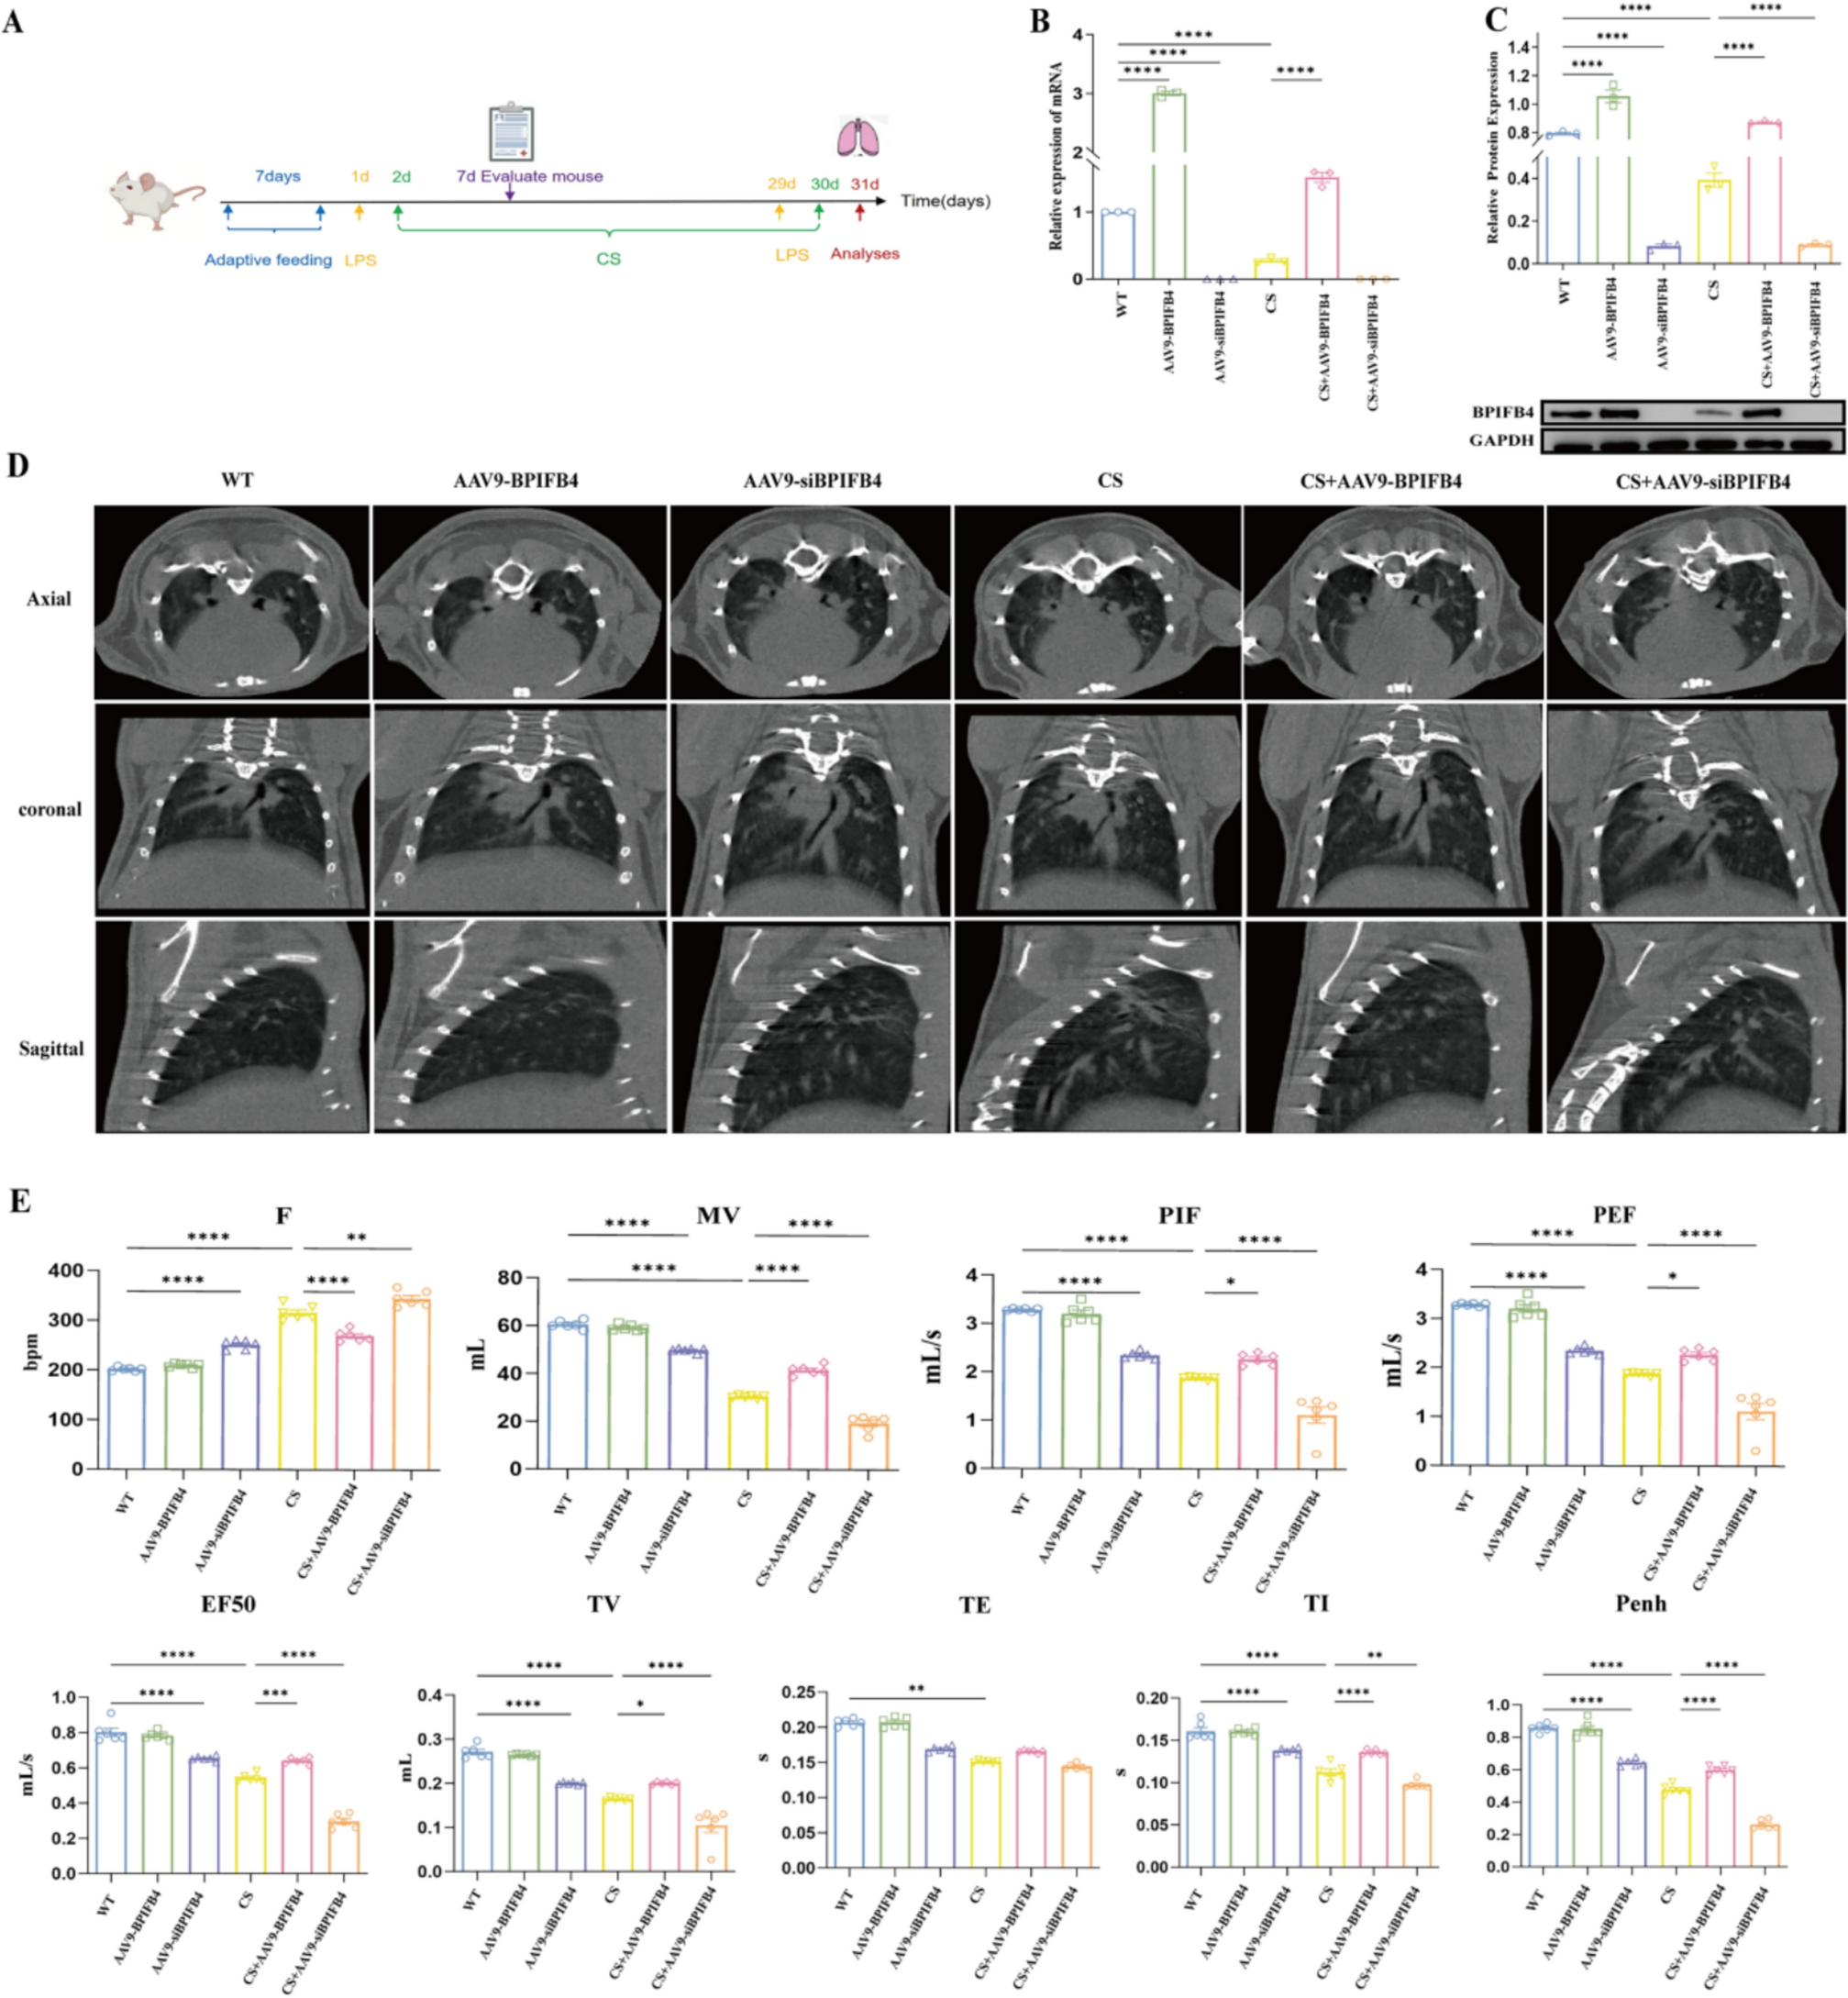
Fig. 1
BPIFB4 overexpression alleviates lung tissue and functional impairment in COPD mice. A Illustrative representation of intranasal drip of LPS/PBS and exposure to CS/air for a duration of 30 days in mice with either BPIFB4 overexpression or suppression (AAV9-BPIFB4 or AAV9-siBPIFB4; (n = 6/group). The independently repeated experiments were performed three times. B, C BPIFB4 mRNA and protein expression levels in lung tissues were analyzed by quantitative real-time PCR and western blotting. D Lung pathology was assessed via CT imaging. E Lung function parameters were evaluated, including respiratory frequency F, TI, PIF, EF50, TV, TE, MV, and PEF. *P < 0.05, **P < 0.01, ***P < 0.001, ****P < 0.0001
Preparation of 3% CSECSE was prepared using commercially available cigarettes (standard composition: 11-mg tar, 1.0-mg nicotine, and 11-mg carbon monoxide) as the raw material. The primary components of CSE were nicotine and carbon monoxide. Detailed procedures can be found in Supplementary Material 1.
Lung Function and Computed TomographyWhole-body plethysmography was used to monitor respiratory movements, with pressure changes in the chamber recorded and analyzed. After the experiment, anesthetized mice underwent micro-CT scanning to assess lung structural changes.
Plasmid Construction, Lentivirus Production and Cell TransductionTHP-1 cells (Procell, China) were thawed, centrifuged, and resuspended in RPMI-1640 with 10% FBS. After seeding (5 × 10⁵ cells/well) and 24-h incubation, differentiation was induced with 100-nM PMA for 48 h, followed by fresh medium replacement and 24-h recovery. Differentiated macrophages at 80% confluence were treated with 3% CSE for 24 h. Cells were transfected using Transtg® EL reagent (YEASEN, China) with pcDNA-BPIFB4 or siBPIFB4. After 24 h, 100-nM PKI-402 (MCE, USA) was added for 1 h. Cells and supernatants were collected 48-h post-transfection (specific sequences are provided in Supplementary Material 1).
Bronchoalveolar Lavage Fluid (BALF)The left main bronchus was ligated, followed by insertion of a catheter into the trachea and injection of 0.5 mL of sterile PBS for recovery of BALF. The fluid was recovered under low negative pressure and the lavage was repeated three times. The BALF was filtered through sterile gauze, centrifuged at 1500 rpm for 10 min at 4 ℃, and then stored at −20 ℃. Detailed procedures can be found in Supplementary Material 1.
Flow CytometryBALF and cultured cells were processed for flow cytometry. BALF cells were lysed, washed, and blocked with Fc receptor blocker before staining with CD11b(M0), CD86 (M1), and CD206(M2) [17]. Fixation, permeabilization, and washing were performed before data acquisition using NovoExpress. Cultured cells were trypsinized, washed, stained with APC-CD11b, FITC-CD86, and FITC-CD206, and analyzed using NovoCyte Penteon. Detailed procedures can be found in Supplementary Material 1.
Real-Time Quantitative PCRTissues were ground in liquid nitrogen and lysed in Trizol. RNA was extracted via chloroform phase separation and isopropanol precipitation and then dissolved in DEPC-treated water. Reverse transcription was performed using the Hifair® kit. qPCR was conducted with Hieff® SYBR Green, specific primers, and a 40-cycle protocol. Data were analyzed using GraphPad Prism. Detailed procedures can be found in Supplementary Material 1.
Enzyme-linked Immunosorbent Assay (ELISA)Cytokine levels in serum and cell supernatants (IL-10, IL-6, IL-1β, TNF-α, ARG-1, TGF-β) were measured with ELISA kits (Jianglai Biotechnology, China), following the manufacturer’s instructions.
Western Blotting AnalysisCells (liquid nitrogen-ground tissue) were lysed with RIPA, PMSF, and phosphatase inhibitor at 4℃ for 1 h, centrifuged, and then quantified by BCA (YEASEN, China). Proteins were separated by 12% SDS-PAGE, transferred to PVDF membranes at 100 V, blocked with 5% milk, incubated with antibodies, and detected by ECL. ImageJ was used for analysis. Detailed procedures can be found in Supplementary Material 1.
Statistical AnalysisThe statistical evaluations were performed using GraphPad Prism 10 (Graphpad Software, San Diego, CA, USA. For trials involving comparisons among more than two groups, one-way analysis of variance was employed. Each experiment was conducted in triplicate. A P value less than 0.05 (P < 0.05) was considered statistically significant.
Comments (0)