
Remember me
The participants (n = 114) were predominantly male (61%), never-smokers (90%), with more than half prescribed inhaled corticosteroids. Full demographic data are shown in Table 1. Differences in challenge methodology across our cohort did not result in significantly different PD20 values (see supplement).
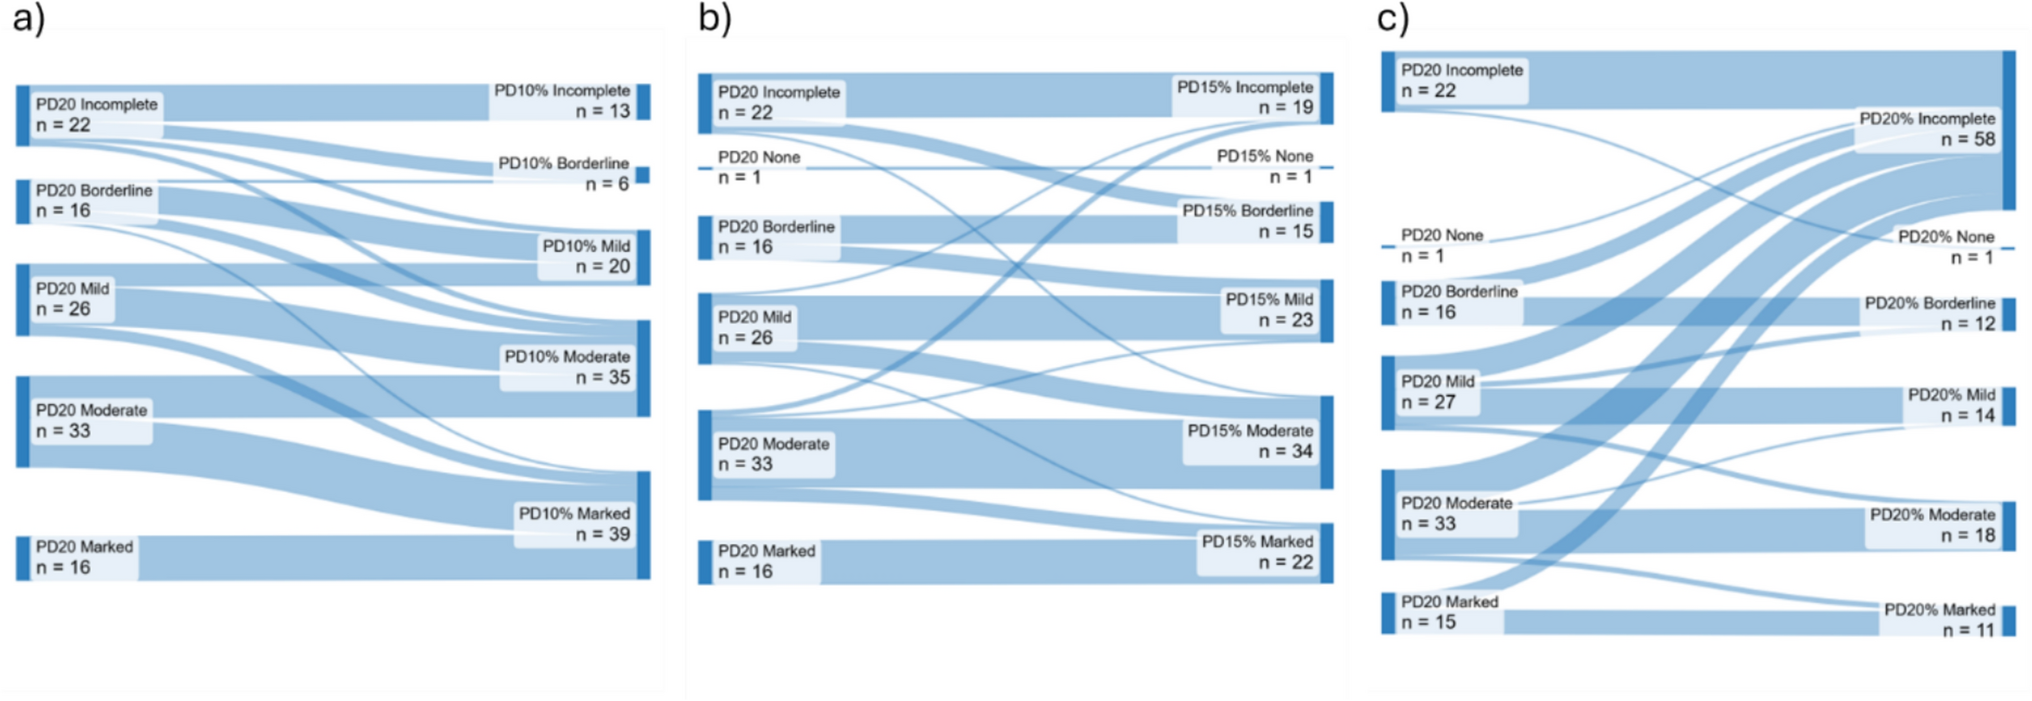
Table 1 Participant characteristicsPD20 compared to calculations using % predictedPD20 calculations showed that 91 (80%) patients were classified as hyperresponsive with a positive result at < 0.4 mg. To identify an equivalent threshold for % change in predicted FEV1, the number of patients meeting 10%, 15% and 20% thresholds was plotted (Fig. S1); these were termed PD10%, PD15%, and PD20%, respectively. In the 91 patients with a positive PD20 value, all patients achieved PD10% and 97% achieved PD15%, but only 60% achieved PD20%. The agreement was calculated for patients who achieved both PD20 and % change in predicted FEV1 criteria; there was significant agreement between PD20 and PD20% (r = 0.96, p < 0.0001; ICC = 0.98 (95% CI 0.96–0.99), p < 0.0001), PD20 and PD15% (r = 0.95, p < 0.0001; ICC = 0.97 (95% CI 0.90–0.98), p < 0.0001), but less agreement between PD20 and PD10% (r = 0.86, p < 0.0001; ICC = 0.81 (95% CI -0.08–0.94), p < 0.0001). More patients remained in the same category when using PD15% (74%, Fig. 1b), compared to PD10% and PD20% (46% and 61% respectively, Fig. 1a, c). PD10% resulted in at least half of patients (54%) becoming more hyperresponsive (Fig. 1a), whereas PD20% was not achieved in an additional 37 patients (32%) compared to PD20 (Fig. 1c). Subsequent analysis used PD15% due to this close relationship to PD20 results (unlike PD10%) and it being commonly achieved alongside PD20 (unlike PD20%).
Fig. 1
Difference in reported hyperresponsiveness compared to PD20 when using and a PD10%, b PD15% and c PD20%. Incomplete — the required fall in FEV1 was not achieved and hence a PD value was not calculated. For PD20, these patients are considered to not be hyperresponsive as they did not respond by dose that equates to a positive test (i.e. > 0.4 mg). Some patients who were hyperresponsive with PD20 but had an incomplete PD10%, PD15%, or PD20% value may become positive if further doses are administered and therefore were not fully classified using PD%; None — patients who had the required fall in FEV1, but the PD or PD% value was above the threshold for a positive test (i.e. > 0.4 mg); PD20 — provocative dose resulting in a 20% fall in FEV1; PD10% — Provocative dose resulting in a 10% fall in the percent predicted value for FEV1; PD15% — provocative dose resulting in a 15% fall in the percent predicted value for FEV1; PD20% — provocative dose resulting in a 20% fall in the percent predicted value for FEV1
In patients with a positive PD15% value (n = 88), the median % fall in FEV1 was greater (p < 0.0001) for PD20 versus PD15%; 24.3% (range: 20.0–41.5%) versus 22.4% (range: 15.1–41.5%). Similarly, the median % predicted fall was greater (p = 0.0004) for PD20 versus PD15%; 21.4% (range: 15.4–37.5%) versus 19.1% (range: 15.1–37.5%) respectively. PD20 was significantly higher than PD15%; mean difference (95%CI) 0.0055 mg (0.0038–0.0078 mg), p < 0.0001 (Fig. 2). Setting the target fall in FEV1 using PD15% resulted in 33 patients (29%) requiring at least one less dose of methacholine. Those requiring fewer doses had better baseline lung function (FEV1% predicted mean (95%CI) difference: 13.9% (8.7–19.2%; p < 0.0001; Fig. S2) and were younger (median age difference [IQR]: − 4 [− 4 to − 8] years, p = 0.0159), whereas height and sex were not different (both p > 0.05). Both PD20 and PD15% were similar between patients taking ICS and steroid naive patients (Fig. S3).
Fig. 2
Difference in reported hyperresponsiveness when using PD20 and PD15%. Thin lines represent individual participants. Thick lines represent median value. PD20 versus PD15% comparison included only patients with both a PD20 and PD15% value (n = 87). PD20 — provocative dose resulting in a 20% fall in FEV1; PD15% — provocative dose resulting in a 15% fall in the percent predicted value for FEV1
Change in hyperresponsiveness classification when using PD15% (versus PD20) is shown in Fig. 1b. PD15% resulted in some patients being classified as more hyperresponsive (n = 20) and 6 patients changing classification from non-responsive to hyperresponsive. A PD15% value could not be calculated in 3 patients (i.e. an absolute 20% fall was met without obtaining a 15% fall in predicted).
Relationship to Baseline Lung FunctionFor the PD20 calculation of the required volume (L) fall in FEV1, there was a positive correlation between the required volume and the baseline FEV1% predicted (r = 0.54, p < 0.0001; Fig. 3a), signifying that a smaller volume fall was required in those with a greater degree of airflow obstruction at the start of the challenge. The PD20 observed was also associated with baseline FEV1% predicted (r = 0.20, p = 0.026, Fig. 3c). There was no correlation between the required volume (L) fall and baseline FEV1% predicted for the PD15% criteria (r = − 0.02, p = 0.43; Fig. 3b), or the PD15% observed and baseline FEV1% predicted (r = 0.12, p = 0.13, Fig. 3d).
Fig. 3
Upper panel: Relationship between baseline airflow obstruction (FEV1% predicted) and the volume (L) fall in FEV1 required to meet PD20 and PD15% (a, b, respectively). Lower panel: Relationship between baseline airflow obstruction (FEV1% predicted) and hyperresponsiveness measured by log10 + 10 transformed PD20 and PD15% (c, d, respectively). Correlations calculated as Spearman r value (a, b) or Pearson r value (c, d). PD20 — provocative dose resulting in a 20% fall in FEV1; PD15% — provocative dose resulting in a 15% fall in the percent predicted value for FEV1. FEV1 — Forced expired volume in 1 s
Simple linear regression revealed a separation between PD methods at higher baseline FEV1% predicted values (Fig. 4), and multiple linear regression confirmed that baseline FEV1% predicted was a major determinant of the difference between PD20 and PD15% (β = 0.0095, p < 0.0001, Table 2). Age, height and sex did not significantly predict the difference in reported hyperresponsiveness (Table 2).
Fig. 4
Simple linear regression (mean and error) for PD20 and PD15% showing separation at higher baseline FEV1% predicted. In patients with higher baseline % predicted FEV1, PD15% was generally lower than PD20 (i.e. patient labelled as more hyperresponsive). PD20 — provocative dose resulting in a 20% fall in FEV1; PD15% — provocative dose resulting in a 15% fall in the percent predicted value for FEV1. FEV1 — Forced expired volume in 1 s
Table 2 Multiple linear regression showing the impact of sex, age, height, and baseline airflow obstruction (FEV1% predicted) in predicting the change in hyperresponsiveness (PD value) when switching from PD20 to PD15%VariabilityFifteen patients had repeat data, performed within 1 week. There was no significant change in PD value between repeated challenges for PD20 (mean DD difference (95% range): 0.67 (1.38), p = 0.48; Fig. 5a) or PD15% (mean DD difference (95% range): 0.66 (1.35), p = 0.66; Fig. 5b). 13 out of 15 patients were within 1 DD for both PD20 and PD15%. Figure S4 shows similar variation for repeated PD20 values and repeated PD15% values. ICC analysis showed excellent agreement between repeat visits for log transformed PD20 values (ICC (95% CI): 0.83 (0.49–0.94), and for log transformed PD15% values (ICC (95% CI): 0.84 (0.53–0.95). A change in baseline FEV1% predicted between the first and second challenge correlated with the DD change in PD20 (r = 0.58, p = 0.03; Fig. 5c), while no association was seen for DD change in PD15% (r = 0.28, p = 0.31; Fig. 5d).
Fig. 5
Upper panel — change in PD values between repeat visits for PD20 and PD15% (a, b, respectively); Lower panel — relationship between the change in baseline airflow obstruction (post-diluent FEV1% predicted) and change in PD20 and PD15% between repeated challenges (c, d, respectively). Correlations calculated as Spearman r value. Statistical analysis performed with log10 + 10 transformed data. DD — average doubling dose change (95% range for future differences); PD20 — provocative dose resulting in a 20% fall in FEV1; PD15% — provocative dose resulting in a 15% fall in the percent predicted value for FEV1. FEV1 — Forced expired volume in 1 s
Comments (0)