
Remember me
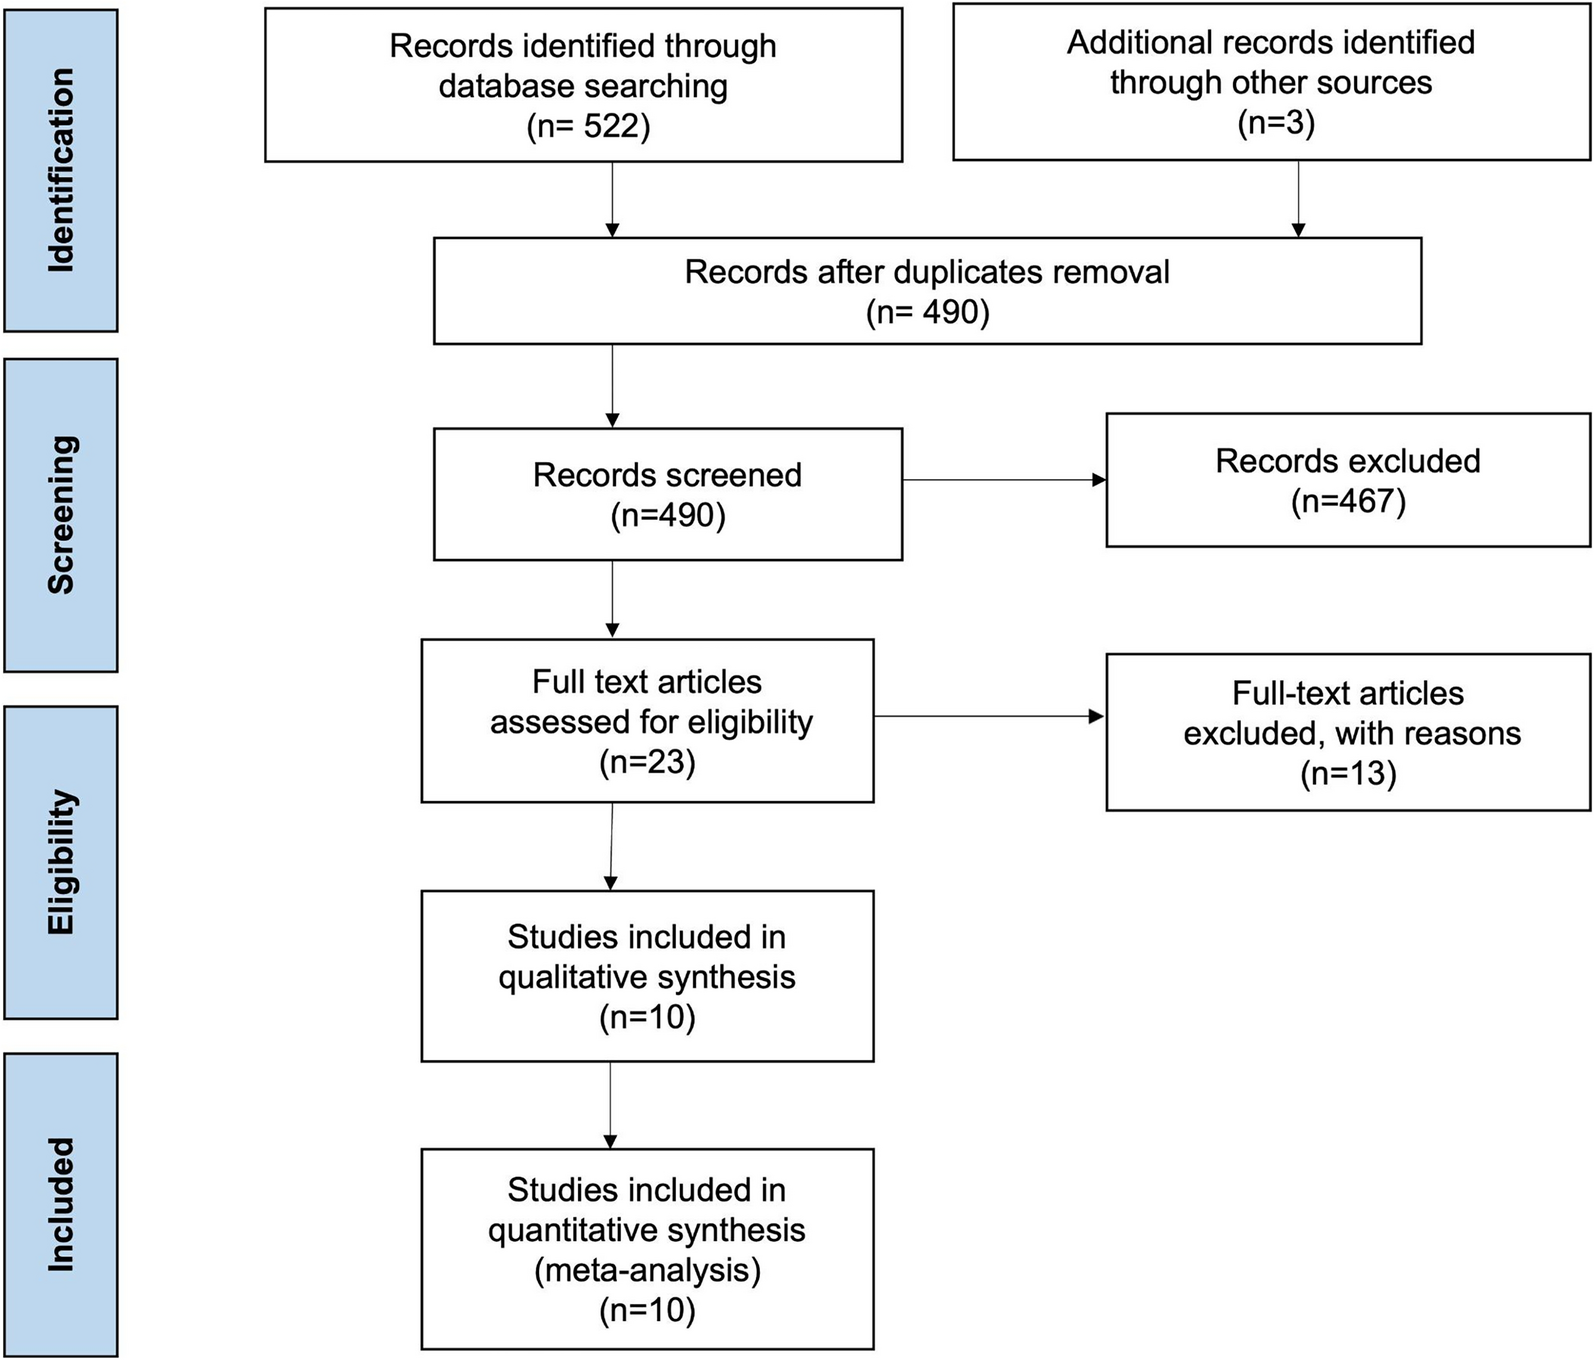
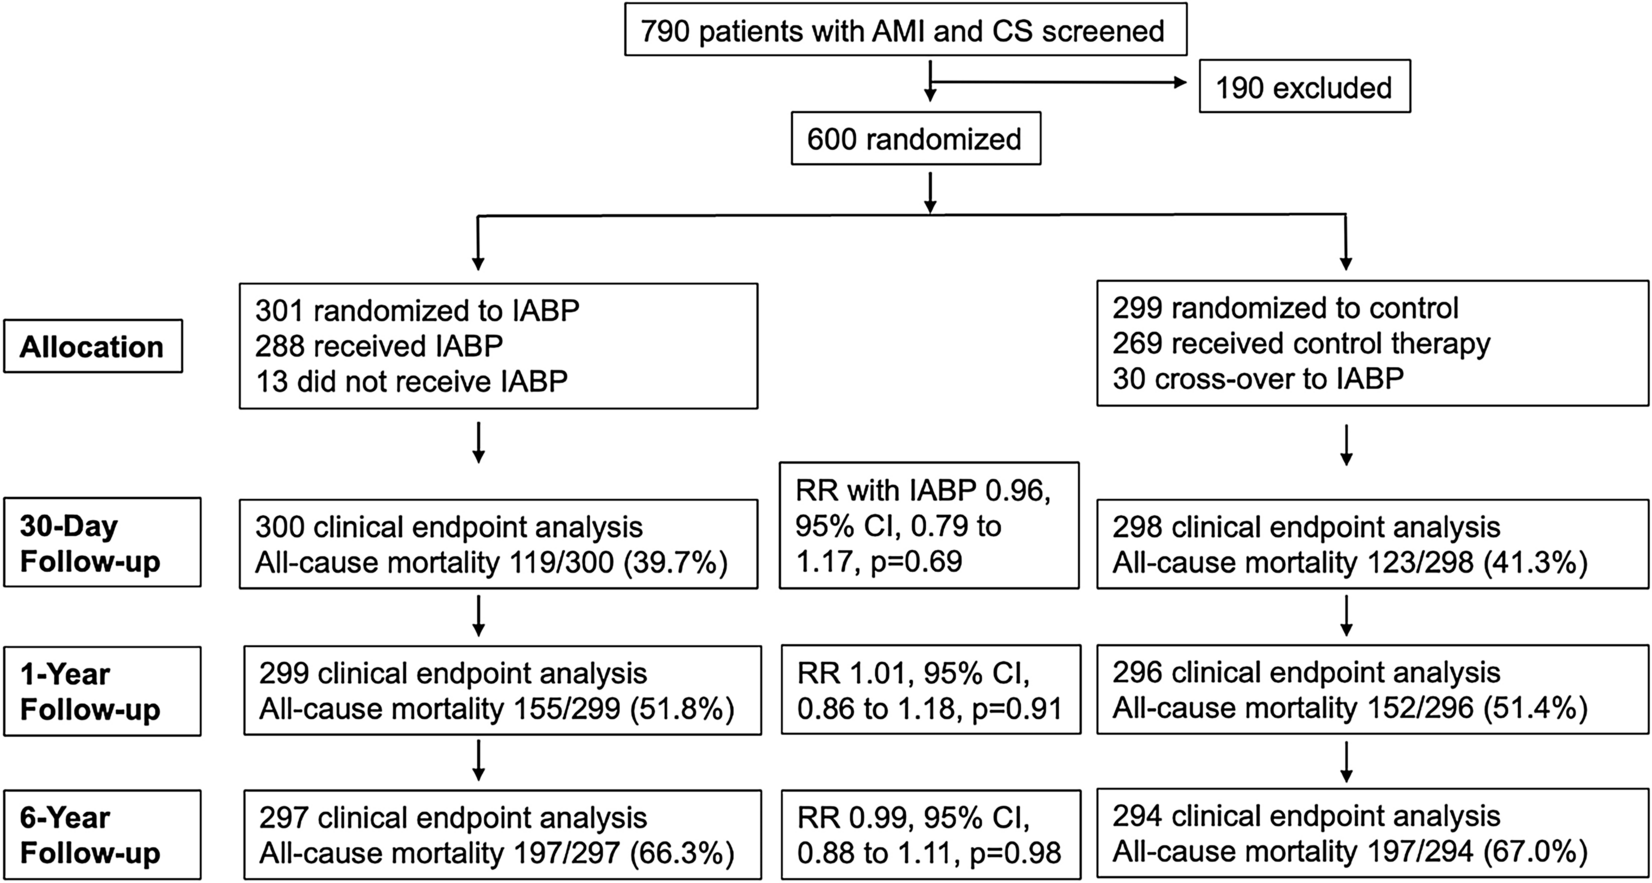
The study selection process appears in Fig. 1. The initial analysis yielded 631,552 patients. After excluding patients not meeting our selection criteria, the final cohort included 545,409 hospitalizations, of whom 226,053 (41.4%) underwent SAVR and 319,356 (58.6%) underwent TAVR. The SAVR cohort included 18,451 (8.2%) patients with PVD and 207,602 (91.8%) patients without PVD. The TAVR cohort included 42,531 (13.3%) patients with PVD and 276,825 (86.7%) patients without PVD.
Fig. 1
Study flow diagram outlining the selection process for the final cohort included in the analysis. Starting with a total cohort of 631,552 patients, exclusions were made for missing data, non-aortic valve surgeries (MV, PV, TV), cases with aortic valve disease not as the principal diagnosis, and transcatheter aortic valve replacement (TAVR) procedures converted to surgical aortic valve replacement (SAVR). This resulted in 545,409 patients eligible for analysis, divided into TAVR (n = 319,356) and SAVR (n = 226,053) groups. Further stratification into polyvascular disease (PVD) and non-PVD subgroups was performed, followed by matching within TAVR groups and between TAVR-PVD and SAVR-PVD groups to create comparable cohorts for analysis
Temporal Trends of Aortic Valve Replacement Among Patients with Polyvascular DiseaseAmong patients with PVD, there was no change in the number of AVR procedures during the study years (58,028 in 2016 vs. 60,815 in 2020, Ptrend = 0.11). There was an increase in the proportion of TAVRs (39.5% in 2016 to 59.9% in 2020, Ptrend < 0.001), and a decline in the proportion of SAVRs (60.5% in 2016 to 40.1% in 2020, Ptrend < 0.001) during the study years (Fig. 2). Trend analyses per number of affected vascular showed no significant temporal changes in the number of AVR procedures among patients with one, two, or three atherosclerotic beds undergoing AVR (Fig. 2).
Fig. 2
A Temporal trends in admissions for AVR, TAVR, and SAVR among those with PVD. B Temporal trends in admissions for AVR, TAVR, and SAVR according to the number of vascular beds. Panel A illustrates the temporal trends in admissions for aortic valve replacement (AVR), transcatheter aortic valve replacement (TAVR), and surgical aortic valve replacement (SAVR) among patients with peripheral vascular disease (PVD) from 2016 to 2020. Panel B shows the temporal trends in admissions for AVR, TAVR, and SAVR based on the number of affected vascular beds
Baseline CharacteristicsThe baseline characteristics of patients with PVD undergoing TAVR versus SAVR appear in Table 1. In the unmatched cohort (TAVR [n = 42,5311 vs. SAVR [n = 18,451]), patients with PVD undergoing TAVR were older and more likely to be women compared with those undergoing SAVR. Also, patients undergoing TAVR had a higher burden of comorbidities. After matching (TAVR [n = 12,1411 vs. SAVR [n = 12,020]), the SMD values were < 0.1 for all the covariates. The baseline characteristics of patients with versus without PVD undergoing TAVR are shown in Table 2. In the unmatched cohort (TAVR-PVD [n = 42,5311 vs. TAVR-non PVD [n = 276,825]), patients with PVD undergoing TAVR were less likely to be women and had higher comorbidities compared with those without PVD. After matching (TAVR-PVD [n = 42,5311 vs. TAVR-non PVD [n = 41,982]), the SMD values were < 0.1 for all the covariates.
Table 1 Baseline characteristics among PVD patients undergoing TAVR versus SAVRTable 2 Baseline characteristics for patients with versus without PVD undergoing TAVROutcomes of Transcatheter versus Surgical Aortic Valve Replacement Among Patients with Polyvascular DiseaseAmong the matched cohorts, patients with PVD who underwent TAVR had lower odds of in-hospital mortality compared with patients who underwent SAVR (1.1% vs. 4.0%; OR 0.26; 95% CI 0.19–0.35). Similar results were obtained on a multivariable analysis involving the unmatched study cohort (1.6% vs. 3.4%; OR 0.27; 95% CI 0.22–0.33). Patients with PVD who underwent TAVR versus SAVR had lower major bleeding, acute MI, blood transfusion, acute kidney failure, transient ischemic attack, ischemic stroke, hemorrhagic stroke, postoperative hemorrhage, acute deep venous thrombosis or pulmonary embolism, mechanical circulatory support, other bleeding, pericardial complications, discharge to skilled nursing facility, and palliative care utilization. Patients with PVD undergoing TAVR versus SAVR had higher vascular interventions, complete heart block, acute heart failure exacerbation, and PPM (Fig. 3).
Fig. 3
Forest plot for adjusted outcomes for TAVR versus SAVR among those with PVD. Adjusted odds ratios comparing various adverse outcomes in transcatheter aortic valve replacement (TAVR) versus surgical aortic valve replacement (SAVR) patients within the peripheral vascular disease (PVD) cohort. Each point represents the adjusted odds ratio for a specific outcome, with horizontal lines indicating the 95% confidence intervals. Outcomes to the right of the dotted line (OR > 1) indicate a higher likelihood in the TAVR group, while outcomes to the left (OR < 1) indicate a higher likelihood in the SAVR group
Patients with PVD who underwent TAVR had higher unplanned 90-day readmission (20.2% vs. 17.6% aOR 1.13; 95% CI 1.01–1.26), as well as higher readmission-related AMI, PCI, and PPM compared with the patients with PVD who underwent SAVR. Results related to event rates among matched patients with PVD who underwent TAVR and SAVR are presented in Supplemental Table 2. Among patients with PVD, concomitant coronary revascularization occurred in 36.9% of SAVR procedures (i.e., CABG), and 5.1% of TAVR procedures (i.e., PCI). A subgroup analysis suggested an interaction in outcomes of TAVR versus SAVR according to coronary revascularization status (Pinteraction < 0.001). Among those undergoing coronary revascularization, there was no difference in in-hospital mortality between TAVR versus SAVR (aOR 0.84; 95% CI 0.53, 1.31, p = 0.44), while among those not undergoing coronary revascularization, there was lower in-hospital mortality after TAVR versus SAVR (aOR 0.21; 95% CI 0.16, 0.27, p < 0.001).
Outcomes of Transcatheter versus Surgical Aortic Valve Replacement Among Patients without Polyvascular DiseaseAmong the matched cohort, there were similar odds of in-hospital mortality among those with versus without PVD who underwent TAVR, (1.6% vs. 1.5%, aOR 1.10; 95% CI 0.94–1.20, p = 0.23). TAVR among patients with PVD versus without PVD had similar odds of major bleeding, complete heart block, transient ischemic attack, hemorrhagic stroke, postoperative hemorrhage, acute deep venous thrombosis or pulmonary embolism, pericardial complications, and palliative care utilization. Patients who underwent TAVR with PVD had higher odds of acute MI, blood transfusion, vascular interventions, acute kidney failure, acute HF exacerbation, ischemic stroke, mechanical circulatory support, discharge to skilled nursing facility, and lower odds of PPM implantation compared with patients without PVD (Fig. 4). There were similar odds of unplanned 90-day readmission after TAVR among those with versus without PVD (20.2% vs. 17.6%, aOR 1.14; 95% CI 1.08–1.21), while TAVR among patients with PVD had higher odds of readmission-related AMI and a lower rate of PPM compared to the patients without PVD. Results related to event rates among matched patients with PVD vs. without PVD who underwent TAVR are presented in Supplemental Table 3.
Fig. 4
Forest plot for adjusted outcomes for TAVR among those with versus without PVD. Adjusted odds ratios comparing various adverse outcomes in transcatheter aortic valve replacement (TAVR) patients with peripheral vascular disease (PVD) to those without PVD. Each point represents the adjusted odds ratio for a specific outcome, with horizontal lines indicating the 95% confidence intervals. Outcomes to the right of the dotted line (OR > 1) are more likely in the TAVR-PVD cohort, while those to the left (OR < 1) are more likely in the non-PVD cohort
Outcomes According to Number of Atherosclerotic Vascular BedsIn Fig. 5, we present the outcomes of TAVR and SAVR procedures per the number of atherosclerotic vascular beds. Compared with patients without any vascular disease, patients with one (aOR 1.43; 95% CI 1.30, − 1.56), two (aOR 1.63; 95% CI 1.39, − 1.90), and three (aOR 1.02; 95% CI 1.01, − 1.022), atherosclerotic vascular beds had higher odds of in-hospital mortality after SAVR. Comparatively, there were increased odds of in-hospital mortality among those with one (aOR 1.20; 95% CI 1.08, − 1.33), two (aOR 1.28; 95% CI 1.09, 1.48), three (aOR 1.18; 95% CI 0.81, − 1.70) atherosclerotic vascular beds after TAVR, albeit the observation for three vascular beds did not reach statistical significance. There was a progressively increased risk of ischemic stroke and 90-day unplanned readmissions after SAVR with increasing an number of affected vascular beds after both TAVR and SAVR.
Fig. 5
Forest plot for adjusted outcomes after SAVR and TAVR according to the number of vascular beds compared to patients with no PVD. Forest plot illustrating adjusted outcomes following surgical aortic valve replacement (SAVR) and transcatheter aortic valve replacement (TAVR), categorized by the number of affected vascular beds, compared to patients with no peripheral vascular disease. Panel A shows outcomes for patients who underwent SAVR, while panel B presents outcomes for patients who underwent TAVR
Comments (0)