
Remember me


The analysis of the time trend of the global GBM incidence data from 1975 to 2019 showed that the incidence of GBM was higher in the 65–74 and 75–84 age groups. In the 65–74 age group, the incidence increased rapidly from 1978 to 1992, and slowly increased from 1992 to 2019 without decreasing trend. In the 75–84 age bracket, the GBM morbidity increased rapidly from 1972 to 1998, exceeding the age group of 65–74 in 1004, becoming the age bracket with the highest morbidity of GBM, and then slowly increased and continued to occupy the age bracket with the highest morbidity of GBM. The trend of incidence in the 85 + age bracket was generally consistent with those in the 75–84 age bracket, but the overall incidence was lower than that in the 75–84 age group. In general, since 1999, the incidence of GBM has remained high and is still slowly rising. (Fig. 2).
Fig. 2
Joinpoint analysis of the incidence rates of glioblastoma in the U.S. between 1975 and 2019. (*) Indicates the annual percent change (APC) that is significantly different from zero (P < 0.05)
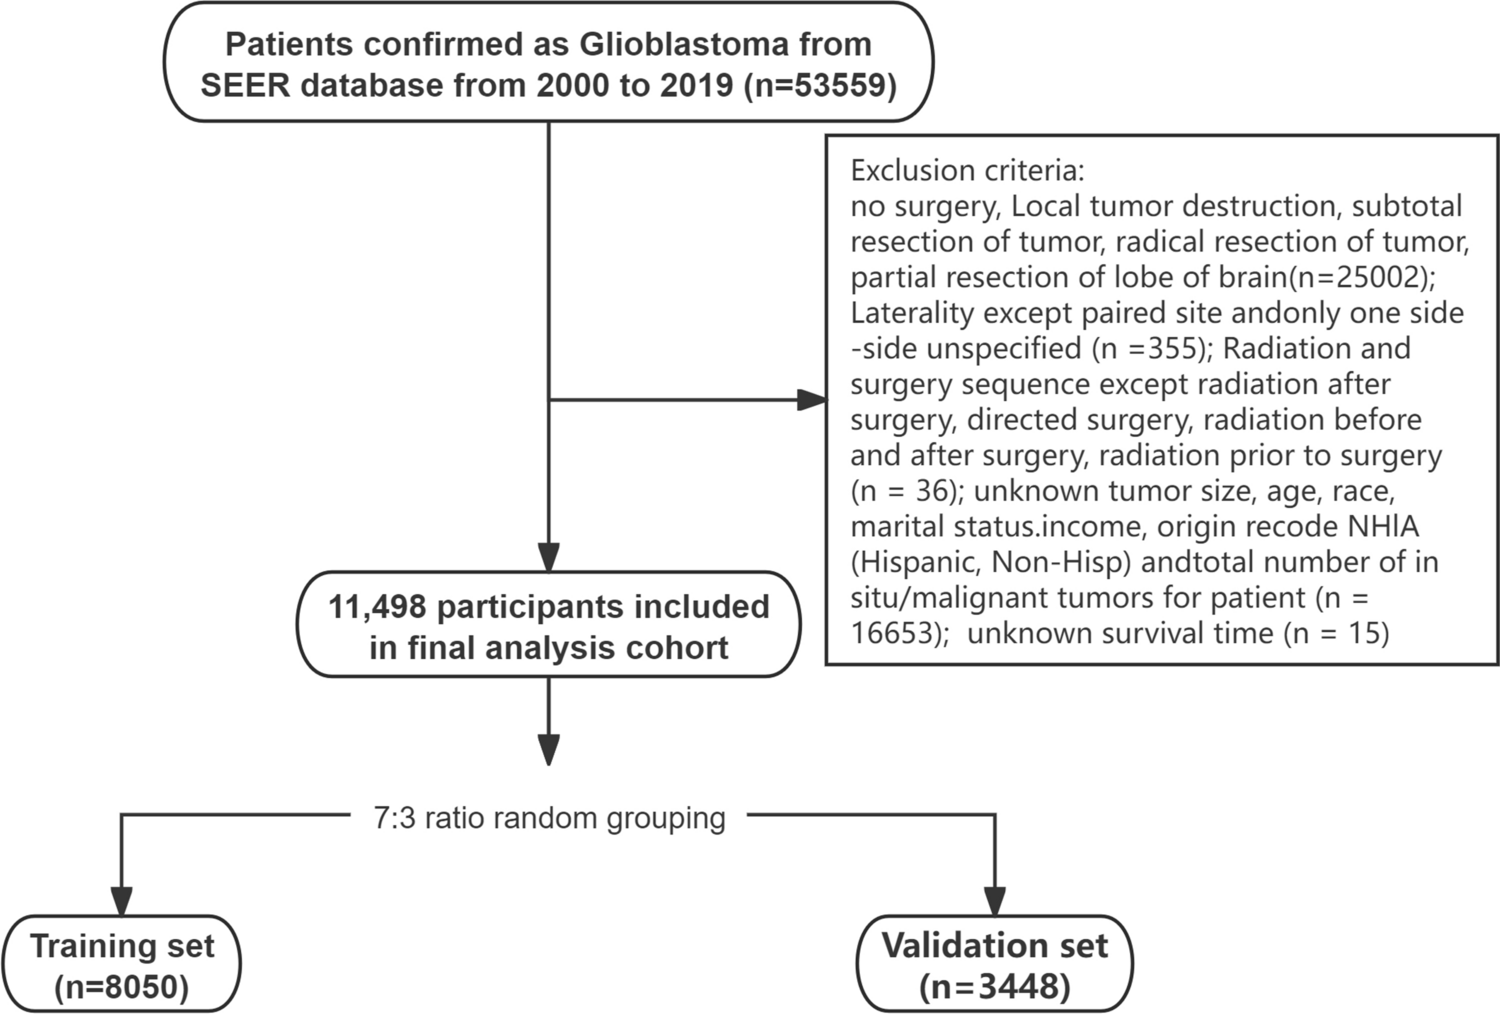
3.1 Patient baseline characteristicsFinally, a total of 11498 patients diagnosed with GBM from 2000 to 2019 were enrolled and then randomly divided into the training set (8050 cases) and the validation set (3448 cases) (Fig. 1). Among all patients, 59.2% were male and 40.8% were female. White 5.3%, black 5.1%; Unmarried 14.7%, married 67.8%; Surgery 78.5%; Chemotherapy accounted for 76.4%; Radiotherapy accounted for 83.1%; Systematic treatment accounted for 60.7%; The proportion of bilateral hemispheres was 44.7, and the left hemisphere was 42.6%. Only one primary tumor accounted for 89.5%; 71.3% started treatment within 1 month after diagnosis. Age and tumor size were continuous variables, median age was 63 [54–72] (median [IQR]), median tumor size was 45 [33–56]. The median follow-up time was 10 month [4,5,6,7,8,9,10,11,12,13,14,15,16,17,18,19]. Deaths accounted for 95.8 percent (Table 1). There were no significant differences in each of the included variables between the training and validation groups.
Table 1 Baseline characteristics of total study population3.2 Identification of independent factors of GBM in training cohortThe prognostic factors associated with OS and CSS in GBM patients were analyzed by stepwise regression and then multivariate Cox regression. Stepwise Cox regression analysis revealed that age, tumor size, sex, primary site and Laterality, number of primary tumors, surgery, chemotherapy, radiotherapy, systematic treatment, marital status, median household income, and first malignant primary indicator were the related factors of OS in GBM patients. Multivariate Cox regression analysis showed that all the above were independent risk factors for OS in GBM patients (Table 2).
Table 2 Multivariate analysis of overall survival (OS) AND cancer-specific survival (CSS) rates in the training cohortFor CSS, stepwise Cox regression analysis showed that demographic and clinicopathological factors associated with CSS added race compared with OS.All the above factors were included in multivariate Cox proportional hazards regression analysis, and all were independent prognostic factors for CSS except systematic treatment and race (Table 2). Thus, OS and CSS nomogram models for 0.5, 1-, 2-, 3-, 5 -, and 8-years were established respectively. (Fig. 3A and B).
Fig. 3
Establishment of overall survival (OS) and cancer-specific survival (CSS) nomograms. A Construction of OS nomogram; B construction of CSS nomogram
3.3 Development of a prognostic nomogram for OS and CSSPrognostic nomogram were constructed based on multivariate Cox regression results. In the nomogram, each variable subtype corresponds to the value of a points scale, that was, the contribution to OS and CSS results. The total score of each GBM individual was obtained by adding the scores of each subtype corresponding to each variable. A line was drawn at the corresponding position of the total Points scale. The individual OS and CSS probabilities of 0.5, 1, 2, 3, 5, and 8 years were obtained. (Fig. 3A, B).
3.4 Validation of the prognostic nomogramThe accuracy of the Nomogram was evaluated by internal and external validation of the C-index and calibration chart. In training cohort, the C index of Nomogram OS was 0.724 (95% CI 0.718–0.730) and that of CSS was 0.720 (95% CI 0.714–0.726). In the validation cohort, the C index of the Nomogram OS and CSS was 0.718 (95% CI 0.708–0.728) and 0.719 (95% CI 0.713–0.725), respectively. Calibration curves were also made to compare the nomogram prediction curve with the perfect curve. The results showed that the 0.5-, 1-, 2-, 3-, 5- and 8-year OS (Fig. 4A) and CSS (Fig. 4B) nomograms of the training cohort were in good agreement with the actual observation results, which was also reflected in the validation cohort. (Fig. 4C, D) The above results show that the predicted values of nomogram are in good agreement with the measured values on the training and validation cohorts.
Fig. 4
Calibration plot of the nomogram for predicting 0.5-,1-, 2-, 3-, 5- and 8‐year overall survival (OS) and cancer-specific survival (CSS) in training cohort and validation cohort, respectively. A 0.5-,1-, 2-, 3-, 5- and 8‐year OS in training cohort; B 0.5-,1-, 2-, 3-, 5- and 8‐year CSS in training cohort; C 0.5-,1-, 2-, 3-, 5- and 8‐year OS in validation cohort; D 0.5-,1-, 2-, 3-, 5- and 8‐year CSS in validation cohort
In addition, we calculated the individual score (PI score) based on the Nomogram, and then used the score to predict the survival of patients at 0.5-, 1-, 2-, 3-, 5- and 8 years. ROC curves were drawn to evaluate the predictive performance of the Nomogram in different cohorts. The AUC value ranges from 0.5 (no predictive effect) to 1 (complete prediction), and the higher the value, the stronger the nomogram resolution will be. The results showed that PIscore had a good ability to distinguish the survival conditions of OS and CCS at different time points in both the training cohort and the validation cohort, and the AUC was greater than or equal to 0.75 (Fig. 5).
Fig. 5
Receiver operating characteristics curve (ROC) comparison of overall survival (OS) and cancer-specific survival (CSS) nomogram in training cohort and validation cohort, respectively. A 0.5-,1-, 2-, 3-, 5- and 8‐year ROC of OS nomogram using training cohort; B 0.5-,1-, 2-, 3-, 5- and 8‐year ROC of CSS nomogram using training cohort; C 0.5-,1-, 2-, 3-, 5- and 8‐year ROC of OS nomogram using validation cohort; D 0.5-,1-, 2-, 3-, 5- and 8‐year ROC of CSS nomogram using validation cohort
Moreover, KM survival curves were constructed to assess the associations between the PIscore and OS/CCS in training cohort and validation cohort, the cutoff points were used to divided patients in high-risk and low-risk subgroups, and the results indicated that the high-risk subgroup had a worse prognosis (All log-rank P < 0.001, Fig. 6 and Supplementary Fig. 1) and a heightened risk of mortality (All log-rank P < 0.001, Fig. 7 and Supplementary Fig. 2).
Fig. 6
Kaplan–Meier survival curves for glioblastoma patients. A–F 0.5-A,1-b, 2-C, 3-D, 5-E and 8‐F year overall survival (OS) in training cohort; G–L 0.5-G,1-H, 2-I, 3-J, 5-K and 8‐L year cancer-specific survival (CSS) in training cohort
Fig. 7
Cumulative risk curves for glioblastoma patients. A–F 0.5-A,1-B, 2-C, 3-D, 5-E and 8‐F year overall survival (OS) in training cohort; G–L 0.5-G,1-H, 2-I, 3-J, 5-K and 8‐L year cancer-specific survival (CSS) in training cohort
3.5 Association between tumor size and prognosis in GBM patientsThe relationship between tumor size and survival outcomes (OS/CSS) in GBM patients was analyzed using a RCS model. After adjusting for potential confounders with multivariable Cox regression, the resulting curve is shown in the Fig. 8. The optimal model was selected based on the minimum AIC and BIC values, and the final model included three knots. The overall association test (P < 0.001) and the non-linearity test (P < 0.001) indicated a significant non-linear dose–response relationship between tumor size and GBM survival outcomes. Compared to patients with tumor size > 49 mm, those with tumor size ≤ 49 mm exhibited a steeper increase in risk. The results demonstrated that when tumor size < 49 mm, the risk of adverse clinical events increased rapidly with tumor size. However, when tumor size > 49 mm, the risk of all-cause mortality continued to rise but at a slower rate.
Fig. 8
Adjusted cubic spline models showing association between tumor size and hazard ratio for overall survival (A) and cancer-specific survival (B). The solid line and red zone represent the estimated odds ratio and its 95% confidence interval
Comments (0)