2.1 Cells and reagents
Human GC cell lines (HGC-27, SGC-7901) and gastric mucosal normal cells GES-1 were procured from the Cell Bank of Shanghai Chinese Academy of Sciences, (Shanghai, China). P4HA1 small interferences were constructed by Shanghai (Jimma Biotech). P4HA1, N-cadherin, E-cadherin, Vimentin, CD44, and β-actin (Proteintech), RPMI-1640 medium (Gibco), BCA protein quantification kit (Beyotime Biotechnology, China), B27, CCK-8 kit (Biosharp), Transwell chambers (Corning). HRP-linked goat anti-rabbit secondary antibody (LiankeBio, China). Growth factors (EGF and bFGF) were procured from (PeproTech, USA), and fetal bovine serum (FBS) (ExCell, Uruguay).
2.2 Cell culture
Cells were grown in RPMI-1640 medium with 10% FBS and 1% penicillin–streptomycin. The culture conditions were set at 37 ℃, with a 5% CO2 incubator. The exhausted medium was changed after two days. The cells were allowed to grow to > 80% for transmigration or to continue for further experiments.
2.3 Gastric cancer tissue samples
GC surgical tissue: Eight pairs of fresh GC lesions and respective normal gastric mucosa tissues (around 5 cm from the tumor peripheries) were collected intraoperatively (within 1 h after gastrectomy) from the First Affiliated Hospital of Bengbu Medical University for GC. To remove surface blood stains, all tissue samples were washed with saline, cut with scissors, and placed into sterile and enzyme-free EP tubes. These tubes were promptly frozen and kept at − 80 ℃ for future WB analysis of P4HA1. Tissue wax block specimen: GC radical surgery resection specimens were routinely formalin fixed and sent to pathology, routinely taken for paraffin embedding, dry and preserved at room temperature, according to the patient's pathology number, the GC tissues and corresponding paracarcinoma tissues wax blocks were retrieved from the Department of Pathology, and were used for immunohistochemical staining of P4HA1.The project was reviewed and approved by the Ethics Committee of the First Affiliated Hospital of Bengbu Medical University, and all subjects signed an informed consent form.
2.3.1 Immunohistochemical staining
Pathological wax blocks were cut into 4 μm thin slices using a pathology sectioning machine, and the slices were placed in an oven at 65 ℃for 1 h. Xylene was deparaffinized and then alcohol was sequentially hydrated, and citrate buffer was used to repair the antigen. 5% BSA or closed serum was added dropwise to the slices and incubated in a thermostat at 37 ℃for 30 min. PBS was used in place of primary antibody for immunostaining blanks, non-immunized goat or rabbit serum was used for negative controls, and lung tissue was used for positive controls. The primary and secondary antibodies were incubated overnight and then DAB was used to develop the color, followed by restaining using hematoxylin.
2.4 Bioinformatics analysis2.4.1 The cancer genome atlas (TCGA)
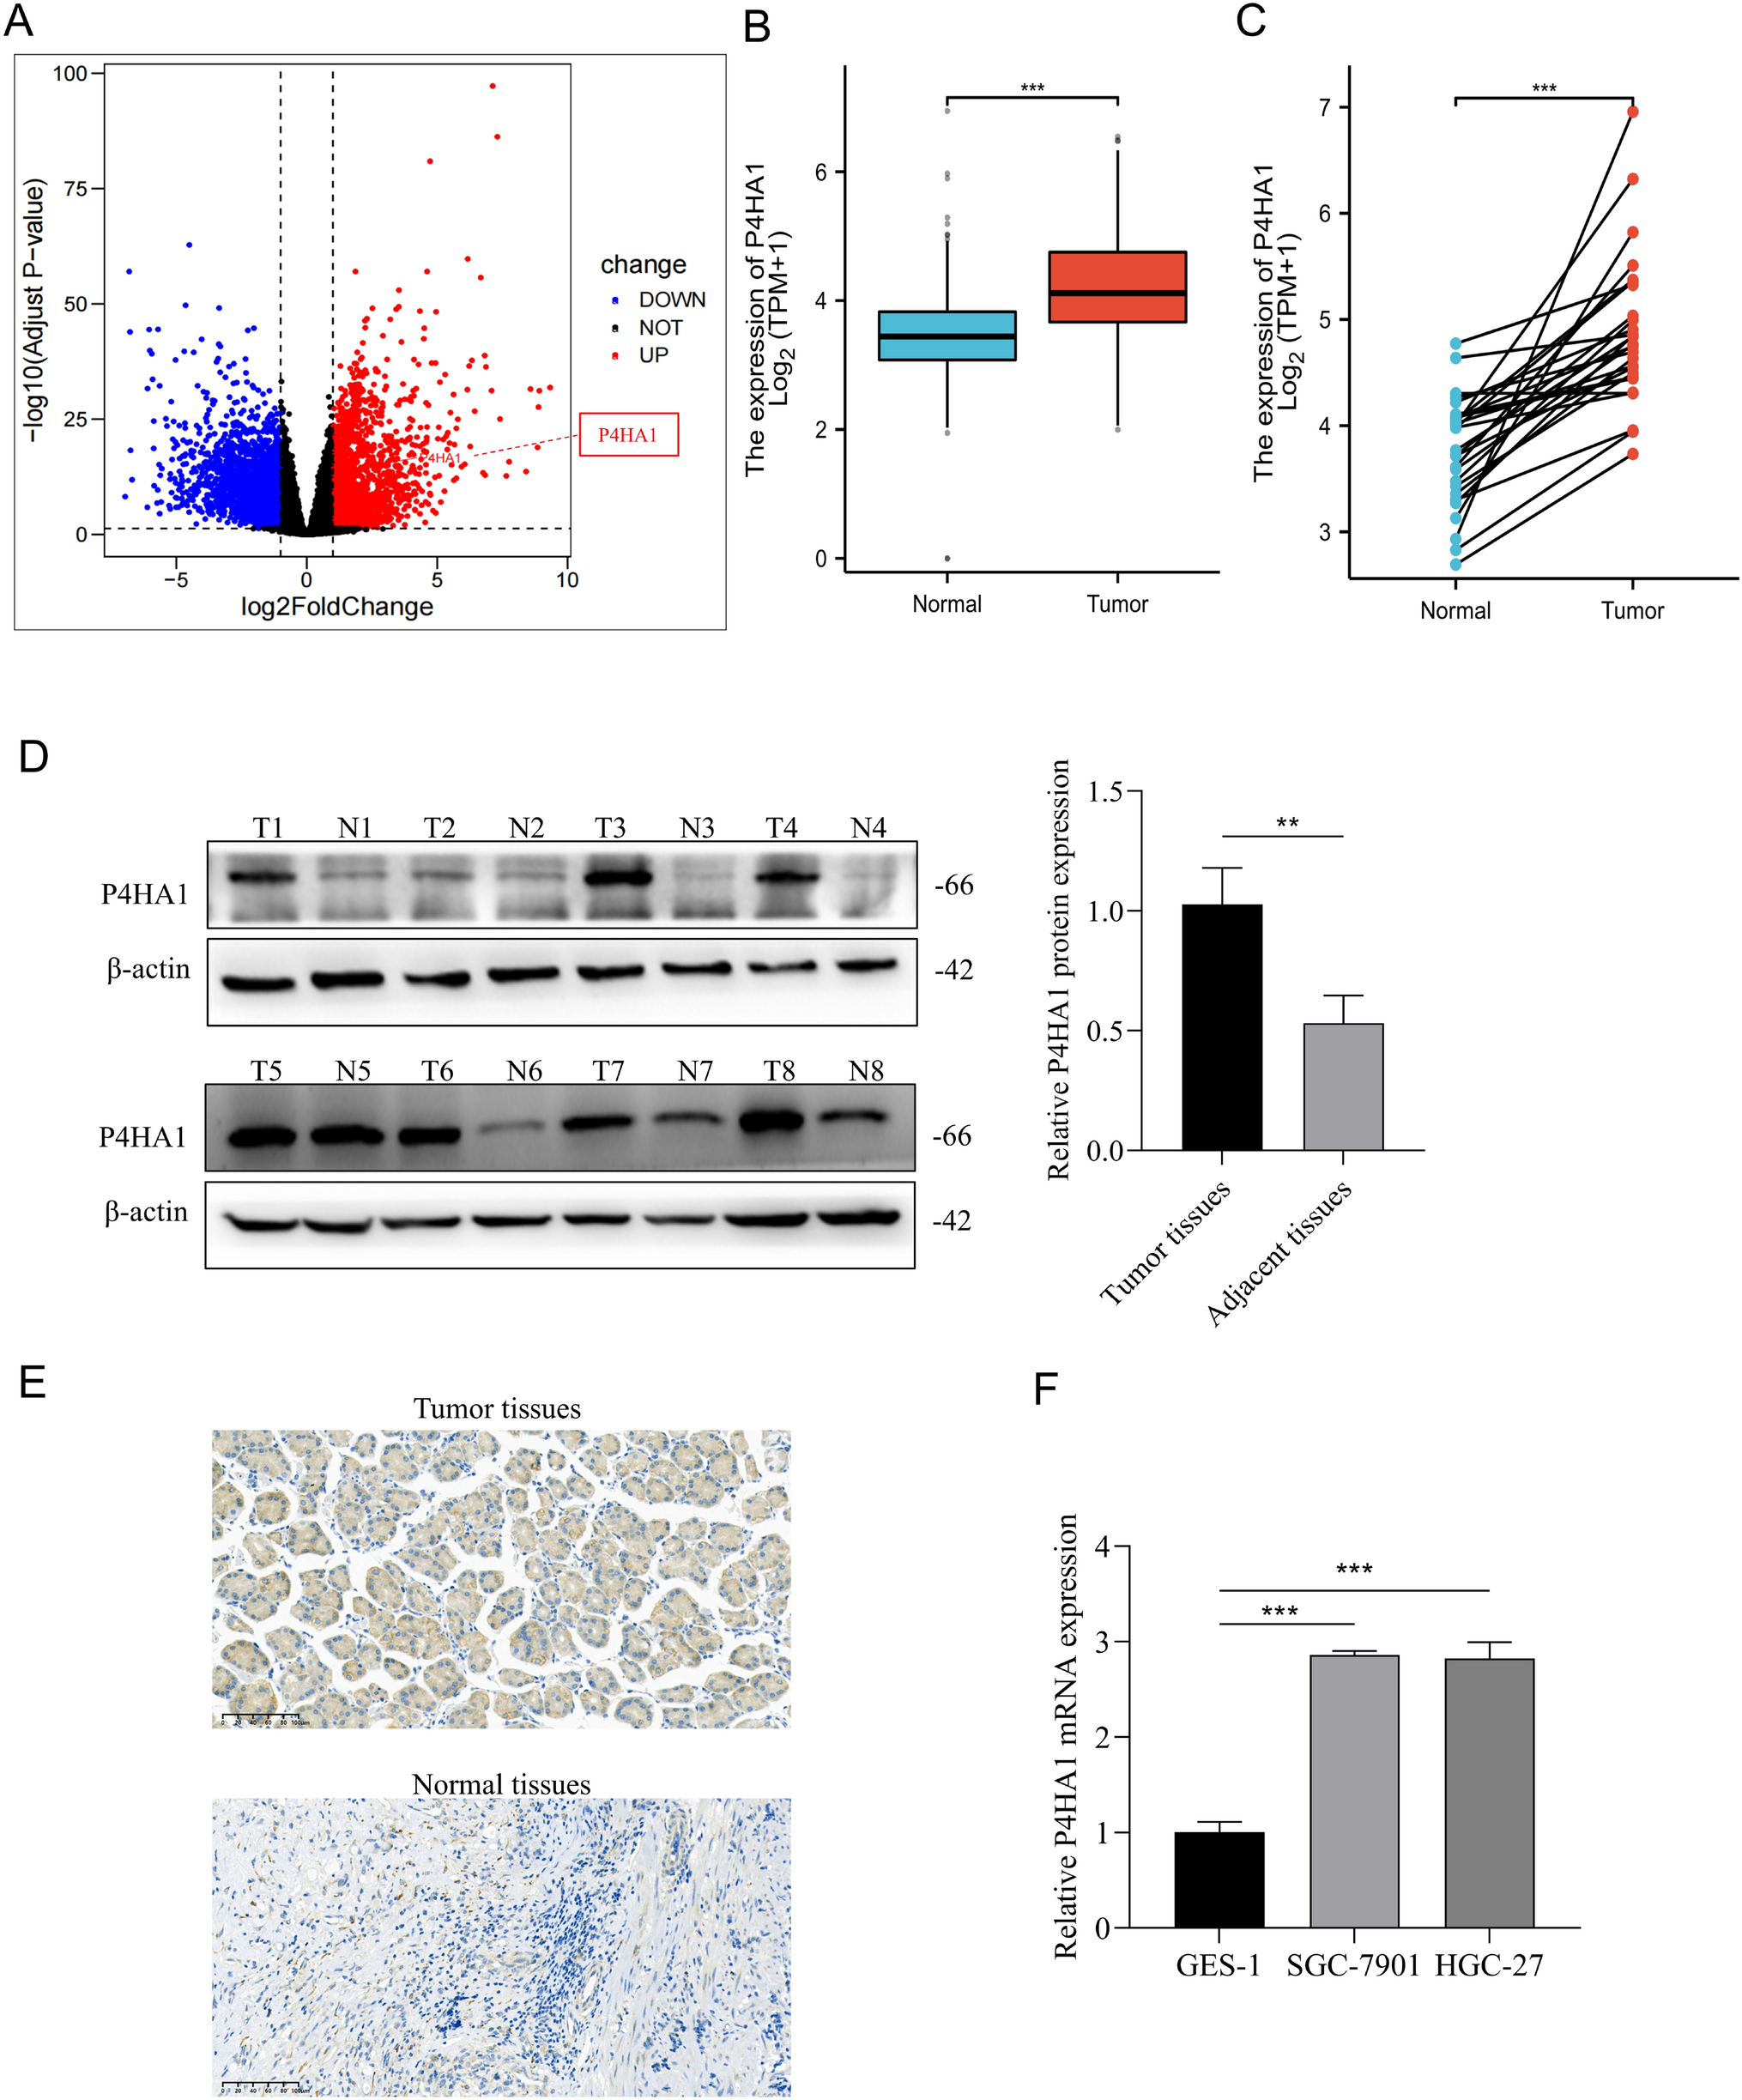
The TCGA database (https://portal.gdc.cancer.gov/) is a free website providing cancer genomics databases. The data of RNA-seq was obtained from TCGA-STAD for 410 GC and 36 neighboring normal tissue samples using the R package “TCGAbiolinks” in R (v 4.3.3). “Adjusted p < 0.05 and fold change > 1.0” were defined as the thresholds for the screening of the differential expression of mRNAs. The “DESeq-2” package was used to detect differentially expressed genes (DEGs). All the relevant clinical data was retrieved from TCGA-STAD and used for the OCLR algorithm constructed by Malta et al. [11]. This algorithm was used to determine mRNAsi and evaluate the correlation between P4HA1 and stemness score.
2.4.2 Xiantao academic platform
The expression and prognosis of P4HA1 in GC, as well as the association between the levels of P4HA1 and various clinical characteristics, were analyzed via the Xiantao Academic Platform (https://www.xiantaozi.com), an online platform that can analyze TCGA data online.
2.4.3 Interactive analysis of gene expression profiles
The GEPIA2 database (http://gepia2.cancer-pku.cn) [12] is a free online platform that provides extensive RNA sequencing data for cancer. GEPIA2 was used to evaluate the correlation between P4HA1 and stem cell markers.
2.4.4 Kaplan–Meier plotter database
Kaplan–Meier plotter online database (https://kmplot.com/analysis/) [13] is a website that facilitates gene survival analysis. In this study, survival analysis was conducted to evaluate the levels of P4HA1 in STAD.
2.4.5 Gene set enrichment analysis
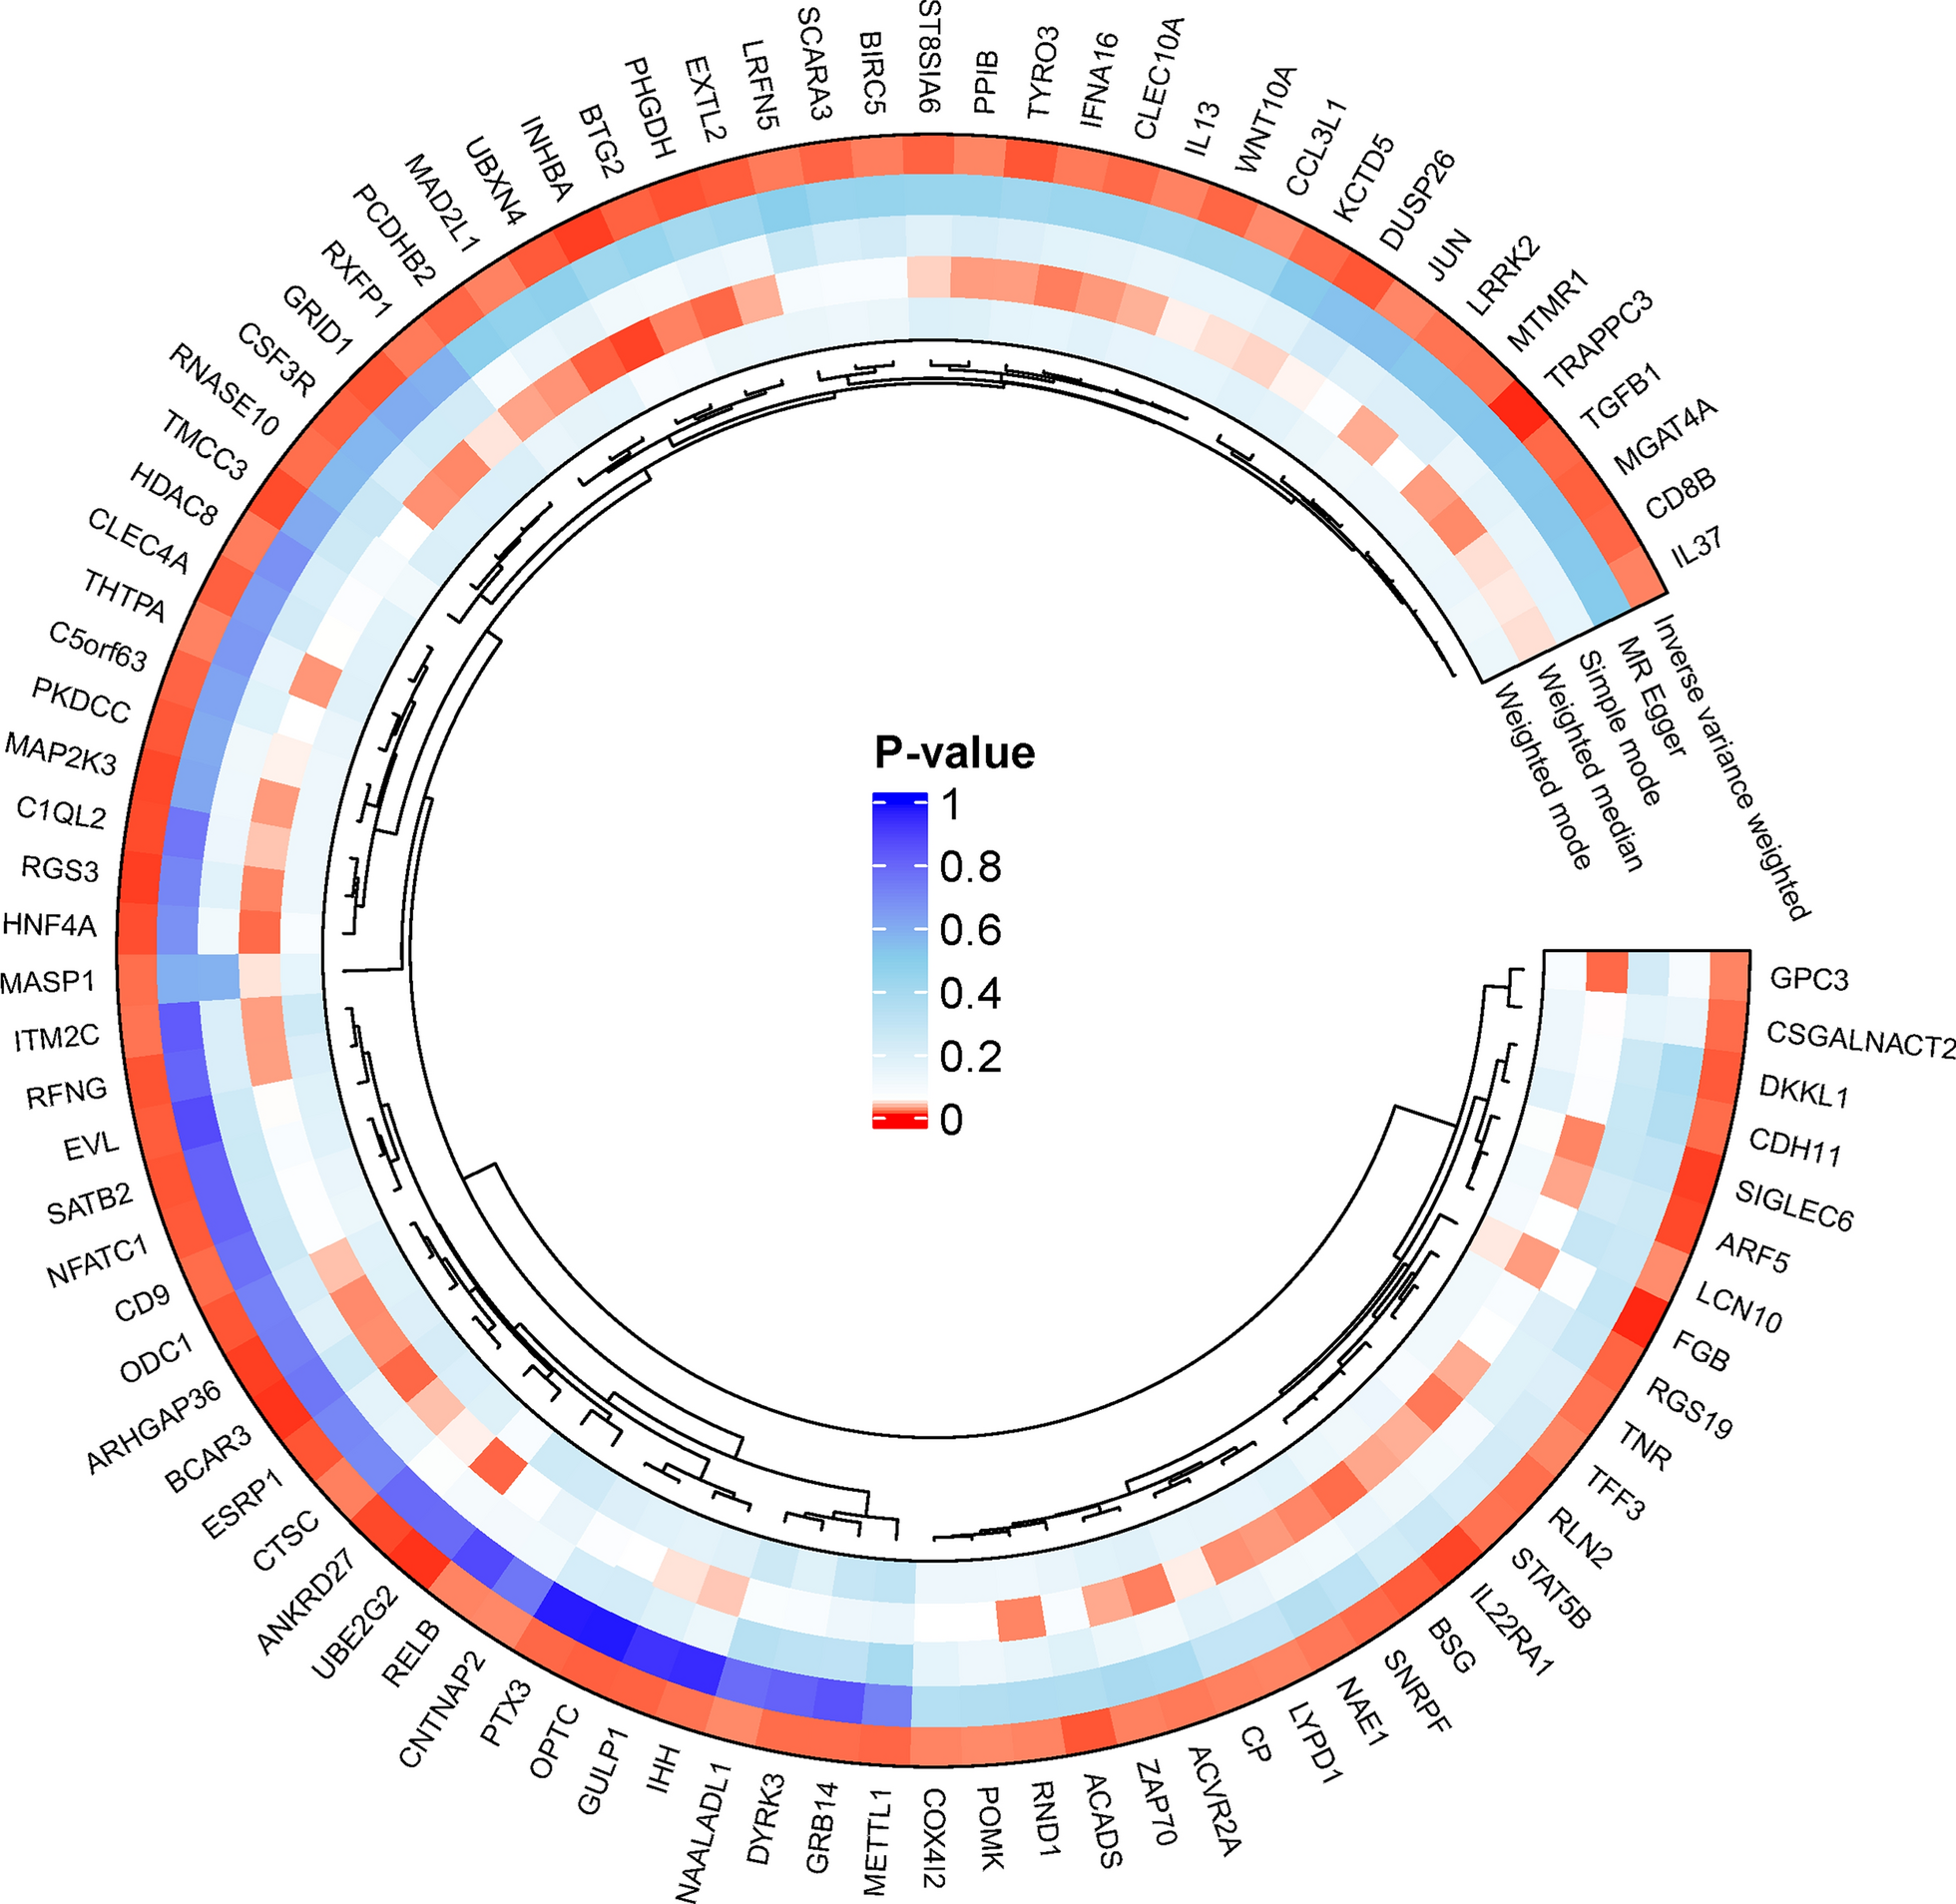
The top 50 genes interacting with P4HA1 were obtained via the String (http://string-db.org) [14] database and the top 50 genes interacting with P4HA1 were extracted via Spearman correlation analysis (|r|≥ 0.5) in the data from the GC of cBioPortal (http://www.cbioportal.org/) [15]. Intersect the genes obtained from the String database with the cBioPortal database to obtain the intersected genes, and the cBioPortal database was used to conduct a correlation analysis of P4HA1 with the overlapped genes. A heatmap of the correlation between P4HA1 and the overlapped genes in pan-cancer was examined in the TIMER2.0 database (http://timer.cistrome.org/) [16]. The DAVID website (https://david.ncifcrf.gov/summary.jsp) [17] was used to integrate 100 genes, remove duplicate genes, and conduct gene ontology (GO) and Kyoto Encyclopedia of Genes (KEGG) pathway analyses.
2.5 Transfection
Cells (HGC-27 and SGC-7901) were transfected with siRNA-P4HA1 synthesized by Gemma Bio Ltd. using a Lip2000 transfection reagent. Experiments were grouped into si-NC and si-P4HA1, with the following interference sequences.
si-NC (F):5′-UUCUCCGAACGUGUCACGUTT-3′, si-NC(R):5′-ACGUGACACGUUCGGAGAATT-3′. si-P4HA1 (F):5′-GGCCUAUACAGAAGCAGAUTT-3′, si-P4HA1 (R):5′-AUCUGCUUCUGUAUAGGCCTT-3′.
2.6 CCK-8 assay and plate cloning assay for cell proliferation
CCK-8 assay: The cells to be tested were trypsinized and washed with PBS for 3 times, a single cell suspension was prepared and seeded into a 96-well plate, 2 × 10³ cells were counted per well, repeat three times per well, 10 μl of CCK-8 reagent was added at 0, 24, 48 and 72 h, respectively, and the absorbance value OD450 nm was detected after incubation in a CO2 incubator for 4 h. Plate cloning assay: Cells from both groups were enzymatically digested and collected using centrifugation to obtain a single-cell suspension. The cell suspension was seeded into 6-well plates at a density of 2 × 10³/well, with 2 ml culture medium in each well. Cells were regularly observed and the media was changed timely. After two weeks, the cells were placed with 4% paraformaldehyde (PFA) for 15 min fixation, stained with crystal violet for 15 min, and then counted after being rinsed with PBS.
2.7 Transwell assay
Cells were digested by trypsin and resuspended to prepare a single-cell suspension. The upper chamber of the Transwell was filled with 200 μl of basal medium with 2 × 10⁴ cells/well, while the lower chamber was filled with 750 μl of FBS-containing medium. For the invasion test, matrix gel was added to the upper chamber and then washed with PBS. After that, 4% PFA was used to fix the cells that passed through the upper chamber. They were stained with crystal violet for 15 min and then counted under the inverted microscope after the chambers had dried.
2.8 Pelleting experiment
Cells were trypsinized, counted, and then cultured in ultra-low adsorption 6-well plates. Approximately 2 × 10³ cells/well were added with FBS-free suspension culture medium. The size and number of cell spheres were observed and counted after 7 days. The serum-free medium comprised DMEM/F12 basal medium with B27 (10 µl/ml), EGF (20 ng/ml), bFGF (10 ng/ml), 2 ml of the growth medium/well, and 1 ml of rehydration solution. The cells were observed to aggregate into spheres within 2–3 days.
2.9 Gene expression analysis via RT-qPCR
The total content of RNA was isolated from the FastPure Cell/Tissue Total RNA Isolation Kit (Vazyme, Nanjing, China) and reverse transcribed to cDNA. A total of 1 µg of RNA was used for RT-qPCR analysis via the ChamQ Universal SYBR qPCR Master Mix Kit (Vazyme, Nanjing, China). P4HA1-(F):5′-TGATGTGTCTGCAGGAGGAG-3′, P4HA1-(R):5′-CCACGTTCAT-GGAGCCATTT-3′, β-actin-(F):5′-AAGGCTGTGGGCAAGG-3′,β-actin-(R):5′-TGGAGGAGTGGGTGTCG-3′.
PCR amplification was conducted in 20 µl reactions at 95 ℃ for 5 min, followed by 40 cycles of 95 ℃ (10 s), 60 ℃ (30 s), 95 ℃ (15 s), 60 ℃ (60 s), and 95 ℃ (15 s) on a LightCycler 96 real-time PCR System (Roche, Basel, Switzerland). The readings were calculated via the 2−△△CT method.
2.10 Western blotting
The tissues and cells were trypsinized and disrupted using a lysis buffer (RIPA: PMSF = 100: 1) on ice. The suspension was shaken every 10 min thrice. The content of protein was measured via the BCA quantification method. Protein mixtures were then run in SDS-PAGE and then transferred onto a PVDF membrane. The membrane was kept with milk for 1 h blocking at 25 ℃ and then kept with phosphorylated antibody BSA, followed by primary antibodies P4HA1, E-cadherin, N-cadherin, Vimentin, CD44, β-actin (1:2000) for 24 h at 4 ℃ at shaking condition. The next day, the membrane was kept with a secondary antibody at 25 ℃ for 2 h and washed thrice with TBST. Finally, the membrane was activated using ECL, and the protein bands were visualized.
2.11 Statistical analysis
Data were statistically analyzed and processed via Excel, Image J, and GraphPad Prism 8 software. Each experiment was repeated thrice. The independent samples t-test was used to examine the variations between 2 groups. To analyze comparisons between multiple groups, a one-way ANOVA was used, with a significance criteria of p < 0.05.


Comments (0)