2.1 Tissue microarray chip and cell culture
A human tissue microarray chip including 130 cases of MM tissues and 18 normal tissues was offered by Xi’an Elena Biotechnology Co., Ltd. (Xi’an, Shanxi, China). A375 and SK-MEL-28 cell lines were cultured in RPMI-1640 medium and DMEM medium, respectively, with 10% fetal bovine serum. They were cultured in a humidified cell culture incubator at 37 °C under 5% CO2. The subculturing medium renewal is recommended to be done 2 to 3 times per week. For cryopreservation, a mixture of 95% FBS and 5% (Dimethyl sulfoxide) DMSO is used.
2.2 ZNF280A immunohistochemistry (IHC) assay
The slides underwent a standard deparaffinization process, beginning with a thorough dewaxing in xylene, followed by a graded series of ethanol solutions to facilitate dehydration. EDTA was added in boiling water for 30 min for antigen retrieval. Then the slides were washed in PBS with 0.1% Tween 20 and blocked with 3% H2O2 for 5 min. Primary antibodies specific to ZNF280A were added for incubating at 4 °C overnight. Then goat anti-rabbit IgG was added and incubated for 2 h at 37 °C. All slides were washed and stained with dye solution for 5 min protected from light, then all slices were counterstained with hematoxylin. Slides were pictured with microscopic 200× and 400× objectives. Staining percentage scores were classified as 1 (1%–24%), 2 (25%–49%), 3 (50%–74%), and 4 (75%–100%). Staining intensity was scored as 0 (Signalless color), 1 (light yellow), 2 (brown), and 3 (dark brown). IHC score was identified as intensity × percentage. Thus, the IHC score of every tissue was calculated. Based on the IHC score, all tissues were classified as a high-expression group and low low-expression group. The same antibody was used in the Western blot analysis.
2.3 Plasmid construction and transfection
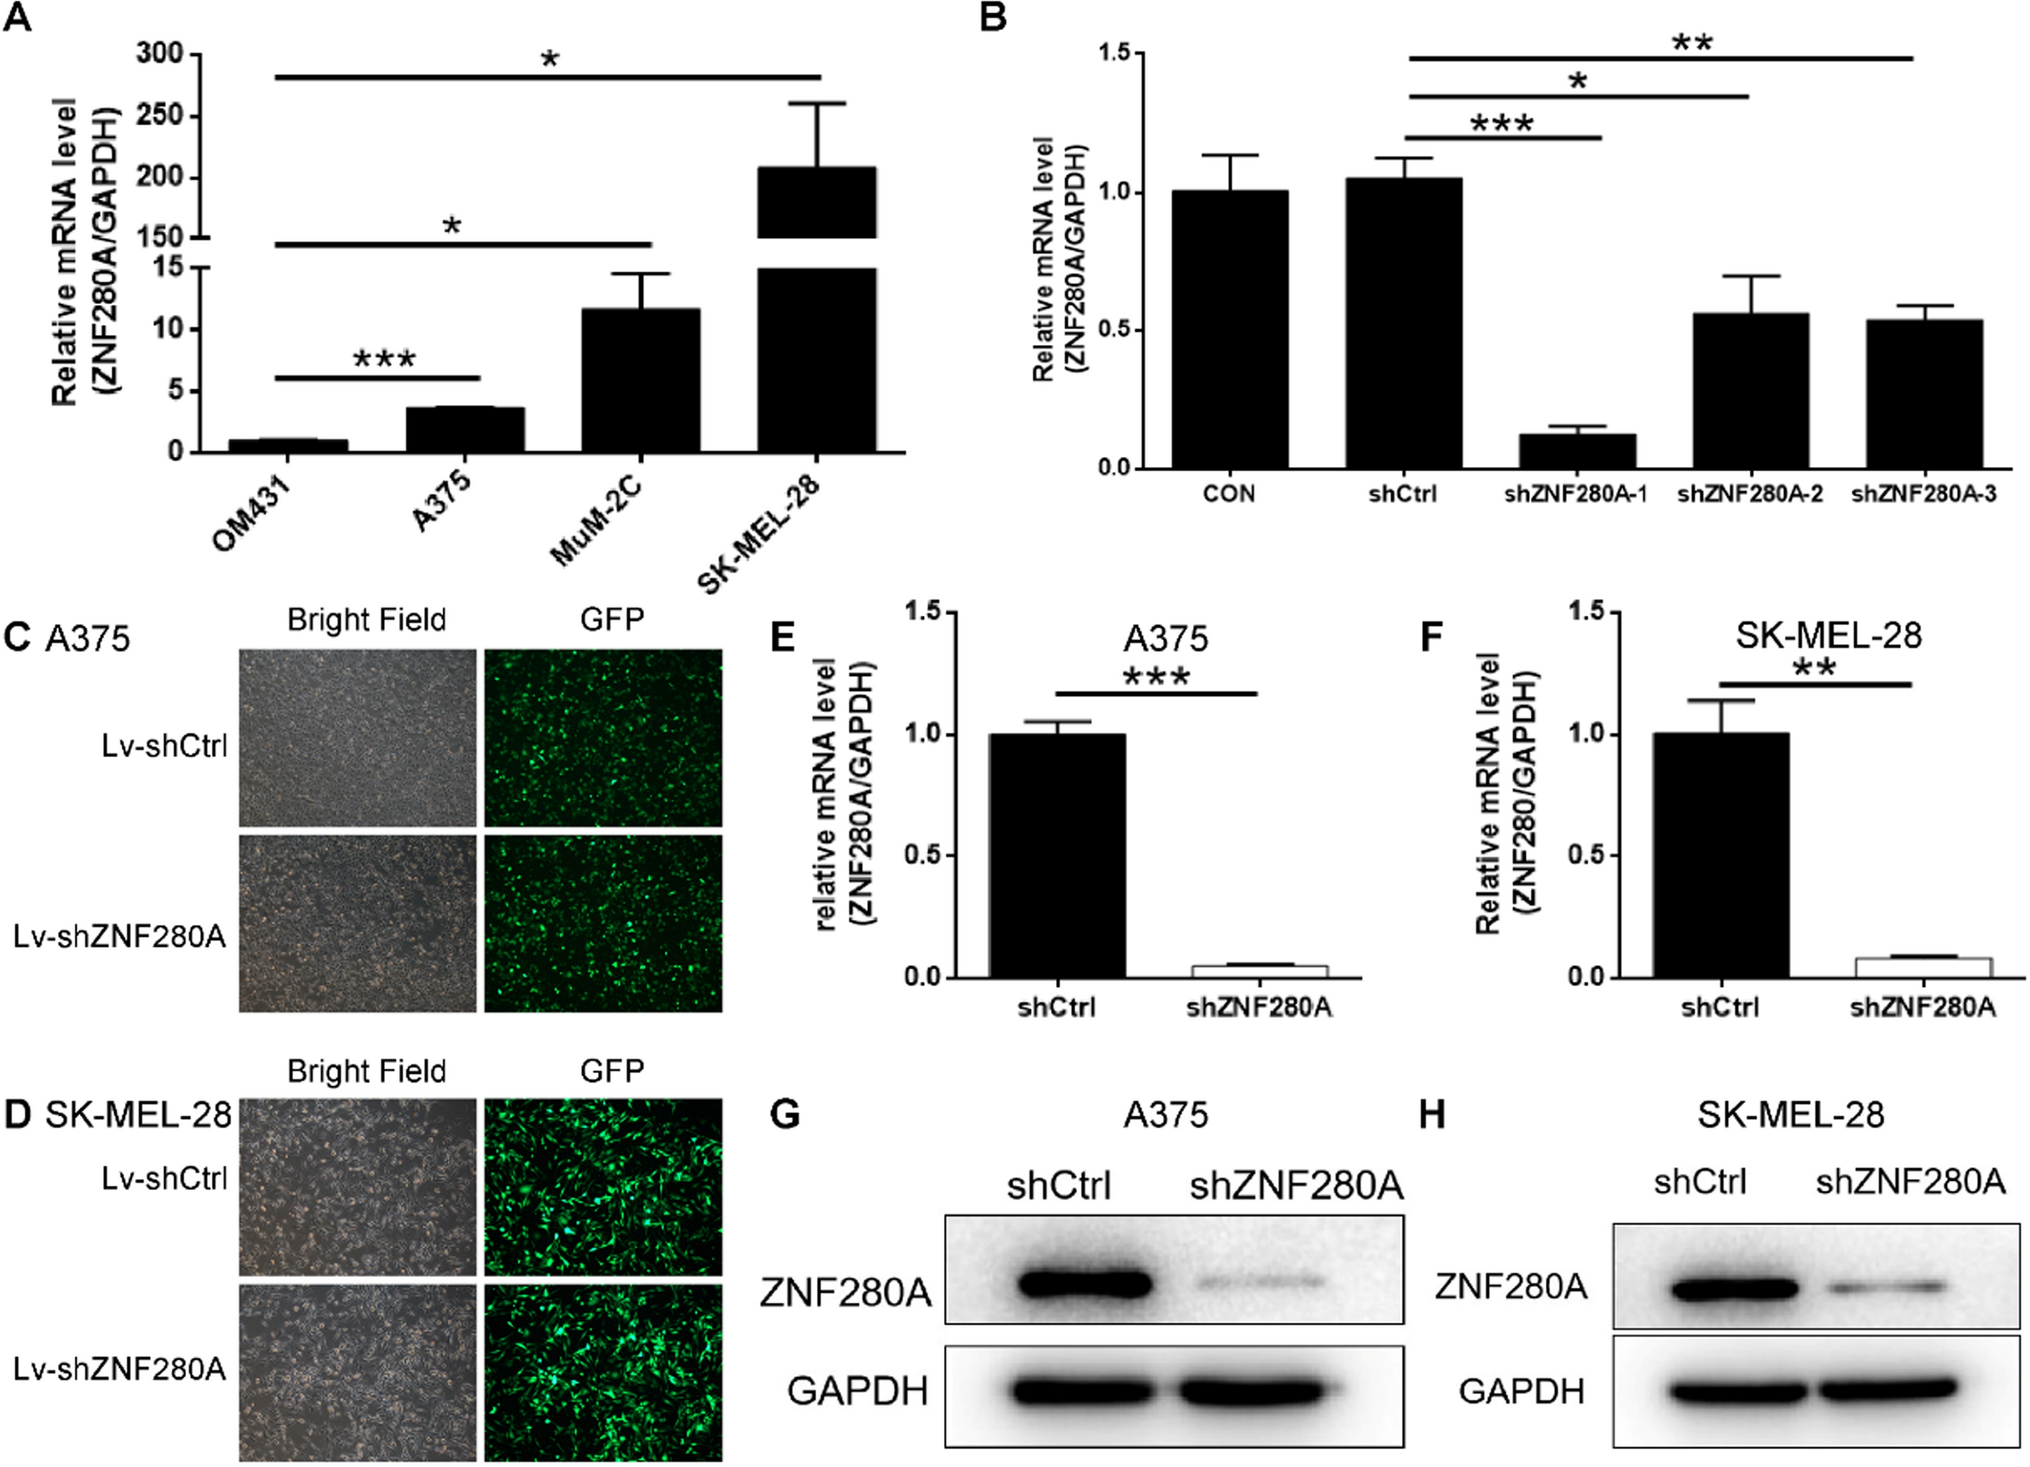
Three small hairpin RNAs (shRNA) of ZNF280A were synthesized (5ʹ-CTGTCACTATGAAGTCTTCAT-3ʹ, 5ʹ-TTGTGTAAGAAAGTGGAATCA-3ʹ, 5ʹ-GCCGGAGCAACTGCAAGGGTT-3ʹ) and cloned into BR-V108 vector. Plasmids containing GFP as the reporter were collected and transfected into 293 T cells to package lentivirus. A375 and SK-MEL-28 cells were infected with the packaged lentivirus (1 × 10⁸ transduction units (TU)/mL) with ENI.S (10 μg/mL) and Polyene additives (1×) in a 6-well plate (Shanghai Genechem Co., Ltd). After being cultured for 72 h in a cell culture medium, fluorescence and cell infection efficiency were observed and valued by microscopic.
2.4 RNA extraction and RT-PCR analysis
Infected cells were fully lysed with Trizol (Sigma, St Louis, MO, USA). The concentration and quality of extracted RNA were determined by Nanodrop 2000/2000C Spectrophotometer (Thermo Fisher Scientific, Waltham, MA, USA). Total RNA was converted to cDNA with ReverAid First Strand cDNA kit (Thermo Fisher Scientific, Waltham, MA, USA). qPCR was performed with SYBR Green master mix Kit (Vazyme) by applying Biosystems 7500 Sequence Detection system. Glyceraldehyde 3-phosphate dehydrogenase (GAPDH) was used as the inner control. Primer sequences were as follows: GAPDH, forward: TGACTTCAACAGCGACACCCA, and reverse: CACCCTGTTGCTGTAGCCAAA; ZNF280A, forward: GATCTGATCTATGTTGGGGTGGA, and reverse: CGTGAGCAGGATATTGACGGA (Table S1). The relative quantitative analysis in gene expression data was analyzed by the 2−ΔΔCt method.
2.5 Phospho-kinase antibody array and western blotting
To perform a phospho-kinase antibody array experiment (Human Phospho-Kinase Array Kit, # ARY003C, R&D Systems, Inc. USA), cell lysates were stored at − 80 °C in a Cell Lysis Buffer. For each cell lysate, 200 μg of total protein was diluted 1:5 with blocking buffer and incubated at 4 °C overnight. The antibody array membranes were washed and subsequently incubated with the antibody overnight at 4 °C to detect phosphorylated levels on activated receptors. The membranes were visualized using a chemiluminescence-based detection method after wash. For western blotting, cells were collected and washed with PBS and lysed in ice-cold lysis buffers. Total protein concentrations were determined by the BCA Protein Assay Kit (HyClone-Pierce, Logan, UT, USA). Proteins (20 μg per lane) were separated by electrophoresis on a 10% SDS-PAGE gel and transferred to nitrocellulose membranes. The membranes were blocked with TBST solution containing 5% skimmed milk for 1 h. Primary antibodies were added and incubated at 4 °C overnight. Then the membranes were incubated with secondary antibodies at room temperature for 1 h. Immobilon Western Chemiluminescent HRP Substrate kit was used for staining (Millipore, Schwalbach, Germany). GAPDH served as the internal standard and the blot bands were visualized with an enhanced chemiluminescence (ECL) (Amersham, Chicago, IL, USA) system. Primary and secondary antibody information are shown in Tables S2 and S3. Originated images were displayed in Figures S4–S12.
2.6 Cell proliferation, migration, and invasion analysis
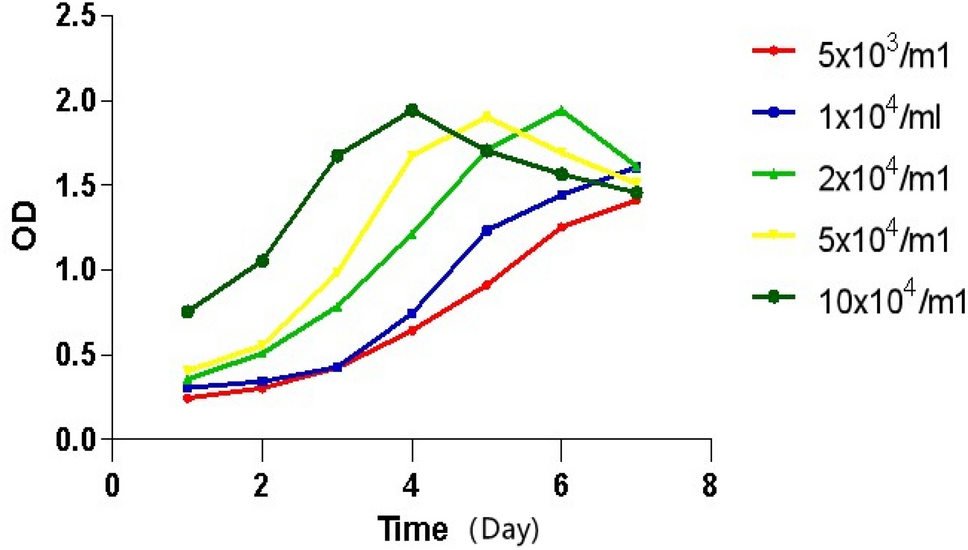
ShCtrl and shZNF280A of A375 and SK-MEL-28 cells were cultured for 48 h. 20 μL MTT cell solution was added (5 mg/mL) to each well and stained for 4 h, cell proliferation was determined with an MTT assay. The outcomes were measured at 570 nm using a microplate reader (BioTek, Winooski, VT, USA).
A375 and SK-MEL-28 cells, infected and adjusted to a density of 5 × 10⁴ cells per well, were seeded into 96-well plates for subsequent culturing. Wounding was induced using a wounding replicator from VP Scientific. At designated time points of 0 h and 24 h post-wounding, photographs of the cells were captured using a fluorescence microscope. Originated images are displayed in Figure S3. The positions of the cells were documented at each time interval. Based on these observations, the migration rates for each cell group were determined and calculated.
Infected A375 and SK-MEL-28 cells were incubated in the upper chamber with 100 μL medium without FBS (5 × 10⁴ cells/well). 600 μL medium supplemented with 10% FBS was added into the lower chamber. Cells were incubated for 24 h at 37 °C. Finally, lower chamber cells were fixed with 4% formaldehyde and stained by Giemsa, and the migration ability of cells was analyzed.
2.7 Cell apoptosis and cell cycle analysis
The flow cytometric methods of identifying apoptotic cells were employed by Annexin V-APC Apoptosis kit (Cat. #88-8007, eBioscience). For the cell cycle assay, cells were stained with 1 mL propidium iodide (PI) staining solution. FlowJo V10 (Ashland) was used for analysis. Cell apoptosis and the percentage of the cells in the G0–G1, S, and G2-M phases were measured and compared.
2.8 Nude mice xenograft tumor studies
All animal studies were approved by the Ethics Committee of Guangxi Medical School. 4 week-BALB/c nude male mice were obtained from Shanghai Lingchang Laboratory Animal Co., Ltd. (Shanghai, China). Infected shCtrl or shZNF280A A375 cells were suspended at a destiny of 2 × 10⁷ cells/mL and 0.2 mL suspension was subcutaneously injected into each nude mouse. Tumor volumes (V) were measured every two days and calculated using W and L (W means width at the widest point of tumor; L means perpendicular width, V = 3.14/6 × L × W2). In-vivo bioluminescence was applied Lumina LT Xenogen VivoVision IVIS 100 system (Perkin Elmer, Waltham, MA, USA) after mice were anesthetized. Luminescence was used to detect the tumor growth and intraperitoneal injection of d-Luciferin (15 mg/mL) at a dose of 10 uL/g in luciferase luminescence detection. Finally, mice were sacrificed by cervical dislocation and the tumor tissues were collected.
2.9 Ki67 IHC assay
The tumor tissues were fixed in 10% formalin and embedded in paraffin. After the slides were blocked in 3% PBS-H2O2, anti-Ki-67 (Tables S4, S5) was added and incubated at 4 °C overnight. Then the slides were washed with PBS and incubated with goat anti-rabbit IgG HRP. Moreover, the slides were stained by hematoxylin and Eosin (Baso, Zhuhai, Guangdong, China).
2.10 Statistical analyses
All data are expressed as the mean ± SD. Student’s T-Test was used to analyze the statistical significance. The relationship between ZNF280A expression and tumor characteristics in MM patients was determined by Mann–Whitney U analysis and Spearman Rank correlation analysis. All analysis above was performed on SPSS 23 (IBM, SPSS, Chicago, IL, USA) and graphs were drawn with GraphPad Prism 9.0 (GraphPad Software, La Jolla, CA, USA). P < 0.05 was considered statistically significant.


Comments (0)