
Remember me
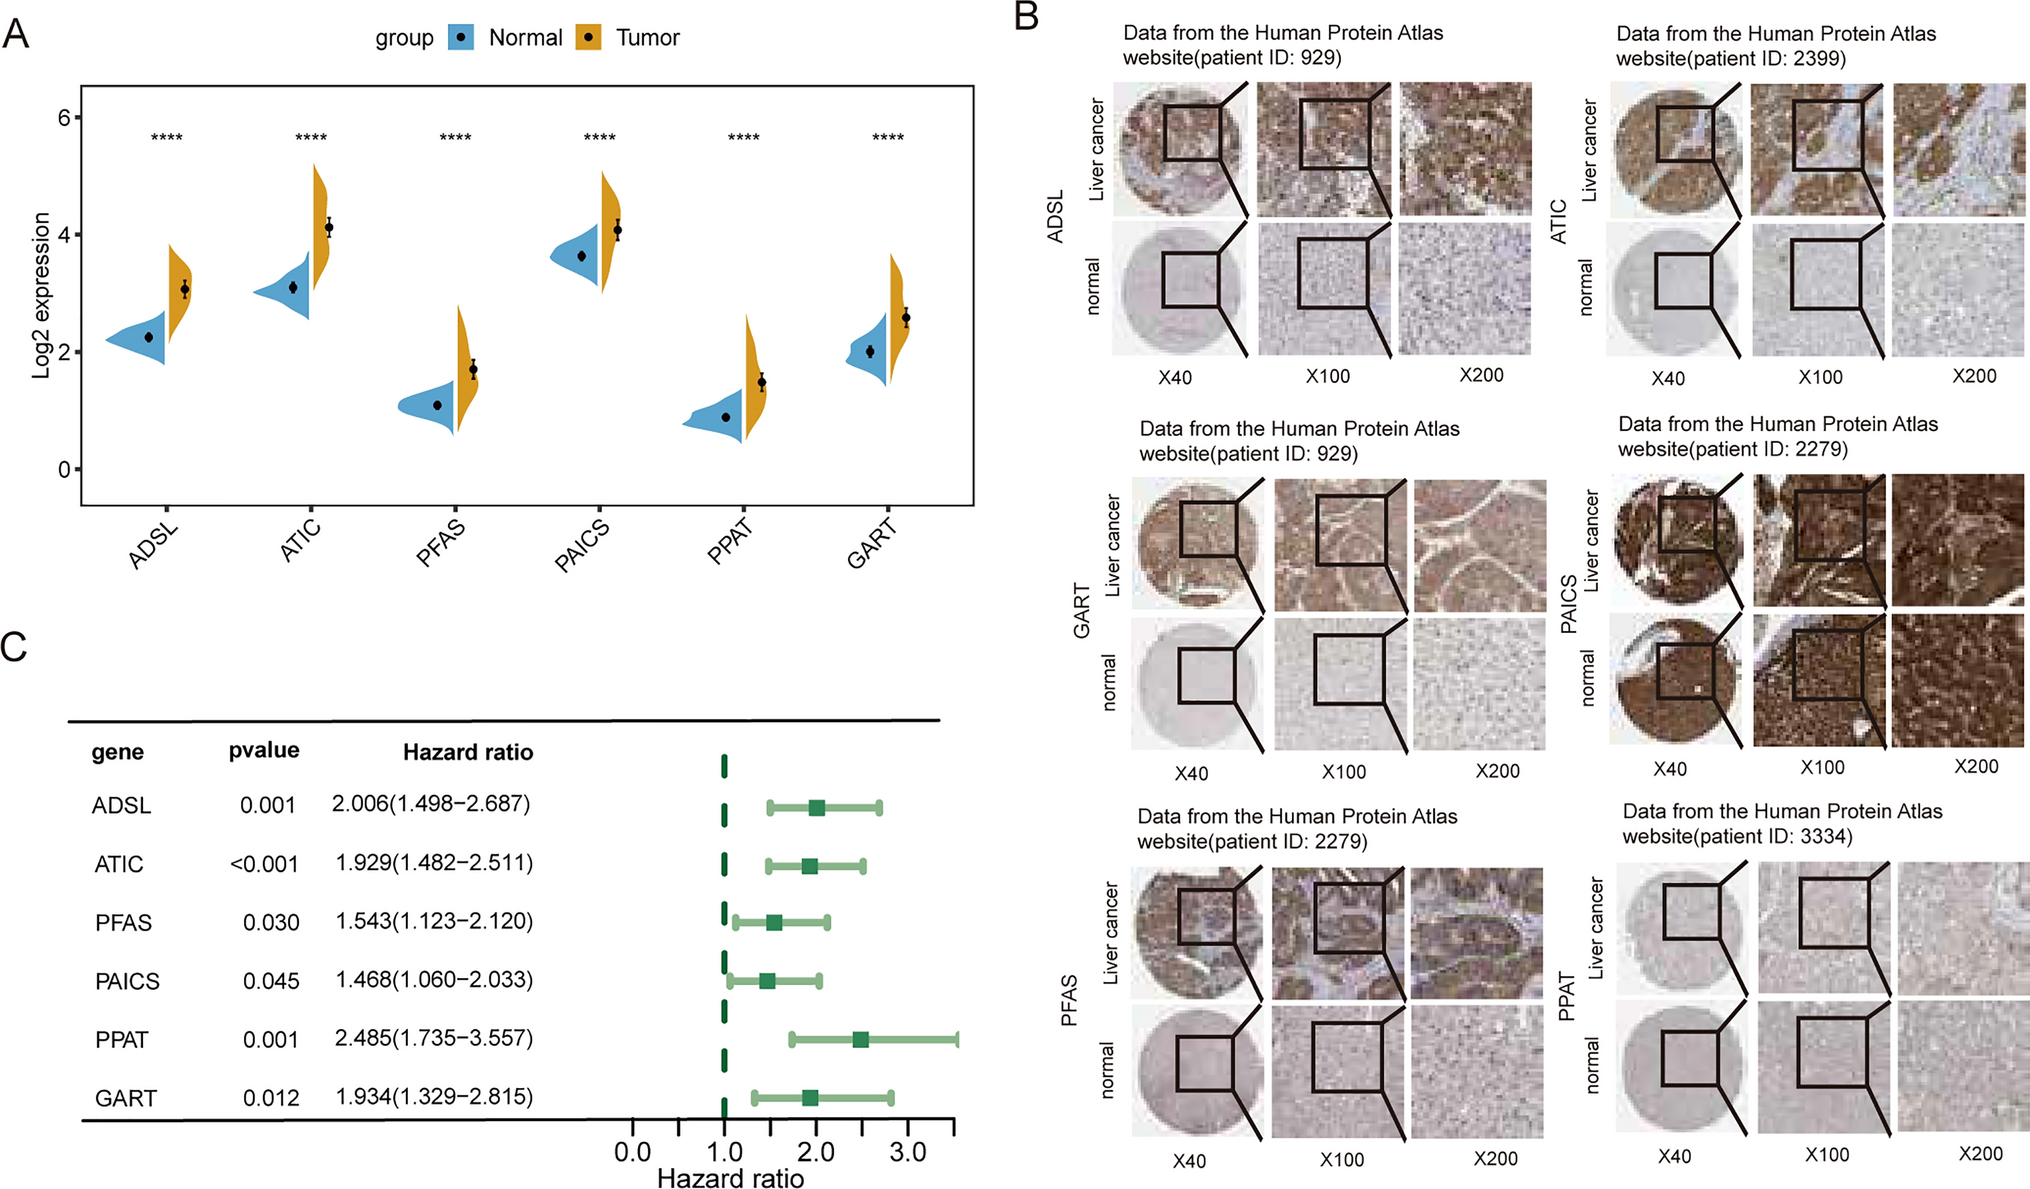


The establishment of purinosomes has been recognized as a pivotal and dynamic assembly in the pathway of de novo purine synthesis. To explore the transcriptional activity of genes associated with de novo purine biosynthesis, we initially conducted a comparative analysis of mRNA expression levels of six essential enzymatic genes implicated in purinosome formation (ADSL, ATIC, PFAS, PAICS, PPAT, and GART) between hepatic cancer tissues and their respective healthy counterparts. Figure 1A illustrates the significantly elevated mRNA levels of the six purinosome-related genes in tumor tissues compared to normal tissues. Furthermore, immunohistochemistry data obtained from the Human Protein Atlas (HPA) website (Fig. 1B) indicated an upregulation of protein expression of these components in the majority of liver cancer tissues. To assess the prognostic significance of these genes, we conducted additional analysis using The Cancer Genome Atlas (TCGA) dataset. Univariate Cox regression analysis and log-rank test are often complementary in survival analysis and can be used together to gain a more comprehensive understanding of the impact of purinosome-related genes on prognosis.Significantly, univariate Cox regression analysis revealed a notable correlation between elevated mRNA expression of the six genes and unfavorable outcomes in the LIHC cohort (Fig. 1C). Additionally, in the log-rank test, five of the six purinosome-related genes were identified as significant risk factors for individuals with liver cancer (Supplementary Fig. 1). These findings strongly indicate that augmented de novo purine biosynthesis is crucial in facilitating the proliferation and advancement of human liver cancer.
Fig. 1
The landscape and the prognostics value of six purinosome-related genes. A The mRNA expression levels of ADSL, ATIC, PFAS, PAICS, PPAT, and GART in liver tumor tissue compared to their corresponding normal tissue. B The protein levels of the six purinosome-related genes in liver cancer tissues were determined using immunostaining data obtained from The Human Protein Atlas (HPA). C The forest plot displays the Hazard Ratio for patients in the liver hepatocellular carcinoma (LIHC) cohort from The Cancer Genome Atlas (TCGA), indicating the association between the expression of the six genes and patient outcomes. The Hazard Ratio was determined using a unique cox regression model
3.2 Purinosome score as a prognostic factor in cancer patientsIn order to examine the prognostic implications of purinosome-related genes in HCC, we employed the ssGSEA algorithm to compute a purinosome score derived from the mRNA expression levels of the six principal enzymatic genes implicated in purinosome assembly (Fig. 2A). The findings from survival analysis indicate a correlation between higher purinosome scores and poorer patient outcomes (Fig. 2B). The utility of the purinosome score in predicting clinical outcomes was evaluated using ROC curves, yielding AUC values of 0.751, 0.703, and 0.662 for 1-year, 3-year, and 5-year overall survival, as illustrated in Fig. 2C. The prognostic value of the purinosome score was further validated in three independent cohorts, namely GSE14520, GSE10130, and ICGC cohorts, as illustrated in Fig. 2D–F. Furthermore, a multivariate Cox regression analysis was conducted to control for potential confounding clinical variables including OS, DSS, PFI, and DFI, ultimately validating the purinosome score as a standalone prognostic indicator for patients with HCC (Fig. 2G–J). Moreover, the prognostic value of the purinosome score was explored across multiple cancer types. Notably, an increased purinosome score was associated with worse outcomes in uveal melanoma (UVM), kidney renal papillary cell carcinoma (KIRP), mesothelioma (MESO), pancreatic adenocarcinoma (PAAD), sarcomas (SARC), LIHC, skin cutaneous melanoma (SKCM), and lung adenocarcinoma (LUAD), while exhibiting exceptional prognostic value in rectum adenocarcinoma (READ) and thymoma (THYM) (Supplementary Fig. 2). In summary, the purinosome score exhibits significant prognostic potential in various cancer types, including HCC.
Fig. 2
Quantification of the purinosome score and its prognostic value in hepatocellular carcinoma. A Risk distribution of the purinosome score calculated using the ssGSEA algorithm. B Survival analysis demonstrating the prognostic value of the purinosome score in patients with HCC. C ROC curve analysis evaluating the accuracy of the purinosome score in predicting 1-year, 3-year, and 5-year overall survival (OS) in HCC patients. D–F Survival curves illustrating the prognostic significance of the purinosome score in three independent cohorts: GSE14520, GSE10130, and ICGC cohorts. G–J Relationship between purinosome score and clinical outcomes, including OS (G), DSS (H), PFI (I), DFI (J) in a dataset comprising 33 tumors from The Cancer Genome Atlas (TCGA). The forest plot presents the results of multiple Cox regression analysis
3.3 The expression of purinosome-related genes is crucial for cancer cell proliferation.To enhance our comprehension of the impact of abnormal purinosome-related genes on downstream pathways in cancer cells, we stratified the liver cancer patient cohort into two groups according to their purinosome score and examined the variance in gene expression. Following this, we performed a series of enrichment analyses to investigate the potential involvement of purinosome-associated genes in cellular processes. Notably, we observed a substantial enrichment of cell cycle-related entities across various databases, such as GO, KEGG, Reactome, and Biocarta (Fig. 3A–D). To confirm the involvement of purinosome-related genes in liver cancer, we analyzed single-cell RNA sequencing data from GSE125449. Among 9946 cells, we identified six cell types (Fig. 3E), with tumor cells showing significantly higher expression of GART, PAICS, ATIC, and ADSL compared to other cell types (Fig. 3F). This finding was supported by the AUCell method, which allows for the identification of cells with active gene sets (e.g., purinosome) in single-cell RNA-seq data(Fig. 3G), indicating a correlation between high purinosome score and tumor cells. Furthermore, our observations indicated that tumor cells with elevated purinosome scores demonstrated a greater prevalence in the G2 and S phases, which are pivotal stages in DNA synthesis and the onset of mitosis (Fig. 3H). To further explore the regulatory network, genes related to the cell cycle occupy a central position in the PPI network by STRING database (Fig. 3I). Moreover, the clustering of interacting genes is primarily annotated on the cell cycle (Fig. 3J).
Fig. 3
The functional role of purinosome-related genes in the cell cycle. A, B Functional enrichment analysis of differentially expressed genes using Gene Ontology-Biological Process (GO-BP) and Kyoto Encyclopedia of Genes and Genomes (KEGG) pathways conducted with the "clusterprofiler" package. C, D Gene Set Variation Analysis (GSVA) based on Reactome and Biocarta databases. E t-SNE visualization displaying cell types represented by different colors. F Identification of purinosome-related genes in six major cell types investigated in this study. G Mapping of the purinosome score onto the t-SNE map of cell subclusters. H Distribution of G2M score and S score in low-purinosome and high-purinosome socre cell groups. I PPI analysis of differentially expressed genes by using STRING database.The genes related to the cell cycle are marked in red. J Clustering annotation of interacting genes
We confirmed the role of purinosome in the cell cycle by conducting experiments on Huh-7 cells in purine-free and normal medium. qPCR analysis showed increased gene expression of purinosome-related, cell cycle, and proliferation genes over time (Fig. 4A). The results of the correlation analysis indicated a significant relationship between purinosome-related genes, cell cycle progression, and cellular proliferation, as illustrated in Fig. 4B. Additionally, the protein expression of ADSL, a known marker of purinosome activity, was evaluated using immunofluorescent staining. Notably, enhanced fluorescence signals were observed in cells cultured in a purine-free medium at 2 and 3 days, suggesting an increase in purinosome formation (Fig. 4C, D). In order to substantiate the correlation between purinosome and cellular proliferation in vivo, confocal imaging was conducted to observe the co-localization of ADSL and Ki67 (a proliferation marker) as illustrated in Fig. 4E. These results collectively indicate that heightened purinosome levels functionally impact the cell cycle, thereby facilitating the accelerated growth of cancer cells.
Fig. 4
Validation of the role of purinosome in the cell cycle through cell experiments. A mRNA profiles were obtained from Huh-7 cells treated with purine-free medium at different timepoints. The heatmap represents the mRNA expression levels of genes associated with purinosome, cell cycle, and proliferation. B Correlation analysis of these genes using the corplot package. C, D Immunofluorescent staining of Huh-7 cells showing the protein expression of ADSL (visualized in green fluorescence) at 2 and 3 days. E Confocal overview image of a liver cancer tissue section, showing DAPI labeling (blue) to highlight nuclei, and immunostaining with antibodies against ADSL (green) and Ki67 (red)
3.4 Enhancing treatment responses by targeting purinosome formation in HCCThe increased expression of genes related to the purinosome is linked to cancer prognosis and plays a critical role in the regulation of the cell cycle. Therefore, it is imperative to discover efficacious drugs capable of inhibiting the heightened levels of the purinosome score in cancer cells. Utilizing the pRRophetic approach, pyrimethamine was identified as the most effective medication for targeting the purinosome score, displaying a low IC50 value in cancer cells exhibiting a high purinosome score (Fig. 5A–D). To confirm the clinical potential of pyrimethamine, we analyzed data from the GDSC database, which identifies molecular features of cancers that predict response to drugs. Our findings showed a negative relationship between pyrimethamine effectiveness and purinosome-related gene expression in different cancer types, supporting our initial hypotheses (Supplementary Fig. 3). Immunotherapy shows promise for treating HCC. Our analysis found a negative link between the purinosome score and TIDE score in HCC tissue (Fig. 5E). To confirm this discovery, we analyzed the mRNA levels of immune checkpoint genes like CD274, CD276, LGALS9, TNFRSF14, CD40, and CD70, which showed a connection with purinosome-related genes (Fig. 5F). Interestingly, CD276 and TNFRSF14 expression in Huh-7 cells increased gradually over time in a purine-free medium (Fig. 5G, H). Owing to the relatively few cases in the HCC immunotherapy database, an urothelial cancer dataset (IMvigor210) where samples received anti-PD-L1 therapy was selected as the test set. The distribution of purinosome score decreases simultaneously with the different therapeutic effect evaluation indexes, including complete response (CR), partial response (PR), stable disease (SD) and progressive disease (PD) (Fig. 5I). Meanwhile, the purinosome score of patients with CR and PR were much higher than those with PD and SD (Fig. 5J). The high CRRS patients possess a higher percentage of SD/PD, and CR/PR more happened in patients with low CRRS (Fig. 5K). The survival times of patients with low purinosome score were much higher than those with low purinosome score (Fig. 5L).These findings indicate that individuals with elevated purinosome scores may potentially derive therapeutic benefits from pyrimethamine treatment or may experience systemic effects through immunotherapy targeting purinosome formation.
Fig. 5
Prediction of treatment response for chemotherapy and immunotherapy in hepatocellular carcinoma. A Volcano plot displaying the distribution of various drugs in terms of response prediction. B Chemical structure of pyrimethamine, the most sensitive medication for the purinosome score. C, D Correlation analysis and bar plot depicting the relationship between the IC50 of pyrimethamine and the purinosome score. E Correlation plot illustrating the negative correlation between the TIDE score and the purinosome score in HCC tissue. F Heatmap showcasing the mRNA expression levels of immune checkpoint genes and their correlation with purinosome-related genes. G, H Bar plot representing the mRNA expression levels of CD276 and TNFRSF14 in Huh-7 cells cultured in purine-free medium over an increased incubation time. I, J The distribution of purinosome score among response (CR), partial response (PR), stable disease (SD) and progressive disease (PD) in IMvigor210. K Bar graph illustrated the treatment response CR/PR and SD)/PD to immunotherapy in high and low purinosome subtypes. L Kaplan–Meier curve of OS for patients with high and low purinosome subtypes for IMvigor210
Comments (0)