
Remember me

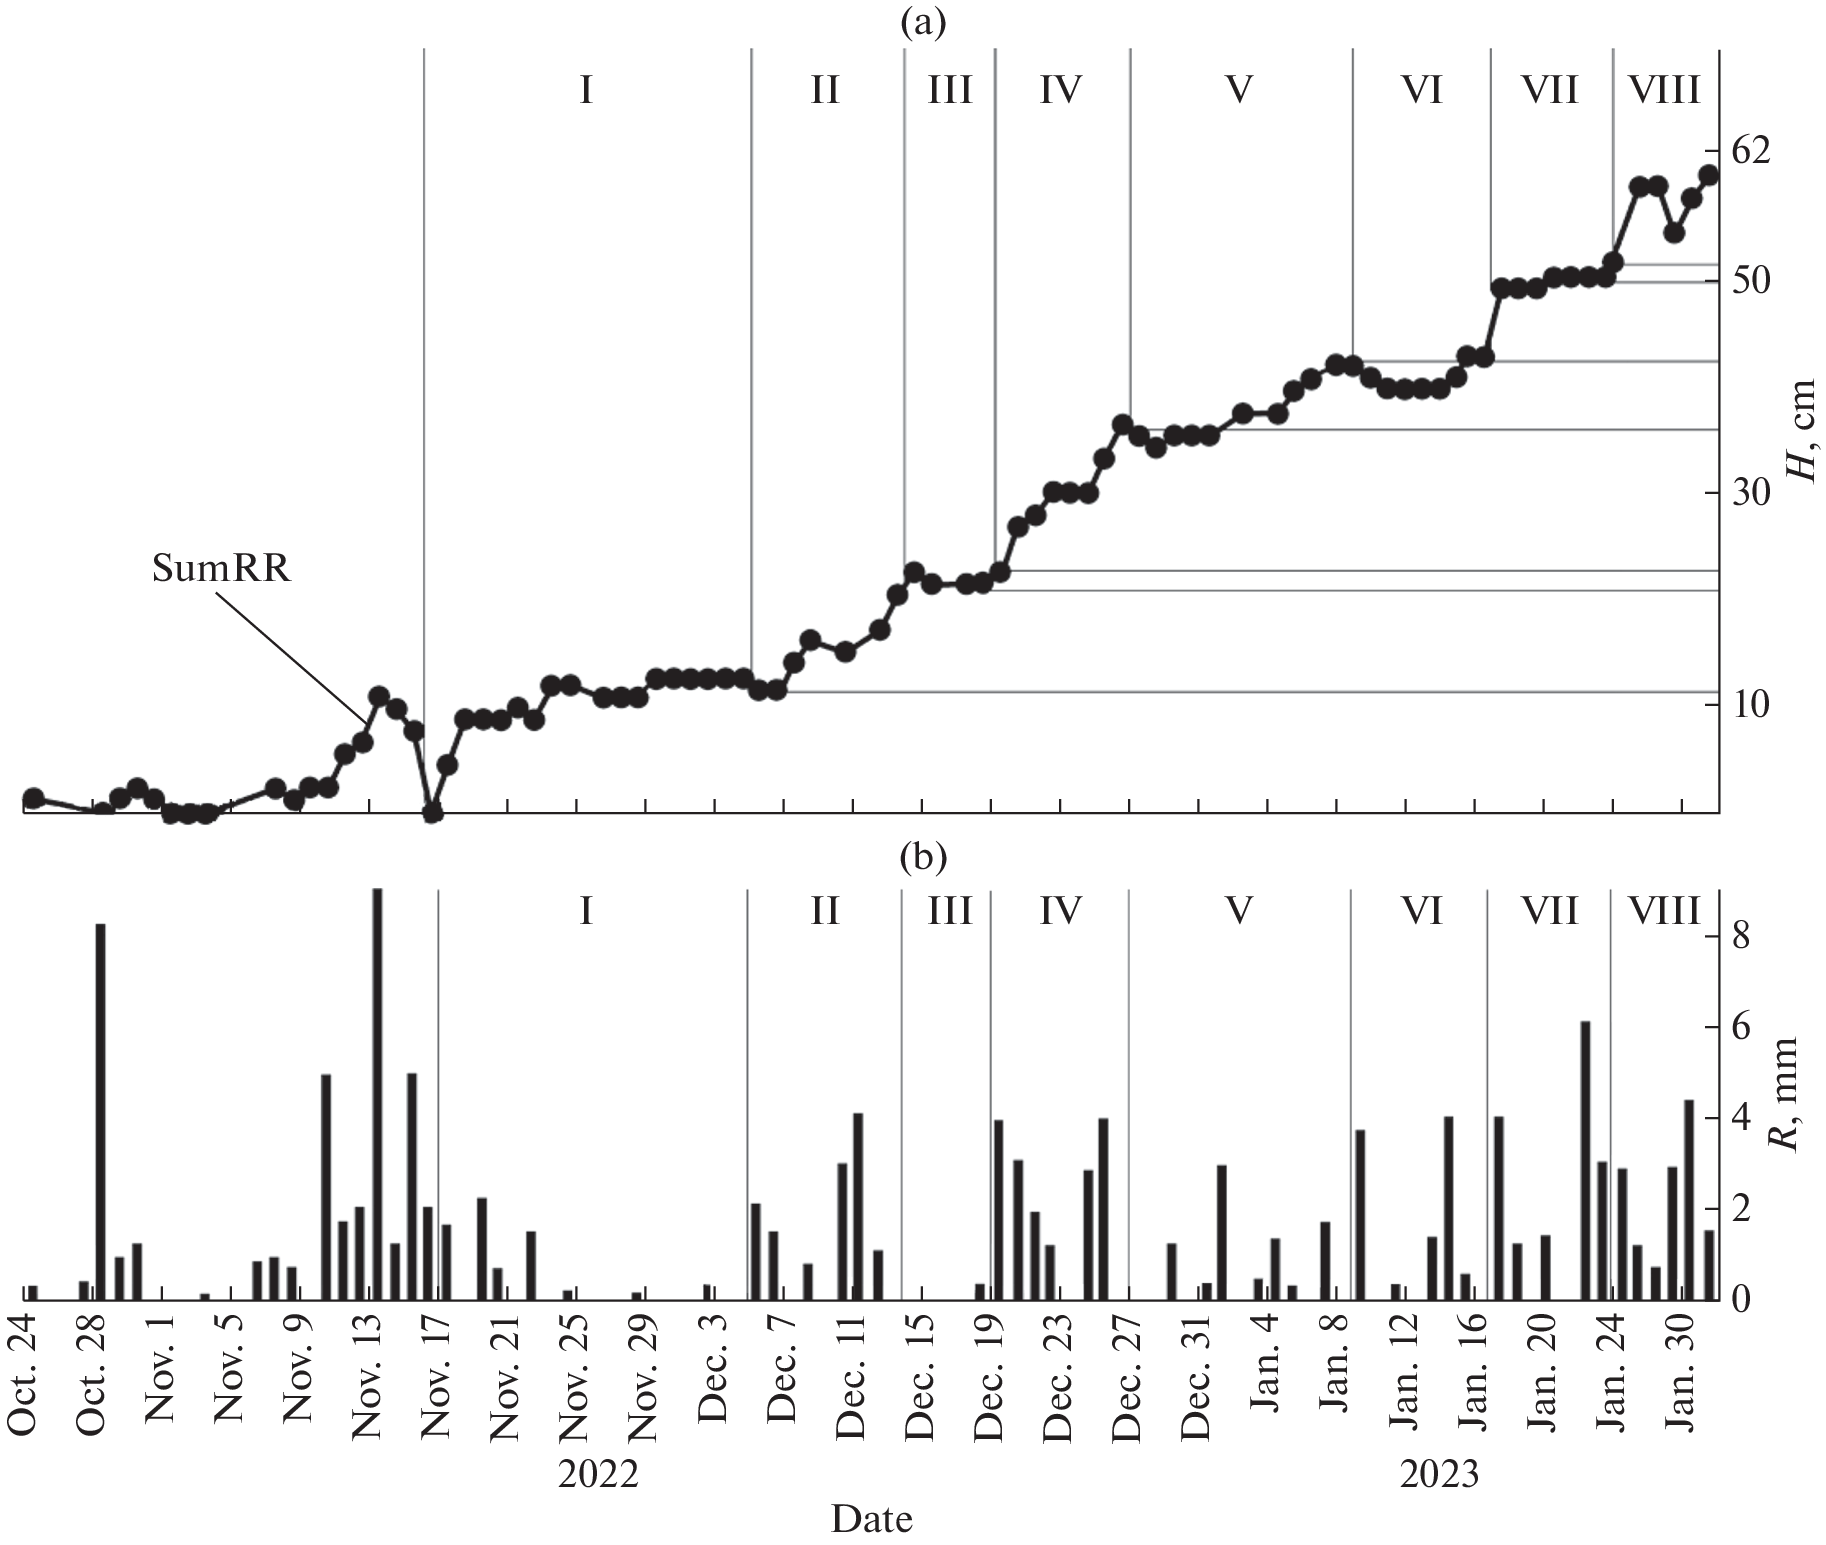
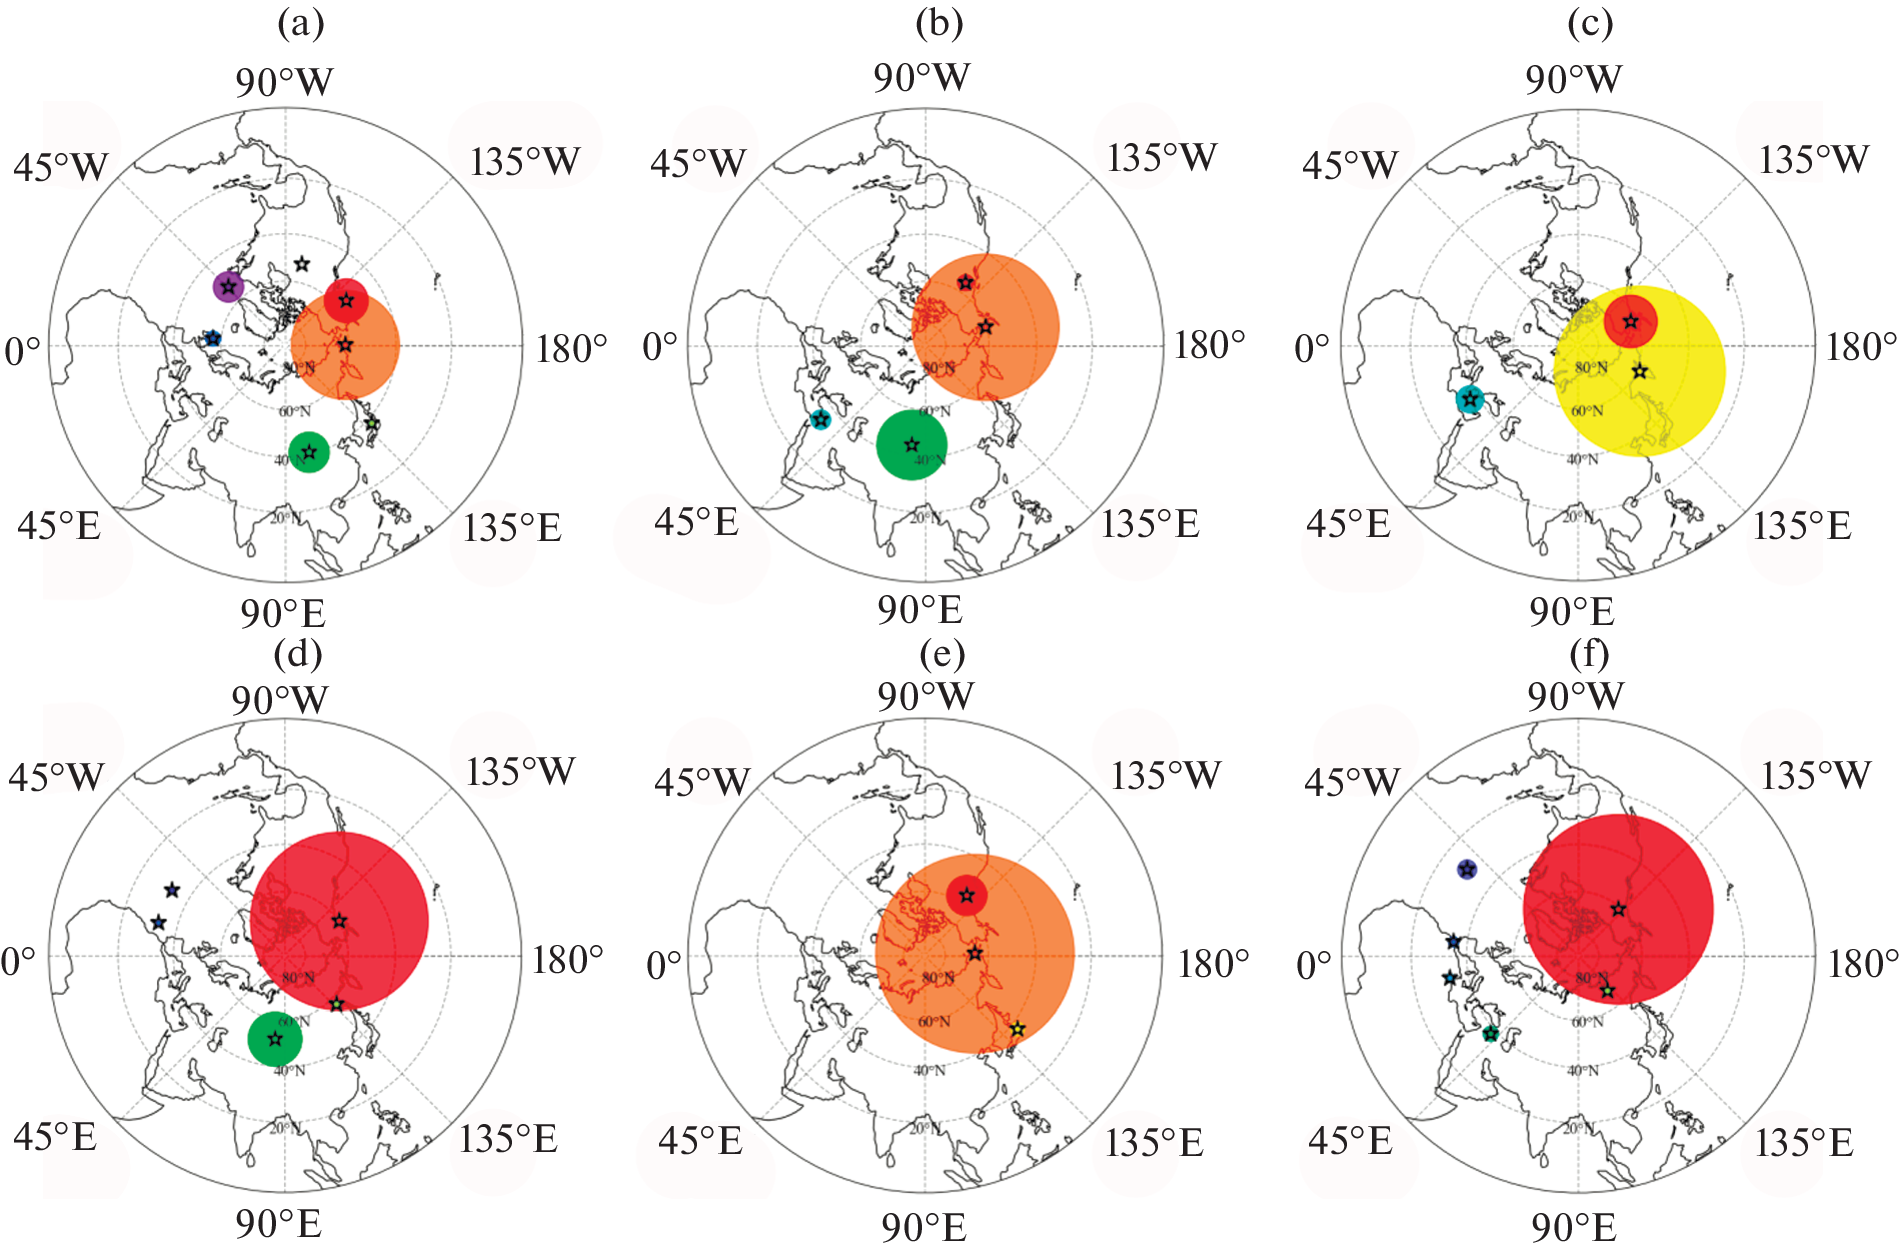


Figure 1 presents the annual average ozone concentrations, measured at the stations in 2023. Error bars indicate the standard deviation from the average.
Fig. 1.
Annual average ozone concentrations in 2023.
From Fig. 1 it can be seen that the annual average SOCs in 2023 differed by more than a factor of six on the territory of Russia. The SOCs were the largest at the stations OPTEC-PR, Kislovodsk high-mountain scientific station (KHMSS), Karadag, Listvyanka, OPTEC-Karelia, OPTEC-P, and Vyatskie Polyany. The SOCs were the smallest at roadside stations in Moscow and at the stations OPTEC-N and Troitsk. The annual average maximum permissible concentration (MPCa.a) of ozone of 30 μg/m3 is exceeded at 13 out of 18 measurement sites [17]. Seemingly, under the urban conditions, the annual average MPC is influenced by ozone depletion due to vehicle engine exhausts, manifested most strikingly at nighttime hours.
At most stations, ozone had been monitored within our consortium for four years. Figure 2 demonstrates how the annual average ozone concentration varied in 2020–2023. It can be seen that the annual average SOCs at most stations are variable in character. We can see the growing tendency of concentrations at separate sites: OPTEC-PR, OPTEC-P, OPTEC-Karelia, Listvyanka, and Obninsk. The only site, demonstrating the decreasing tendency, is OPTEC-N. The SOC varies by 20–30% from year to year, reaching twofold difference in People’s Friendship University of Russia, Moscow (RUDN). The observation time series are still too short to make definite conclusions about stable tendencies of concentration variations.
Fig. 2.
Annual average ozone concentrations in 2020–2023.
2.2 Annual BehaviorThe daily average values and the 8-hour daily maxima are used to analyze the dynamics of the annual behavior. They are presented in Fig. 3. Stations are arranged in the order of decreasing annual ozone concentration in the surface air layer in accordance with data in Fig. 1. Horizontal lines indicate the levels of the limiting daily average concentrations (MPCd.a) to estimate the periods when hygienic standards are exceeded. Below, we will present the quantitative characteristics of these exceedances.
Fig. 3.
Annual variations in the daily average and MDA8 ozone concentrations: (a) OPTEC-PR; (b) KHMSS; (c) Karadag; (d) Lisyvyanka; (e) OPTEC-Karelia; (f) OPTEC-Р; (g) Vyatskie polyany; (h) Apatity; (i) TOR; (j) LAC; (k) Fonovaya; (l) Obninsk; (m) Tarusa; (n) Moscow (urban stations); (o) RUDN; (p) Moscow (roadside stations); (q) OPTEC-N; and (r) Troitsk.
Fig. 3.
In the hygienic standard [17] the daily average MPC is replaced by the new index, i.e., 8-hour average ozone concentration. It is adopted by the World Health Organization (WHO) and widely used in foreign countries. At the same time, the national standard does not indicate how this quantity is defined. If the 8-hour average concentration is calculated using sliding average, then the relevant question to ask is which of the 24 values obtained should be used? Based on the WHO global air quality guidelines [18] the ozone level is conventionally calculated using maximal value of the 8-hour average concentrations, and not the 24-hour averages, because ozone shows strong daily oscillations. Thus, the maximum is selected out of 24 values for a specific day. It is usually denoted as MDA8 (daily maximum 8-hr average).
The annual average ozone concentration in 2023 was maximal in St. Petersburg at OPTEC-PR station (Fig. 3). In annual behavior, the values were maximal at the end of spring and during summer, exceeding MDA8 by more than a factor of two. The SOC values were minimal in late fall–early winter. Though indicated as a background station in Table 1, the OPTEC-PR shows annual behavior very close to the urban type.
The Kislovodsk High Mountain Scientific Station (KHSS) is located high and, as such, shows specific annual behavior of surface ozone. The station is exposed to the free atmosphere air most of the time [13] because the mountain-valley circulation on the northern slope of the vast Shadzhatmaz Mountain Plateau, in the south of which the KHSS is located, creates no noticeable air rising from the valley. Mountain relief favors transport of ozone-rich air from the upper tropospheric layers. From the beginning of surface ozone measurements in 1989, there were usually two local (spring and summer) maxima of the monthly average ozone concentration and a minimum observed in fall–early winter at the KHSS [19]. A salient feature in 2023, as in 2022, was poorly defined springtime maximum. In the period of 2022 and 2023 summer maxima, the absolute hourly average ozone concentrations reached 117 μg/m3, lower than the 2020 and 2021 maxima, which exceeded 140 μg/m3 [13–16]. The observed high ozone concentrations can be due to stratospheric intrusions to the free troposphere and a subsequent mixing in the zone of orographic disturbances [20, 21]. Usually, these events are short-term, lasting from one to few hours. Moreover, the increased concentrations can be due to advection of ozone and its production in polluted air during long-range transport.
Trajectory analysis of air masses arriving at KHSS was carried out to determine the contribution of long-range transport to the observed extreme values. The method for calculating the 7-day back trajectories was described in [14]. The trajectories with humidity higher than 85% at the end point were excluded from the analysis. From this array, we selected two sets of the trajectories corresponding to extreme negative and extreme positive ozone anomalies, respectively, in the first and last deciles of the distribution function of ozone anomalies. For extreme ozone values of both signs, we estimated the probability fields (P, %) of the air particle transport to KHMSS through spatial cells 1° × 1° in size. Figure 4 shows the fields of the annual average probability of air particle transport for extremely low and extremely high ozone concentrations at the KHMSS.
Fig. 4.
Probability of passage of elementary air masses associated with (a) 10% of the lowest and (b) 10% of the highest anomalies of surface ozone concentrations at KHMSS in 2023 and over different territories.
The 2023 probability fields for extremely low values are similar to the 2020–2022 fields and associated with northwesterly air transport. The trajectories associated with extremely low surface concentrations passed with the largest probability over Krasnodar krai, the Azov Sea, and the Azov region every year. As in 2020–2022, the extremely high surface ozone concentrations at KHMSS in 2023 were mainly due to southerly air transport. In 2023, the southwestern cluster of air masses from Turkey and Middle East was more clearly manifested; while the southeastern cluster from Azerbaijan and South Caspian Sea turned out to be more poorly defined. Both clusters are the regions with active extraction and processing of oil and gas, in the plume of which, under the conditions of high temperatures and solar illumination, volatile organic compounds oxidize to give ozone. Passage of air masses over these regions, in addition to mixing in the zone of orographic disturbances, can explain the recorded high values [16]. Moreover, the cluster of the northwesterly trajectories from the region of Donbass appeared in 2022, and became even more pronounced in 2023 [16]. Possibly, this is due to increased formation of combustion products in this zone.
In addition to trajectory analysis, the processes in this region were numerically simulated. The calculations were performed using WRF-Chem regional chemistry-climate model with the chemical module GEOS-Chem (WRF-GC 2.0); this model is a two-way coupling of the meteorological WRF model version 3.9.1.1 (Weather Research and Forecasting model, https://www.mmm.ucar.edu/models/wrf) with chemistry-transport GEOS-Chem model version 2.7.2 (Goddard Earth Observing System chemical model, http://acmg.seas.harvard.edu/geos/). The anthropogenic and biogenic emissions, as well as emissions from wildfires, were specified using CEDS, MEGAN 2.1, and GFED 4.2 data, respectively. The initial and boundary conditions were specified using GDAS data and calculations from global chemistry-transport model GEOS-Chem. The calculations were performed for the summer (July, Fig. 5a) and winter (December, Fig. 5b) months of 2023 in the North Caucasus region for two nested domains. It is noteworthy that the horizontal resolution was 20 km (5 km) for larger (smaller) domain. Choice of this grid was dictated by the need to estimate the effect of the spatial resolution of the model on the calculations and by the efficiency of the computations.
Fig. 5.
Hourly average ozone concentrations in surface air at the KHMSS and numerical calculations, performed using WRF-Chem model for (a) July and (b) December 2023.
The ozone concentrations calculated for July are close to measurements. The correlation coefficient of hourly averages is 0.40. This marked matching of data time series primarily indicates that the emissions used in the model are close to actual values, and that these emissions insignificantly influence the simulation results. However, it should be noted that the calculations for the 20- and 5-km domains almost coincide. This fact and the high correlation for the station characterized by complex orography are because the site is located on a plateau in the upper part of the atmospheric boundary layer, the boundary of which in this area at summertime is at altitudes of 2000–2500 m according to data of aerologic sensing. The local admixture sources are insignificant; even if regional emissions from underlying populated territory of North Caucasus reach the KHMSS, they are smeared in space and time due to advective and vertical mixing. Thus, there are reasons to state that the KHMSS is a background station featuring the regional and, possibly, latitude-belt-characteristic ozone regime in the lower troposphere.
The model-based and measured ozone concentrations match much worse in December, with a correlation coefficient of 0.27. The model/measurements mismatch is primarily because the model insufficiently accurately; accounts for the dynamic process they are activated in winter, including orographic disturbances, and short-term jumps in ozone concentration due to extreme weather conditions, work of snow blowers, and switch-on episodes of a diesel power station. All above effects can obviously be mitigated by correcting the meteorological data and applying standard procedures of checking the quality of ozone measurements.
Data in Fig. 3 indicate that SOCs from the background environmental monitoring station (BSEM) Karadag show distinct seasonal variations. The SOCs were maximal on July 5 and August 5, 2023 (134 and 143 μg/m3, respectively), when there were clear sky and no wind, and minimal on November 22 and December 8 (16 and 11 μg/m3, respectively), when the weather was rainy and air humidity was 88%. The surface ozone concentrations in summer were maximal when air masses were blown from southeast relative to the SBEM Karadag, i.e., from direction of the sea. It should be noted that the SBEM Karadag in our review is the southernmost station out of those measuring surface ozone, except the high-mountain station Kislovodsk.
At the station Listvyanka, the average ozone concentration in 2023 and its annual behavior were the same as in 2021–2022, with the maximum (80–90 μg/m3) in spring and minimum (40–60 μg/m3) in summer and fall, typical for annual behavior in most regions of Siberia. The MPCd.a was exceeded in the period of maximal concentration. No significant interannual differences in the average ozone concentration over the three years were revealed. The short-period (day-to-day and daily) variations were strong and associated with both natural (weather) processes and chemical reactions of ozone, primarily with nitrogen oxides. In particular, ozone concentration regularly decreased, sometimes to zero, due to periodic outflows to the region of the station of plumes from big regional coal-fueled heat and power plants with high nitrogen and sulfur oxide concentrations.
The observation time series from the OPTEC-Karelia station has large gaps, so that the annual behavior is difficult to determine (see Fig. 3), though this station is ranked fifth by the level of annual average concentration.
On the whole, the SOC dynamics at OPTEC-P station is identical to time variations at the OPTEC-PR measurement site (see Fig. 3). The difference lies in the amplitude of annual variations and by how many times the measurements exceeded the MPCd.a.
At the Vyatskie Polyany station, we recorded an annual behavior typical for background regions, with a maximum in spring and a minimum in fall. A salient feature at this station, not observed at other stations, is that the MPCd.a is exceeded as early as January–February. It is noteworthy that the MPCd.a was again exceeded in summer and even in fall.
At Apatity, Murmansk oblast, in 2023, the SOCs were maximal in April (see Fig. 3), which corresponds to long-term annual behavior of ozone, with a well-defined spring maximum and a minimum in the second half of summer. The maximal SOC (130 μg/m3) was recorded at afternoon hours on April 16, which exceeded the 99th percentile (110 μg/m3) of the hourly average SOCs in April. The trajectory analysis of air motion showed that the episode with SOC atypical for the region was due to air advection from more southern regions (Leningrad oblast, southern Karelia), where higher ozone concentrations are usually recorded at this time of the year. We note that the SOC recorded in Apatity (130 μg/m3) is not the maximum possible for Murmansk oblast: a little larger SOCs (130–132 μg/m3) were noted in background region (Lovozero) in Aprils of 1999–2012; based on data from Finnish monitoring stations located at these same latitudes, maximal SOCs can reach 160 μg/m3 in this area. The SOCs in the warm period are usually minimal in the second half of summer and somewhat increase in fall due to more vigorous cyclonic activity in this area. In December in Apatity, there is traditionally a minimum in the annual ozone variation: in calm weather and during weak wind, ozone depleting substances accumulate in urban air against the background of round-the-clock stable stratification, and SOC often decreases to near zero. We note that no analogous December minimum is observed in background regions.
Three stations in Tomsk oblast (Tropospheric Ozone Research (TOR), Large Aerosol Chamber (LAC), and Fonovaya station), though being members of different (urban, suburban, and background) groups, showed similar annual variations in 2023 (see Fig. 3). There are small differences in ozone concentration, to be considered separately in subsection 2.4. The MDA8 were exceeded at all three stations for different numbers of days. This behavior of ozone in the region indicates a minor contribution of anthropogenic sources of precursors.
Though belonging to urban stations, the Obninsk station exhibited the ozone behavior close to background regions, with spring maximum and fall minimum, in 2023. We can note few concentration bursts in summertime, probably associated with heat waves, which favored ozone production from vehicle engine exhausts. Also, the MPCd.awas exceeded.
The other six stations shown in Fig. 3 refer to urban and show minimal annual average ozone concentrations.
In the first half-year, a strong increase in daily average SOCs in May and June, characteristic for the spring–summer period, was observed in the Moscow region: at the People’s Friendship University of Russia (RUDN) station (center of Moscow), Troitsk, and Tarusa. It is noteworthy that the spring–summer maximum was well defined in Troitsk and Tarusa. A period of strong SOC decrease was noted in midsummer at all these stations; a secondary minimum was in late summer and September. This was due to cooling in July and the passage of an anomalous heat wave that began in August and ended in late September.
In 2023, surface ozone concentrations in the Moscow region were routinely measured at 22 automatic air pollution control stations (AAPCS) of Mosecomonitoring. Seven of them are located in nearby suburbs, and 15 stations are mounted on background territories in Moscow oblast [22]. For the analysis, we used 20-min measurements from nine urban-type and six roadside-type AAPCSs in residential regions near big roads of Moscow within the Moscow Automobile Ring Road. We can highlight the following salient features of the SOC in Moscow. The annual average ozone concentration at the stations of urban type was 32 μg/m3, 6 μg/m3 smaller than in previous year. The ozone concentration was 40% smaller at stations of roadside type. The springtime SOC maximum was weaker than usual. No secondary summer maximum occurred in June–July due to relatively cold weather with precipitation. The daily maximal concentrations of surface ozone averaged over the AAPCS data turned out to be smaller than in 2022. Deficient summertime heat was partially compensated for by a prolonged “Indian summer” in September. The SOCs, “higher” than normal and atypical for the season, were observed in the last decade of September and early October. The daily average ozone concentration averaged over the roadside AAPCS data was 12% (for 44 days) larger than the Russian standard MPCd.a and 51% larger (for 186 days) at urban AAPCS. This is smaller than the 2022 values.
Two stations, namely OPTEC-N and Troitsk, are located in regions where the smallest ozone concentrations are less than MPCd.a. The OPTEC-N station is in vicinity of a road and, hence, shows annual ozone behavior similar to roadside stations in Moscow. On the other hand, Troitsk is not exposed to strong anthropogenic emissions of ozone-forming compounds. This is indicated not only by low SOCs, but also by the annual behavior typical for background conditions.
2.3 Maximal ConcentrationsMaximal ozone concentrations in the surface air layer observed in 2023 at all stations are presented in Fig. 6. It can be seen that SOCs exceeded the maximum one-time MPCs (MPCm.o) at only four out of 16 stations. These are two measurement sites in St. Petersburg (OPTEC-PR and OPTEC-P), RUDN in Moscow, and Vyatskie Polyany. Such stations were six in 2022 [16]. In addition to the above stations, concentrations in excess of MPC were recorded at TOR, LAC, and Boyarsk. Therefore, the ozone production intensity was lower in 2023 than in 2022.
Fig. 6.
Maximal one-time surface ozone concentrations in 2023.
Figure 7 shows how ozone was produced and how frequently MPCm.o was exceeded. The figure indicates that the ozone concentrations were maximal in summertime, in St. Petersburg and were most probably due to photochemical production from vehicle engine exhausts on the territory of the city in the period of heat wave arrival. In Vyatskie Polyany, the ozone maximum occurred in spring and seems to be of natural origin. A few maxima at RUDN station stemmed from the Indian summer in the Moscow region.
Fig. 7.
Annual variation in the daily maximal SOCs: (a) OPTEC-PR; (b) OPTEC-P; (c) Vyatskie polyany; and (d) RUDN.
2.4 Mesoscale Differences in SOC DistributionIn three regions of observations (Moscow, St. Petersburg, and Tomsk oblast), ozone measurements in 2023 were carried out at few stations. In the period of measurements, the stations were under similar weather conditions; therefore, it would be interesting to consider how strongly ozone concentrations differ at the mesoscale level.
If we turn to Fig. 8, which presents the daily average ozone concentrations in St. Petersburg and Tomsk oblast, we can see that the weather cycles are quite synchronous, in both regions at all stations and the concentration oscillations differ only in amplitude. Data of Table 2 give information on how strong these differences are. This table shows that in Moscow the differences in the concentrations between urban and near-roadside stations were 12.9 μg/m3 on average, and the maximal differences during the year reached 39.2 μg/m3. The difference turned out to be small (1.9 μg/m3) between city-average and RUDN values, though the maximal difference was very large (30.4 μg/m3). The differences were markedly larger between RUDN and Troitsk stations, found to be 18.6 on the average and 68.6 μg/m3 at the maximum. This latter was because the Troitsk site is located near (about 150 m apart from) Kaluga road with heavy traffic; while RUDN samples are collected in the University’s courtyard.
Fig. 8.
Daily average SOCs at the stations in (a) St. Petersburg and (b) Tomsk oblast.
Table 2. Interstation differences in the ozone concentration in Moscow, St. Petersburg, and Tomsk oblastStill larger differences in ozone content were recorded on the territory of St. Petersburg in 2023. The average concentration difference between two stations varied from 22.5 to 56.4 μg/m3, and the maximal difference was from 84.6 to 126.6 μg/m3.
In Tomsk oblast, the SOC differences were, on the average, 5.5 and 5.6 μg/m3 between sparsely spaced stations (separated by 52 and 56 km, respectively) and 0.2 μg/m3 between closely spaced stations. The differences on certain days, ranging from 23.9 to 38.8 μg/m3, compared well with those in Moscow. These mesoscale differences in ozone concentration obviously stem from the presence of the sources of ozone precursor gases in Moscow. On the territory of cities, these sources are mainly vehicle engine exhausts and emissions from industrial plants [23].
Comments (0)