
Remember me
Human ethics project was approved by the CHU-UCL Namur ethics Committee (157.2022). Written and informed consent were obtained for all study participants. For all subjects, a thorough clinical assessment was conducted by an ICU COVID expert (P.B.) and an MD general practitioner (M.J.). The relevant medical SARS-CoV-2 history (disease severity, time of infection, vaccination status) and persistent symptoms since SARS-CoV-2 infection (Table 1) as well as patients’ complete medical records were reviewed. LC patients’ selection relied on the 2021 WHO consensus definition. Inclusion criteria for long COVID patients (LC; n = 13) were: (i) 18 years of age or over; (ii) previous SARS-CoV-2 infection confirmed by a PCR or antigen test; (iii) presence of persistent symptoms (cognitive impairments, pain, fatigue) for at least 2 months that cannot be explained by an alternative diagnosis. Age- and sex-matched individuals without morbidities served as healthy control group (HC; n = 10) (Table 1). Their inclusion criteria were the same as above, except for the absence of persistent symptoms for at least 2 months since SARS-CoV-2 infection. Exclusion criteria for all participants were: (i) medical history of chronic pain, depression, cognitive impairments before SARS-CoV-2 infection; (ii) diagnosis of stroke, epilepsy, or neurodegenerative diseases (e.g. Alzheimer’s disease, amyotrophic lateral sclerosis, Parkison’s disease); (iii) diagnosis of autoimmune disease (e.g. rheumatoid arthritis, Sjögren’s syndrome, systemic lupus erythematosus, multiple sclerosis, type I diabetes). Routine laboratory tests were systematically examined to rule out alternative diagnosis for the reported symptoms. In particular, potential infectious causes such as cytomegalovirus (CMV) and Epstein–Barr virus (EBV) infections were investigated, and thyroid dysfunction was excluded. When clinically warranted, additional autoantibody screening was performed as part of routine care to exclude common autoimmune diseases. Most patients also underwent brain imaging (CT scan, MRI, or scintigraphy) during their clinical evaluation. When neuroimaging was not performed, the neurological examination was normal and did not justify further neuroradiological investigations.
Table 1 Patient demographics. Clinical data related to age, sex, SARS-CoV-2 infection(s), vaccination status, blood sampling and patient-reported symptoms are presented. P percentiles. Statistical comparisons between HC and LC groups were performed using the Mann–Whitney U test or Fisher’s exact test, when appropriateThe neuropsychological assessment was performed by a trained neuropsychologist (CD) and included: Montreal Cognitive Assessment (MoCA), Symbol Digit Modalities Test (SDMT), STROOP test, D2 test, TAP Go/No go, TAP divided attention task, Beck Depression Inventory, Hospital Anxiety and Depression Scale (HADS) as well as, for pain evaluation, a Numeric Pain Rating Scale (NPRS) and DN4 questionnaire (Table 2). All the neuropsychological tests were performed on the day of blood sampling. Serum was isolated within 30 min after blood sampling and kept at 4 °C until IgG purification or was aliquoted at − 20 °C for the other protein assays.
Table 2 Neuropsychological assessment and biomarkers of neurodamages. Expert-based cognitive testing included measures of memory (MoCA), executive functions (STROOP, Go/No Go task), attention (SDMT, D2 test, visual and auditory attention). Anxiety (HADS), depression (HADS, Beck) and pain intensity (NPRS, DN4) were assessed based on patient-reported outcomes using standardized questionnaires. Mean values for UCH-L1, Nf-L, GFAP serum levels are expressed in pg/mL. P = percentiles. Statistical comparisons between HC and LC groups were performed using the Mann–Whitney U test or Fisher’s exact test, when appropriateIgG purificationFor IgG purification from LC patients (n = 13) or HC (n = 10), serum was diluted 1:1 with glycine 0.1M NaCl 3M pH 8.9 and passed through a protein G column (Cytiva, Uppsala, Sweden) previously equilibrated with glycine 0.1M NaCl 3M pH 8.9. The column was rinsed with glycine 0.1M NaCl 3M pH 8.9, and the IgG-depleted sera was separately collected. The bound IgGs were eluted using glycine 0.1M pH 2.3 and immediately neutralized with Tris 1M pH 9.8. The column was then re-equilibrated with glycine 0.1M NaCl 3M pH 8.9. The eluate was dialyzed overnight at 4 °C in PBS using a 12–14 kDa dialysis membrane (Spectrum Laboratories, Rancho Dominguez, CA, USA). The concentration of IgGs was determined using a Nanodrop 1000 (Thermo Scientific, Bleiswijk, The Netherlands). Finally, the IgG solution was stored at − 20 °C.
Determination of Ig, UCH-L-1, Nf-l, and GFAP levelsQuantification of immunoglobulin isotypes (IgG, IgA, IgM) in sera and in purified IgG fractions was performed using Alinity 3 point-of-care diagnostic systems (AC01873, Abbott, Chicago, IL, USA). Quantification of IgE concentration was performed using a human IgE ELISA kit (BMS2097, ThermoFisher Scientific, Waltham, MA, USA) according to manufacturer’s instructions. Neuronal and glial damage markers (Nf-l, UCH-L1, GFAP) were quantified in sera, respectively, using Quanterix SIMOA assay (Simoa® NF-light™ Advantage Kit (SR-X), Quanterix, Billerica, MA, USA) and Alinity 5 point-of-care diagnostic systems (AI01128, Abbott, Chicago, IL, USA).
Papain enzymatic cleavageDigestion buffer (PBS, 5 mM EDTA, 20 mM cysteine-HCl, pH 7.0) was prepared extemporaneously. 2mL of immobilized papain (ThermoFisher Scientific, Waltham, MA, USA) were equilibrated by adding the digestion buffer and centrifuged at 1026 × g for 5 min to pellet the resin. This step was done twice. The IgG sample was then diluted 1:1 with the digestion buffer. Approximately 12 mL of the solution were added to the immobilized papain so that the IgG solution was adjusted to 20mg/mL. Samples were incubated overnight at 37 °C on a rotating platform. After the incubation period, the digested IgGs were separated from the immobilized papain by centrifugation (3912 × g for 5 min) to pellet the resin and collect the supernatant. The digested IgG solution was then stored at − 20 °C.
Antigen microarraySerum samples were screened for autoantibody profiling using a commercial antigen array platform (Genecopoeia, Rockville, MD, USA). Briefly, sera were hybridized onto nitrocellulose filters adherent to glass slides and microarray slides spotted with 120 known autoantigens (PA002 OmicsArray™ Brain and Central Nervous System Disorders Antigen Microarray). Slides were incubated with fluorescently coupled anti-IgG secondary antibodies and were imaged using a GenePix 4000B scanner. The Mapix software was used to analyze raw data (Innopsys France, Carbonne, France). Raw fluorescence data were normalized to PBS controls to get the Net Signal Intensity (NSI) of each antigen in each sample. The data presented in the heatmap are NSI normalized to internal Ig control batches according to manufacturer’s instructions.
Western blottingSerum and purified IgG samples were mixed with 5% β-mercaptoethanol and denatured via boiling for 5 min prior to gel loading. Serum or IgG (1 µg/well) was loaded on a 10% polyacrylamide gel, separated via SDS-PAGE and transferred to a nitrocellulose blotting membrane (Protran, Amersham, Buckinghamshire, England). Membrane blocking was made using a bovine serum albumin 5% + TBS-Tween 0,1% solution for 1 h at room temperature. Membranes were incubated with a solution of 5% TBST-BSA and anti-human IgG light and heavy chains antibody (1:50 000, 109–035-044, Jackson Laboratory, Bar Harbor, ME, USA) at room temperature for 1 h. Prior to revelation, the membrane was rinsed 3 times with TBS-0.1% Tween and then incubated for 1 min in a chemiluminescent revelation solution (BM Chemiluminescence Blotting Substrate, Roche Diagnostics, Mannheim, Germany). The image acquisition was performed using an ImageQuant LAS 4000mini system (GE Healthcare, Little Chalfont, UK).
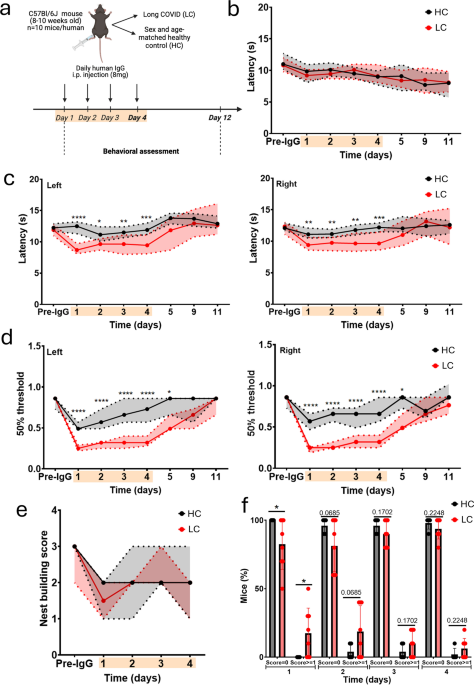
Mice handlingThe experimental procedure was approved by the Animal Ethics Committee of the University of Namur (ethics project UN 23–392 and UN 24–438). Mice were housed in a temperature-controlled environment with a 12 h light/12-h dark cycle. They had access to food and water ad libitum. Behavioral experiments were performed on female C57BL/6J mice (8–10 weeks old) purchased from Charles River Laboratories (Beerse, Belgium). Mice received the human IgG solution intraperitoneally (8 mg/day) for four consecutive days. Each IgG batch isolated from one human subject was injected into a cohort of ten mice. During the two weeks post-injections, mice were submitted to behavioral tests (Fig. 1a). This experimental timeline was selected because the aim of the study was to evaluate the short-term effects of IgG transfer on mouse behavior. It was also based on previously published passive transfer studies in mice showing that pain-related phenotypes can be detected as early as 24–48 h after the first IgG injections [11, 20].
Fig. 1 The alternative text for this image may have been generated using AI.
Pain-related behavioral tests in mice transferred with IgG from long COVID patients (LC) or healthy controls (HC). a Experimental timeline. 10 mice were used per human IgG batch. The number of human subjects included for each specific test is detailed below. The orange overlay on each timeline corresponds to the injection period. b Paw withdrawal latency at the hot plate test was unchanged between HC (n = 7) and LC (n = 10) groups. c Hind paw (left and right) withdrawal latency at the Hargreaves test was significantly decreased during the first four days post-injection in the LC (n = 6) condition compared to the HC (n = 5). d Hind paw (left and right) withdrawal threshold at the Von Frey filaments was significantly decreased during the first five days post-injection in the LC (n = 13) condition compared to the HC (n = 10). e The general well-being and motivation behavior were similar between groups of mice at the nest-building score (n = 5 HC and n = 8 LC). f The percentage of mice with an abnormal Facial Grimace Scale (score ≥ 1) was significantly increased on the first day post-injection in the LC group (n = 8 LC and n = 5 HC). Median [95% CI]. Mixed-effects model followed by a Holm-Sidak multiple comparison test between HC and LC (*p < 0.05, **p < 0.01, ****p < 0.0001)
A second experimental paradigm was conducted using a modified protocol. Mice received intraperitoneally either IgG-depleted serum, papain-digested IgG, or native IgG (8mg/injection) from LC patients. Pain-related behavioral tests were performed as previously but over a period of two days (Fig. 2a). This shortened protocol was sufficient to assess pain-related behavioral responses as supported by our results from the first experimental protocol and by other studies [20]. Moreover, it enabled the detection of behavioral effects while ensuring a more efficient and appropriate use of the limited human biological material available. Mice were randomized between cages, and the experimenter (M.M.) was blinded to treatment.
Fig. 2 The alternative text for this image may have been generated using AI.
Pain-related behavioral tests in mice transferred with purified IgG, papain-digested IgG or IgG-depleted serum, from long COVID patients. a Experimental timeline. 10 mice were used per patient IgG batch, n = 3 LC IgG batch. b The abundances of heavy (55 kDa), light chains (25 kDa), Fc (30 kDa) and Fab fragments (25 kDa) were assessed in total human serum, purified IgG fraction, IgG-depleted serum and papain-digested IgG fraction by immunoblotting. The presence of an extra band at 30 kDa confirmed the partial digestion of IgG heavy chains after papain incubation. c Paw withdrawal latency at the hot plate test was rescued the first day post-injection in mice receiving depleted serum and papain-digested IgG. d Paw withdrawal latency at the cold plate test was fully rescued in mice receiving depleted serum and papain-digested IgG compared to native purified IgG. e Hind paw (left and right) withdrawal latency at the Hargreaves test was significantly different in mice receiving depleted serum and papain-digested IgG compared to native purified IgG. f Hind paw (left and right) withdrawal threshold at the Von Frey filaments was fully rescued in mice receiving depleted serum and papain-digested IgG. Median [95% CI]. Mixed effects model followed by a Holm-Sidak multiple comparison test between purified IgG and the IgG-depleted serum group (*p < 0.05, ***p < 0.001, ****p < 0.0001) and between purified IgG and the papain-digested IgG group (#p < 0.05, ##p < 0.01, ###p < 0.001, ####p < 0.0001)
Behavioral testingBefore any test, mice were moved to the experimental room in their home cages to acclimatize (10–15 min). Baseline measurements were performed before any IgG injection (‘pre-IgG’).
Hot and cold platesThe hot plate analgesia meter (Columbus Instruments, Columbus, OH, USA) was set to 52 °C while the cold plate system (ElectraCOOL™ TCP50™, Advanced thermoelectric, Melbourne, FL, USA) was set to 4 °C. Mice were placed onto each platform surrounded by transparent Plexiglas walls. The time the mice took to show signs of thermal distress (paw licking, jumping, hind-paw stomping) was measured. If mice did not show any of these signs, they were removed from the plate after 30 s to prevent tissue damage.
Hargreaves testMice were placed onto a glass surface, separated by a Plexiglass wall, and allowed to acclimate for 10 min. To observe a variation in thermal sensitivity among mice, a radiant thermal beam was placed under their left and right hind paws to provoke a withdrawal response using a Plantar Test Analgesia Meter (Model 390, IITC Life Science, Los Angeles, CA, USA). The time separating the stimulus onset and the paw withdrawal, called latency (in seconds), was recorded. If mice did not show signs of thermal distress (licking of the paw, paw withdrawal), the beam was removed after 20 s to prevent tissue damage. Each hind paw was stimulated three times in total with five minutes between each stimulation. The latencies of each individual were averaged.
Von Frey filamentsVon Frey filaments were calibrated monofilaments (0.008–2 g) used to apply a specific pressure on one animal’s skin. Mice were tested in individual cages equipped with a stainless-steel wire mesh that allowed full access to the paws (Bio-VF-M, Bioseb, Vitrolles, France). Stimulation with the filaments was limited to the medio-plantar area of the paw. One of a series of 8 Von Frey filaments, with logarithmically increasing stiffness, was applied to the plantar area for 2 to 3 s. The force applied should be sufficient to induce a slight buckling against the paw. Immediate licking of the filament stimulation area was considered a positive response to filament stimulation. The Chaplan’s Up-and-Down method was used [9], meaning that the test was initiated with the 0.4 g filament and then the stimuli were presented consecutively, up or down. If there was no paw withdrawal response to the initial stimulus, a stronger stimulus was presented. If a paw withdrawal response was observed with the initial stimulus, a weaker stimulus was presented. This was done until the absence of paw withdrawal (if descending) or the presence of paw withdrawal (if ascending).
Nest building scoreMice were isolated in a new cage containing new nesting material. Seven hours post-IgG injection, nest construction was blindly evaluated by the experimenter using a rating scale from 1 to 3 (1 = no nest construction; 2 = partial nest with scattered material, 3 = perfectly constructed nest). This evaluation took place every day during the 4 days of IgG injection, and each day after the injection, the mice were isolated in a cage with new nesting material. At the end of the 4 day injection period, the mice that were initially together in the same cage were again put back together in a new cage containing a mixture of the new nest and each other's nests.
Facial grimace scaleMice were video-recorded every day during the first week of IgG injection. They were then blindly evaluated by the experimenter and scored (0 = not present; 1 = moderately present; 2 = obviously present). Five facial expressions were analyzed: orbital tightening, nose bulge, cheek bulge, ear position, and whisker change.
Barnes mazeBriefly, the mouse was dropped in the center of an elevated circular platform (122 cm diameter) with 40 evenly spaced holes (5 cm diameter). An escape box (22,5c m length × 8,5 cm wide × 10,5 cm high) was located underneath one hole. This box was maintained at a fixed location for the whole duration of the test. Four visual cues were located at regular intervals around the table so that mice can use them to orient themselves. This test was done in three steps: Habituation phase (day 1)—mice were placed in the escape box for 60 s and then in the center of the table. They were allowed to explore it until they entered the escape box, or 300 s had elapsed. Acquisition training (day 1–5)—it started at least 1-h after the habituation phase. Three trainings each day for five days were performed during which the animals were placed in the center of the maze in a covert start box for 8 s and were then allowed to explore the maze for 180 s. If by the end the mice had not entered the escape box, they were gently guided towards the corresponding hole and allowed to remain there for 60 s. Post-injection measures—during the two weeks post-injection, mice only performed one trial at specific time points. Between each trial, the maze was thoroughly cleaned with ethanol to remove olfactory cues. The primary latency (time to locate the target hole) and total latency (time to enter the escape box) were recorded.
Y-mazeThe Y-maze (arm’s length 40 cm × 8 cm wide, center zone 8 cm diameter) was made of three symmetrical arms (A, B, C). The mouse was placed at the same end of one arm of the Y-shaped maze and allowed to explore it for 300 s. The total distance traveled was determined by a tracking software (EthoVision XT 18, Noldus System, Netherlands) and served as a measure of fatigue. The number of alternations between each arm (arm A, arm B, arm C) and the number of entries in each arm were monitored by a video tracking system (EthoVision XT 18, Noldus System, The Netherlands). The percentage of alternations was then calculated as follows: (total number of alternations/number of arms entered) × 100.
Elevated-plus mazeThe elevated-plus maze consisted of a plus-shaped maze elevated above the ground (51 cm) with two opposite closed arms (30 cm length × 5 cm wide), two opposite open arms (30 cm length × 5 cm wide) and a central square (5 cm sides). Mice were placed at the center of the maze, head facing an open arm, and explored the maze for 300 s. The total time spent in the open and closed arms, respectively, was measured by a video tracking system (EthoVision XT 18, Noldus System, The Netherlands).
Light/dark boxThe apparatus consisted of a box (50 cm length × 24 cm wide x 24cm high) equally divided into a bright and a dark compartment. An opening of 7 cm high and 7 cm wide connects the two parts. Mice were placed in the bright chamber and explored the box for 300 s. The total time spent in the dark and bright chambers, respectively, was measured by a video tracking system (EthoVision XT 18, Noldus System, The Netherlands).
Tail suspension testThe test consisted of a tail suspension apparatus (42 cm length × 14 cm wide × 24,5cm high) allowing three mice to be tested at the time in separate compartments so that mice could not observe and interact with each other. A piece of tape was placed on the tail of the mouse, precisely 2 cm from its tip. The tape itself was attached to a hook in the middle of the suspension cage. For 360 s, the total duration of agitation and immobility of the mice suspended by their tails was recorded.
Euthanasia and histologyFor euthanasia, mice were anesthetized using a Ketamine/Xylazine cocktail (120 mg/kg ketamine (Nimatek); 8 mg/kg xylazine (Sedaxylan)), perfused intra-cardially with cold 0,9% NaCl. The brain, spinal cord, and lumbar dorsal root ganglia (DRG) were freshly harvested, snap-frozen or fixed with 4% paraformaldehyde for histology analysis. Brain and spinal cord samples were dehydrated with a Leica HistoCore (Leica Biosystems, Nanterre, France) and embedded in paraffin. Ten µm-thick sections were obtained using a microtome (RM2145, Leica Biosystems, Nanterre, France). DRGs were washed with PBS and transferred to 30% sucrose solution at 4 °C for 48–72 h. Then, they were embedded in OCT compound, frozen in cold isopentane and stored at -80°C. Cryosections, 10µm in thickness, were obtained using a cryostat (CM1950, Leica Biosystems, Wetzlar, Germany).
ImmunohistochemistryParaffin sections were dewaxed and sequentially rehydrated. Heat-induced epitope retrieval was performed using a 0.01M citrate buffer pH 6 in a 96 °C water bath for 10 min. Following endogenous peroxidase blocking with 3% hydrogen peroxide for 10 min, sections were incubated with 5% goat serum-TBS for 15 min at room temperature, and were incubated overnight at 4 °C with primary antibodies (listed in Table 3) or for 4 h at room temperature with anti-human IgG antibody diluted in 1% goat serum-TBS. Sections were then incubated with secondary antibodies (Vectastain ABC-HRP kit, Peroxidase [Mouse IgG] PK-4002 or [Rabbit IgG] PK-4001 or [Goat IgG] PK-4005, Vector Laboratories, Newark, CA, USA) for 30 min at RT. Immunolabeling was revealed using 3,3’-diaminobenzidine (DAB, K3468, Dako, Santa Clara, CA, USA). Finally, the sections were counterstained with hematoxylin and mounted with DPX medium. Observations were obtained following slide scanning using Pannoramic Flash Desk DX digital scanner (3DHistech, Budapest, Hungary).
Table 3 Primary and secondary antibodies for immunohistochemistry (IHC) or immunofluorescence (IF)ImmunofluorescenceMouse DRGs cryosections were washed with TBS and saturated with TBS-BSA 0.2%—Tween 0.02% for 1 h at RT. Primary antibodies (Table 3) were diluted in the saturation solution and incubated on sections at 4 °C O/N. After washing with TBS-Tween 0.02%, sections were incubated for 1 h at room temperature with secondary antibodies (Table 3). Nuclei were counterstained with Hoechst (1:200; 94,403, Sigma, St Louis, MO, USA). Sections were mounted with Mowiol and kept at 4 °C until imaging with the LSM 900 confocal microscope (Zeiss, Germany). Image analyses were performed using the software ImageJ.
Normal human DRG tissues were obtained post-mortem through the body donation program at the Faculty of Medicine, University of Namur (Prof. P. Garin, Laboratory of Anatomy) and were approved by the CHU-UCL Namur Ethics Committee (157.2022). Paraffin sections were dewaxed and sequentially rehydrated. Slides were washed with TBS and saturated with TBS-BSA 0.2%—Tween 0.02% for 1 h at RT. Purified IgG were diluted in the saturation solution at 25 µg/mL and incubated on section at 4 °C O/N. After washing with TBS-Tween 0.02%, sections were incubated for 1 h at RT with secondary antibody (Table 3). Nuclei were counterstained with Hoechst (1:200; 94,403, Sigma, St Louis, MO, USA). Sections were mounted with Mowiol and kept at 4 °C until imaging with Olympus BX63 epifluorescence microscope equipped with XM10 camera (Olympus Corporation, Tokyo, Japan). Image analyses were performed using ImageJ. At least 100 neuron cell bodies were analyzed per condition.
RNA extraction and quantitative PCRBrain and DRG tissues were resuspended in 1 mL of TriZol reagent (Life Technologies, Bleiswijk, The Netherlands). Total RNAs were isolated according to the manufacturer’s instructions (High Pure RNA Tissue kit 12,033,674,001, Roche, Mannheim, Germany). RNA yield and purity were determined using a spectrophotometer NanoDrop 1000 (Thermo Scientific, Bleiswijk, The Netherlands). Total RNAs were reverse transcribed using the Super Script III Reverse Transcriptase kit according to the manufacturer’s instructions (Invitrogen, Merelbeke, Belgium). cDNA samples were used to amplify genes of interest with Takyon SYBR Green kit (Eurogentec, Liège, Belgium) in a Light Cycler 96 device (Roche Diagnostics, Mannheim, Germany). Primer sequences (Eurogentec, Liège, Belgium) are as follows: Gfap forward 5’-GCCACCAGTAACATGCAAGA-3’; Gfap reverse 5’-CGGCGATAGTCGTTAGCTTC-3’; Iba1 forward 5’-CTTGAAGCGAATGCTGGAGAA-3’; Iba1 reverse 5’-GGCAGCTCGGAGATAGCTTT-3’; Hprt forward 5′-TGACACTGGCAAAACAATGCA-3′; Hprt reverse 5′-GGTCCTTTTCACCAGCAAGCT-3′. The relative gene expression was calculated using the ΔΔCq method with hprt as the housekeeping gene.
Statistical analysisData are presented as median [95% CI] or mean ± SD and the number of patients/healthy individuals included is indicated by the value of n. Ten mice were systematically used per patient/healthy individual IgG batch. Statistical analyses were performed on individual mouse data. Paired t-test (Suppl. Figure 1), Mann–Whitney U test (Figs. 4, 6b, 8b, Tables 1, 2), Welch’s t-test (Fig. 8d), Fischer’s exact test (Tables 1, 2), Kruskal–Wallis H test (Fig. 7b), and mixed model followed by Holm-Šídák multiple comparison test (Figs. 1b–f, 2c–f, 3a–f, Suppl. Figures 2a–e, 3a–e.) were used to determine statistical significance (set at p < 0.05). Statistical analyses were performed on the software GraphPad Prism (v.10.2.3, La Jolla, USA) or in the R environment (v.2025.05.1 + 513).
Fig. 3 The alternative text for this image may have been generated using AI.
Spatial memory, anxiety and depression-related behavioral tests in mice transferred with IgG from long COVID patients (LC) or healthy controls (HC). 10 mice were used per human IgG batch. The number of human subjects included for each specific test is detailed below. The orange overlay corresponds to the injection period. a Primary and total latencies at the Barnes maze did not differ between HC (n = 9) and LC (n = 10) groups. b Alternation between the arms of the Y-maze did not differ between HC (n = 8) and LC (n = 10) groups. c Total distance traveled in the Y-maze reflecting the general locomotor activity was unchanged between experimental conditions (n = 8 HC and n = 10 LC). d Time spent in the closed arms of the elevated-plus maze, as a measure of anxiety, was similar between groups (n = 6 HC and n = 7 LC). e Time spent in the dark compartment of the light and dark box, as a measure of anxiety, was similar between groups (n = 6 HC and n = 7 LC). f Immobility time at the tail suspension test, as a proxy of depressive-like behavior in mice, did not differ between HC (n = 6) and LC (n = 7) groups. Median [95% CI]. Mixed-effects model followed by a Holm-Sidak multiple-comparison test between HC and LC
Comments (0)