
Remember me
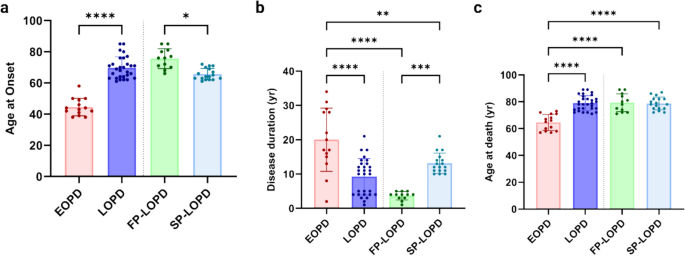
Postmortem human brain samples from a clinically and neuropathologically well-characterized cohort were obtained from the Mayo Clinic Brain Bank, Jacksonville, Florida. A total of 63 individuals of European descent were included in the study, representing two distinct PD subtypes: early-onset (EOPD, onset < 60 years) and late-onset (LOPD, onset > 60 years). Within the LOPD group, patients were further stratified based on disease progression rate into slow-progressing (SP-LO, disease progression of more than 10 years), and fast-progressing (FP-LO, disease progression of less than 5 years) PD. A cohort of non-Lewy body (non-LB) controls without synucleinopathy was included for comparison. All Lewy Body dementia (LBD) cases were clinically diagnosed with PD or Parkinson’s disease dementia (PDD) and were neuropathologically confirmed to have LB disease. Metadata including age at onset, disease duration, progression rate (Fig. 1a-c) and APOE genotype were available for all samples (Table 1 and Supplementary Table 1). While all cases had confirmed neuropathological diagnosis and clinical diagnosis, more detailed clinical information was not available for every individual due to the donations of the post-mortem brains to the brain bank coming from multiple sources. One patient was excluded from the analysis due to a post-mortem interval (PMI) substantially longer than that of all other patients in the cohort, to minimize potential confounding effects on protein integrity and assay readouts.
Fig. 1 The alternative text for this image may have been generated using AI.
Bar graphs with individual data points show (a) age at onset, (b) disease duration, and (c) age at death across early-onset PD (EOPD), late-onset PD (LOPD), fast-progressing late-onset PD (FP-LOPD), and slow-progressing late-onset PD (SP-LOPD) groups. Data are presented as mean ± SD with each dot representing an individual case. Statistical comparisons were performed using one-way ANOVA followed by Tukey’s multiple comparison test for group comparisons
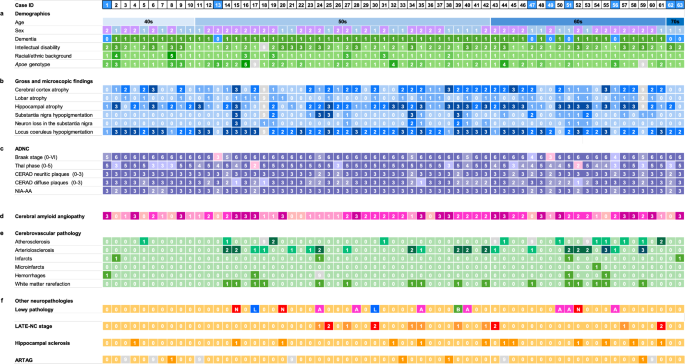
Table 1 Individual characteristicsNeuropathological assessmentA standardized neuropathologic evaluation was conducted for all cases by the same neuropathologist, including macroscopic observation, histologic assessment of hematoxylin and eosin-stained sections, fluorescent microscopy of thioflavin S (thioS) staining, and aSyn immunohistochemistry as previously described [47]. Immunohistochemistry for aSyn was performed following formic acid pretreatment using a Dako Autostainer with NACP antibody (Mayo Clinic; rabbit polyclonal; 1:3000). The neuropathologic diagnosis of LBD was determined based on the detection of LBs within susceptible brain regions. LBD subtypes were subsequently classified into brainstem, transitional (limbic), and diffuse (neocortical) subtypes according to the extent and anatomical distribution of Lewy-related pathology (Table 1) [13]. LB quantification in the cingulate cortex was performed on NACP-immunostained sections. The cingulate gyrus was selected because it is a limbic cortical region that consistently exhibits aSyn pathology in PD and is functionally relevant to both motor integration and cognitive and neuropsychiatric manifestations of the disease. The microscopic field with the highest LB density was identified, and LBs were counted at × 20 magnification. For this assessment, only LBs with visible cell nuclei were counted while LNs were excluded from the analysis. Braak neurofibrillary tangle stage [6] and Thal amyloid phase [53] were determined using thioS fluorescence microscopy. Small vessel disease was assessed on hematoxylin and eosin-stained sections and considered present when arteriolosclerosis accompanied by microinfarcts, microbleeds, or white matter ischemic changes was identified [46].
Preparation of soluble and insoluble fractions from postmortem brain tissueAll postmortem brain tissues used in this study were dissected from the cingulate gyrus. For each patient sample, ~ 180 mg frozen tissue was cut into small pieces (~ 1 mm3) using a sterilized scalpel on a cutting board cooled on ice. At a ratio of 1 g tissue to 3 mL homogenization buffer (50 mM Tris–HCl, pH 7.4, 750 mM NaCl, 5 mM EDTA, with cOmplete™, Mini, EDTA-free Protease Inhibitor Cocktail (Millipore Sigma) and Halt Phosphatase Inhibitor Single Use Cocktail (Thermo Scientific) to 1X), tissue was homogenized with two ceramic beads (2.8 mm, Omni International) using a bead homogenizer (VWR Mini Bead Mill) at speed 4 for 1 min. The homogenate was centrifuged at 85,000 × g for 20 min at 4 °C and the supernatant was collected as the “buffer-soluble” fraction. The pellet was subsequently re-homogenized in 1% Triton X-100 in homogenization buffer and centrifuged a second time at 85,000 × g for 20 min and the supernatant was collected as the “detergent-soluble” fraction. The pellet was extracted with 1 M sucrose and 1% Triton X-100 in homogenization buffer to remove myelin then washed twice with detergent-free tris-buffered saline (TBS) to minimize residual detergent carryover. The final pellet was resuspended in TBS with protease inhibitor, aliquoted, and frozen at −80 °C for use as the “detergent-insoluble” fraction.
AlphaLISA assay for total and phosphorylated serine 129 aSyn (pSer129-aSyn)Amplified Luminescent Proximity Homogeneous Assay (AlphaLISA) is a highly sensitive, bead-based immunoassay that enables semi-quantitative and quantitative detection of target proteins in biological samples such as tissue or cell lysates using Alpha technology. AlphaLISA was used to measure total aSyn and phosphorylated Serine 129 aSyn (pSer129-aSyn) levels in detergent-insoluble fractions. Assays were performed using commercially available kits specific for total aSyn (Revvity, ALSU-TASYN-B-HV) and pSer129-aSyn (Revvity, ALSU-PASYN-B-HV) according to the manufacturer’s instructions and protocols optimized for brain homogenates.
Detergent-insoluble brain fractions were prepared by standard detergent extraction protocols. For AlphaLISA, these fractions were diluted 2.5-fold with the kit-provided lysis buffer and incubated on ice for 20 min. For quantitative measurements, recombinant human aSyn (Proteos, RP-003) and recombinant human pSer129-aSyn (Proteos, RP-004) proteins were used to generate standard curves for total and pSer129-aSyn quantification, respectively. 15 μL of the diluted sample was added to each well of a low-volume HTRF 96-well plate (Revvity, 66PL96025). 7.5 μL of the AlphaLISA Acceptor Mix, prepared fresh using Reaction Buffer 1, Reaction Buffer 2, Activation Buffer, and Acceptor beads, was added to each well containing samples or standards. Plates were sealed with adhesive film, covered with foil to protect from light, and incubated at room temperature for 1 h. Subsequently, 7.5 μL of the Donor Mix, prepared using Dilution Buffer and Donor beads, was added to each well under low-light conditions. Plates were resealed and incubated for an additional 2 h at room temperature in the dark. AlphaLISA signal intensity was measured using an EnVision microplate reader (PerkinElmer, Waltham, MA) in Alpha Screen mode. The assay was performed with four replicates per sample across three repetitions for quantitative analysis and two repetitions per sample for semi-quantitative analysis.
Real-time quaking-induced conversion (RT-QuIC) assayRT-QuIC is a highly sensitive and specific cell-free aSyn seed amplification assay (SAA) that detects minute amounts of seeding-competent aSyn species. RT-QuIC was performed to evaluate aSyn seeding activity in detergent-insoluble brain fractions. The reaction mixture contained 1X phosphate-buffered saline (KD Medical, PBS 10X, pH 8.0), 0.0006% sodium dodecyl sulfate (SDS), 10 µM Thioflavin T (ThT), and 0.1 mg/mL recombinant human aSyn monomer (Proteos, RP-010). Prior to use, the recombinant aSyn was filtered using a 100 K cut-off centrifugal concentrator (Pierce, 88503) to remove potential aggregates and ensure monomeric protein input. Reactions were assembled in black 96-well plates with optical bottom (Nunc, 265301), preloaded with five or six low-binding silica beads (800 um, OPS Diagnostics, BLBG 800-200-03) per well. Detergent-insoluble brain fractions were diluted to 10–4 in PBS (KD Medical, Cat# RGF-3215, pH 8.0) and 5 ul was added to each well along with 95 ul of reaction mix. The plates were sealed and incubated in a FLUOstar Omega plate reader (BMG Labtech, Germany) at 42 °C, using cycles of 1-min double-orbital shaking followed by stationary incubation. ThT fluorescence was measured every 30 min at excitation/emission wavelengths of 450/480 nm over a total duration of 72 h. All RT-QuIC assays included positive and negative controls for background normalization: 0.001 mg/ml aSyn pre-formed fibrils (PFFs) and 1X PBS (KD Medical, pH 8.0), respectively. PFFs were generated in-house according to the Powers & Patel protocol [38].
After the assay, RT-QuIC plates were briefly centrifuged at 3000 rpm for 5 min to collect reaction products. Samples were then pooled per case, aliquoted and stored at −20 °C for a later PK assay.
Baseline correction was performed by averaging the fluorescence values from the first five readings for each well and subtracting this baseline from all subsequent measurements. The fluorescence threshold for a positive reaction was defined as the baseline plus five standard deviations (baseline + 5 SD) of the initial signal. A well was considered positive when the ThT fluorescence crossed this defined threshold. Each sample was tested in four technical replicates. Samples were classified as positive if three or four of the replicates crossed the fluorescence threshold. Samples with two positive replicates were considered inconclusive, and those with zero or one positive replicate were classified as negative. Seeding kinetics were analyzed by calculating the lag time (LagT), defined as the time required to reach the fluorescence threshold. Additional kinetic parameters, including time to maximum fluorescence (Time to Fmax) and T50 (time to reach 50% of the maximum fluorescence), were also calculated. LagT values were used for receiver operating characteristic (ROC) curve analysis to evaluate the diagnostic performance of the assay. Time to Fmax and T50 were only compared within PD subgroups, as most control samples did not reach the required fluorescence levels to assess these parameters.
Proteinase K (PK) assay and silver staining10µL of SAA products were digested in 0.1 µg/µL PK in TBS + 0.1% SDS for 5, 30, and 60 min. To halt digestion and prepare samples for Silver Staining, the NuPage Sample Buffer and NuPage Reducing Agent (both Invitrogen) were added at 1X, and the samples were heated at 70 °C for 10 min.
Samples and 5 µl Precision Plus Protein Dual Color Standard (Bio-Rad) diluted 1:50 in water were loaded into NuPage 12% Bis–Tris gels (Invitrogen) and separated in ice-cold 1X MES SDS Running Buffer (Invitrogen) at 200 V for 55 min. Entire samples were loaded for the 5-, 30-, and 60-min time points, but only 25% of the undigested samples were loaded to avoid saturation.
PAGE gels were stained using the Pierce™ Silver Stain Kit (Thermo Fisher) according to the manufacturer’s protocol and imaged using the pre-set Silver Stain program on the Bio-Rad ChemiDoc MP Imager. Using Bio-Rad Image Lab, the adjusted total band volumes representing signals from each timepoint were collected for analysis in Microsoft Excel and GraphPad Prism. Data are presented as a percentage of resistance: the total adjusted band pixel intensity at the 5-, 30-, 60-min timepoints were calculated as a percentage of the untreated 0-min timepoint.
Cell cultureThe FRET biosensor cell reporter assay is a highly sensitive cell-based assay used to monitor and quantify intermolecular interactions of proteins, such as aSyn, particularly those linked to neurodegenerative diseases, such as PD [34]. HEK293T biosensor cell lines expressing both CFP-aSyn and YFP-aSyn (HEK.A53T-C/Y) (Dr. Marc Diamond, UT Southwestern) were used for high-content imaging (HCI) and Fluorescence Resonance Energy Transfer (FRET) assays. HEK293T wildtype (WT) cells (ATCC) and those expressing either CFP-aSyn only (HEK.A53T-CFP) or YFP-aSyn only (HEK.A53T-YFP) (Dr. Marc Diamond, UT Southwestern) were used for controls and gating in the FRET flow cytometry assay.
All cells were cultured in OptiMEM supplemented with GlutaMAX (Gibco) + 10% fetal bovine serum (FBS; Gibco) and maintained at 37 °C in a 5% CO2 humidified incubator. Cells were routinely passaged for maintenance between 80 and 100% confluence, ~ 1–2 times per week as needed. Cells were tested for mycoplasma contamination at regular intervals.
Förster resonance energy transfer (FRET) assayHEK.A53T-C/Y cells were plated in 24-well plates at 150,000 cells/mL and incubated for 24 h. Cells were treated with 25 µl of detergent-insoluble brain homogenate fractions, sonicated with Bioruptor Plus (Diagenode) at 10 °C for 10 cycles of 30 secs on, 30 secs off and incubated for 30 min with Lipofectamine 2000 (Invitrogen), for a further 48 h. As a positive FRET control, some cells were treated with 0.1 mg/mL aSyn PFFs sonicated and prepared in the same way as the detergent-insoluble fraction-treated cells.
To prepare controls for the assay, WT HEK293 cells were transiently transfected with CFP or YFP (negative control) or CFP fused to YFP (positive control) using Lipofectamine 2000 (Invitrogen) for 48 h before flow cytometry (FC). HEK.A53T-CFP and HEK.A53T-YFP were used as additional negative controls to set the FC gates [18, 27].
To prepare samples and controls, individual wells were scraped and transferred in PBS to individual wells of a round-bottom 96-well plate. Following centrifugation, cells were stained with Zombie NIR Viability Dye (BioLegend, 1:300 dilution in PBS) for 30 min at room temperature. After incubation, cells were washed with PBS, fixed in 2% paraformaldehyde (PFA) for 15 min, and subsequently washed twice with FC buffer (PBS containing 2% FBS). Finally, cells were resuspended in the FC buffer for acquisition. Control samples were transferred to 1.5 mL tubes for setting gates and compensation, while treated samples remained in the 96-well plate for FRET acquisition.
Flow cytometry gating was established using the negative and positive cell line controls described above. WT HEK293T, HEK.A53T-CFP and HEK.A53T-YFP cells were used to define background fluorescence and set FRET-negative gates, while cells expressing CFP-YFP fusion were used to define the FRET-positive gate. A sequential gating strategy was applied uniformly. Events were first gated on forward scatter (FSC-A) versus side scatter (SSC-A) to exclude debris and identify the cell population. Gates were applied only to viable cells, as determined by Zombie NIR viability staining. Compensation for spectral spillover between CFP, YFP and FRET channels was performed using single-fluorophore control cell lines. To eliminate false-positive FRET arising from YFP bleed-through, a false-FRET gate was defined using YFP fluorophore cells. The final FRET-positive gate was established using negative control biosensor cells (CFP-YFP fusion cells) lacking seed material. Representative gating plots are provided in Supplementary Fig. 7. The FRET signal was quantified as Integrated FRET Density (IFD), calculated as the product of the percentage of FRET-positive viable cells and the median FRET intensity of those cells. This metric reflects both the extent and magnitude of aSyn seeding activity in each sample. Each sample was analyzed in five independent experiments, with three technical replicates per experiment. Technical replicates were averaged within each experiment to generate a single experimental value, and the final data point represents the mean of the five independent experiments for each sample.
High-content imaging (HCI)To visualize and quantify intracellular aSyn aggregation, HEK.A53T-C/Y biosensor cells were imaged in the Operetta high-content imaging (HCI) system (Perkin Elmer). Cells were plated in black, clear-bottom 96-well plates (Celvis) at a density of 150,000 cells/mL 24 h before applying the same treatment protocols as in the FRET assay, again using 25 uL sonicated detergent-insoluble fractions. Following 48 h of incubation, cells were washed once with PBS and fixed with 4% PFA for 15 min at room temperature. After fixation, cells were washed with PBS and stained with Hoechst 33342 (#33342, Invitrogen; 1:10,000 dilution in PBS) for 5 min to visualize nuclei, followed by two additional PBS washes.
Images were acquired in the Hoechst, CFP, and YFP channels. Excitation of CFP and emission detection of YFP were used in a FRET-based configuration available on the imaging system to detect the presence of aSyn-aSyn interactions. Punctate aggregates were identified and quantified using Harmony image analysis software (PerkinElmer). The aggregate-to-nucleus ratio was calculated by normalizing the number of aSyn-positive aggregates to the number of Hoechst-stained nuclei per field. For each sample, 121 fields per well were analyzed across five replicates, ensuring robust and reproducible quantification of intracellular aggregate burden.
aSyn Immunodepletion from brain homogenatesTo confirm the observed seeding activity was mediated by the aSyn in the brain homogenate we performed targeted immunodepletion on a randomly selected subset of brain homogenates. Protein G Dynabeads™ for immunoprecipitation (60 µL) (Invitrogen, # 10003D) were incubated with 10 µg/mL SYN211 antibody (anti–α-synuclein, Santa Cruz, # sc—12767) for 10 min at room temperature under gentle rotation. Following antibody coupling, the beads were immobilized on the magnetic rack, the supernatant was discarded, and the beads (conjugated and unconjugated) were washed once with 0.02% Tween-20 in PBS.
Brain homogenates were diluted 1:100 in PBS and sonicated for 10 min. Equal volumes of each sonicated homogenate were incubated either with SYN211-conjugated beads or with unconjugated beads for 15 min at room temperature with gentle rotation. After magnetic separation, the supernatants (depleted fractions) were collected and subjected to a second round of immunodepletion with SYN211-conjugated beads overnight at 4 °C. The depleted homogenates were collected, aliquoted, and stored at − 20 °C for WB and FRET seeding assays. Each sample was analyzed in three independent experiments for both WB and FRET assays and the values were normalized within each sample to its untreated baseline to assess relative depletion efficiency.
Western blotting (WB) of immunodepleted brain homogenatesPierce BCA Protein Assay kit (23225; ThermoFisher) was used to determine total protein concentration in diluted or immunodepleted brain homogenates. 3 μg per sample was prepared for WB with 2X Laemmli loading buffer (Bio-Rad, #1610737), and 1:10 beta-mercaptoethanol (BME) (Bio-Rad, #1610710). Samples and the biotinylated ladder (Cell Signaling, #7727) were run on a Mini-PROTEAN TGX Stain-Free gel (Bio-Rad, #4568124) and transferred to a nitrocellulose membrane (Immobilon-P, Millipore). Membranes were blocked for 1 h at RT in 10% non-fat dried milk added TBS-T (500 mM NaCl, 20 mM Tris, 0.1% Tween 20, pH 7.4) solution, incubated overnight at 4 °C with HRP anti-α-Synuclein (4B12, Biolegend) then washed with TBS-T solution and incubated for 1 h at RT with secondary antibodies (anti-biotin HRP-linked antibody (7075P5, Cell Signaling) or anti-mouse HRP-conjugated antibody (Goat anti-mouse Ig, Human ads-HRP, #1010-05, Southern Biotech)). Proteins were detected using an enhanced chemiluminescent detection system (ECL, MilliporeSigma Immobilon, #WBKLS0500) and imaged by ChemiDoc MP Imaging System (Bio-Rad). aSyn bands were identified and quantified using Image Lab software (Bio-Rad, RRID:SCR_014210), including normalization to total protein from stain-free labeling.
Statistical analysisAll data were analyzed using Graph Pad Prism 9.0.0 software (San Diego, CA). Firstly, the normality of the data was assessed using the Shapiro–Wilk test. For data distributed normally, parametric tests were applied, including one-way ANOVA followed by Tukey’s multiple comparison test for group comparisons and unpaired two-tailed Student’s t-tests for pairwise comparisons. If data did not follow a normal distribution, non-parametric tests were used: the Kruskal–Wallis test followed by Dunn’s multiple comparison test for group comparisons and the Mann–Whitney U test for pairwise comparisons. Correlations between seeding assay, biochemical measurements and LB counts were evaluated using two-tailed Spearman rank non-parametric correlations. The Spearman correlation coefficient r and the p value are indicated in the figures. Results are presented as mean ± standard deviation (SD) within a 95% confidence interval, and p < 0.05 values were considered statistically significant (*p ≤ 0.05, **p ≤ 0.01, ***p ≤ 0.001, ****p ≤ 0.0001). P values between 0.05 and 0.1 are indicated in the figures.
Comments (0)