
Remember me
To enable high-resolution NMR study of the Fc fragment, samples uniformly and specifically enriched with 13C and 15N were produced in vitro using a cell-free system. As previously described (Giraud et al. 2024), the cell-free reaction mixture can be supplemented with the disulfide bond isomerase DsbC, and its redox potential can be controlled to ensure the formation of the native disulfide bridges topology of mAb fragments. After optimization of expression and purification conditions, a yield of 0.4 mg of Fc per mL of cell-free reaction was achieved at natural isotopic abundance. The open nature of the cell-free system also enabled tailored isotopic labelling strategies, including residue-specific and stereospecific labelling.
To assign the methyl group resonances of the 50-kDa Fc fragment, we employed a multi-step strategy combining backbone-to-methyl transfer techniques via 3D TOCSY and COSY experiments with NOESY-based spatial correlation (Liu et al. 2007a, b; Sarker and Aubin 2024; Gagné et al. 2024; Ghasriani et al. 2022; Henot et al. 2025). The assignment of backbone amide resonances of the non-glycosylated human IgG1 Fc had already been undertaken by Liu et al., resulting in the assignment of 93% of Cα and 92% of Cβ resonances from methylated amino acids (Liu et al. 2007a). To validate the backbone assignment on the 2D 1H-15N HSQC spectrum acquired on the Fc fragment produced in a cell-free system, 3D BEST-TROSY HNCO and HNCA experiments were acquired on a 0.3 mM U-[15N, 13C] Fc sample. As a result, NH backbone resonances were assigned to their corresponding amino acids for 90% of the Fc’s methylated amino acids (Fig. S2).
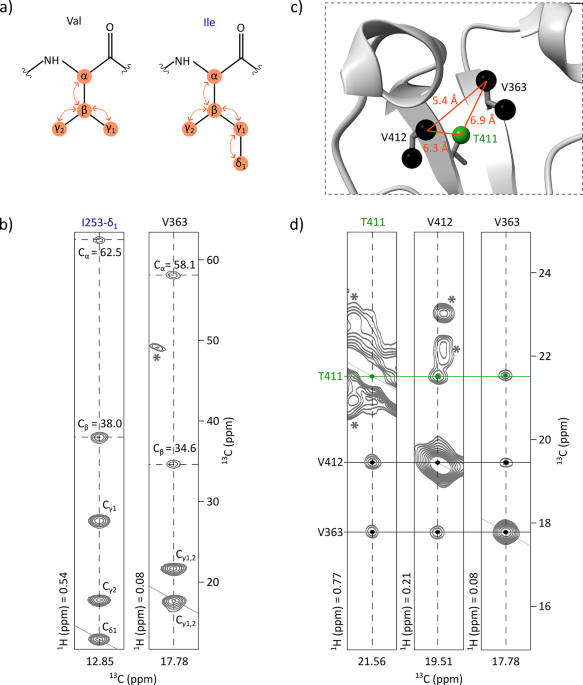
To facilitate the methyl group assignment, 2D 1H-13C spectra were acquired on four Fc samples specifically labelled on Ala-β, Ile-δ1 and Thr-γ, Met-ε and Val-γ1,2, and Leu-δ1,2. An hCCH TOCSY experiment was acquired on a 0.7 mM U-[15N, 13C] Fc sample, enabling the connection of signals from the 2D 1H-13C SOFAST-HMQC methyl spectrum to the side-chain carbon resonances of the corresponding methylated residues (Fig. 1a and b). By comparing the retrieved Cα and Cβ resonances with published data (Liu et al. 2007a), 42% of the methylated residues were assigned, including 71% of alanines, 75% of isoleucines, 42% of leucines, 44% of threonines, and 26% of valines with at least one assigned methyl group. Despite the high coverage of backbone assignments, the transfer to methyl signals was limited by lack of deuteration, signal overlap, and discrepancies with published chemical shifts, which made assignment transfer ambiguous in crowded regions of the methyl spectrum.
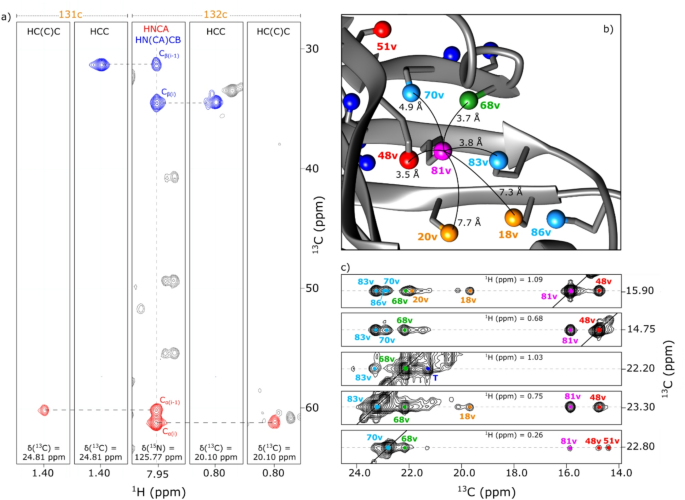
Fig. 1 The alternative text for this image may have been generated using AI.
Methyl group assignment strategy for the non-glycosylated Fc fragment. (a) Scheme of the magnetization transfer (represented with orange arrows) occurring during TOCSY mixing time in valine and isoleucine residues. (b) Assignment transfer from the backbone to methyl groups using an hCCH-TOCSY experiment acquired on a U-[15N, 13C] sample. 2D extracts are displayed correlating previously assigned Cα and Cβ resonances to the methyl resonances of V363 and I253. Asterisks indicate signals outside of the considered plans. (c) Zoom on V412, V363, and T411 extracted from the 3D structure of the non-glycosylated Fc fragment (PDB: 3DNK) showing Ala-β, Ile-δ1, Val-γ1, Val-γ2, Thr-γ and Met-ε methyl groups. (d) 2D extracts from a 3D HMQC-NOESY-HMQC experiment acquired on an Fc fragment labelled on Ala-[13C1H3]β, Ile-[U-2H; [13C1H3]δ1], Met-[13C1H3]ξ, Thr-[U-2H; [13C1H3]γ], and Val-[U-2H; [13C1H3]γ1/γ2] showing NOE cross-peaks between V363, V412, and T411. Asterisks indicate signals outside of the considered plans
These assigned methyl resonances were used as a starting point for the analysis of a 3D methyl-methyl CCH NOESY experiment acquired on an Fc sample labelled as follows: Ala-[13C1H3]β, Ile-[U-2H; [13C1H3]δ1], Met-[13C1H3]ξ, Thr-[U-2H; [13C1H3]γ] and Val-[U-2H; [13C1H3]γ1/γ2]. NOE cross-peaks revealed spatial proximity (≤ 10 Å) between methyl groups of alanines, isoleucines-δ1, methionines, threonines, and valines that are close in space. Signals were manually analysed using the 3D structure of a non-glycosylated Fc fragment (PDB: 3DNK), along with the amino acid types of each methyl signal previously determined from specifically labelled Fc samples (Fig. 1c and d). By combining these data with the previously assigned methyl resonances, assignment was achieved up to 100% for alanines, isoleucines, and methionines, and at 69% for threonines. However, no leucines and only 13% of additional valines were assigned. This was mainly due to the labelling scheme: leucines were not labelled and half of the valines were labelled on γ1 and the other half on γ2, decreasing the expected NOE cross-peak intensity by a factor of four for valine-valine pairs and by a factor of two for valine-non-valine pairs. To further complete the assignment, two additional samples were prepared, labelled respectively on Leu-[U-13C; [13C1H3]δ1,δ2] and Val-[U-2H; [13C1H3]γ1,γ2], and similar NOESY experiments were acquired. These additional datasets not only enabled the correlation of the two methyl signals for each leucine and valine residue, but also confirmed previously ambiguous amino acid assignments (Fig. S3). Furthermore, they enabled the assignment of additional methyl group resonances for valines and leucines, as some of these residues are clustered within the Fc structure. Ultimately, at least one methyl resonance was assigned for 100% of valine and 95% of leucine residues. The complete assignment strategy is summarized in Fig. S4.
By combining all these experimental data and labelling strategies, we achieved a remarkably high assignment coverage of the methyl resonances of the non-glycosylated Fc fragment produced using a cell-free system. Specifically, 94% of the methyl signals were successfully assigned, representing a comprehensive mapping of the structural probes within this 50-kDa fragment (Fig. 2). Only three threonine and one leucine residues remained unassigned. This near-complete assignment provides a robust foundation for structural investigations of the Fc region. It not only enables high-resolution analysis of the non-glycosylated Fc form but also represents a strategic step toward extending investigations to more physiologically relevant systems. To achieve this, it is essential to transfer the methyl resonance assignment to glycosylated Fc fragments produced in CHO cells at natural isotopic abundance. This would enable direct monitoring of structural integrity and the detection of stress-induced modifications directly on therapeutic mAb batches during development and manufacturing.
Fig. 2 The alternative text for this image may have been generated using AI.
Assigned 2D 1H-13C SOFAST HMQC spectrum of the non-glycosylated Fc fragment produced using a cell-free system. This spectrum is a superimposition of four spectra of the Fc fragment labelled on Ala-[13C1H3]β, Ile-[13C1H3]δ1 and Thr-[13C1H3]γ, Leu-[13C1H3]δ1,δ2, and Met-[13C1H3]ε and Val-[13C1H3]γ1/γ2 together with a zoom on Ile-γ2 region from a spectrum acquired on a U-[15N, 13C] Fc sample. Alanine, isoleucine, leucine, methionine, threonine, and valine resonances are depicted respectively in red, blue, orange, purple, green, and black. Signals depicted in grey and annotated with an asterisk correspond to impurities. Each assigned signal is annotated with the corresponding residue number. The contour level of signals in the orange rectangle has been multiplied by a factor of 3
Assignment transfer to a glycosylated Fc fragment produced in CHO cellsBuilding on the methyl assignment of the non-glycosylated Fc fragment, we extended our analysis to glycosylated Fc fragments at natural abundance derived from monoclonal antibodies produced in CHO cells, conditions that closely reflect industrial production processes. Since all IgG1 antibodies share the same Fc fragment, the assignment obtained for the Fc produced in a cell-free system can, in principle, be transferred to any IgG1. However, glycosylation being attached to the CH2 domain, chemical shift perturbations may affect methyl signals for residues in this region, highlighting the need for a careful assignment transfer. To ensure high-quality methyl spectra suitable for assignment transfer and atomic-scale analysis, the 50-kDa Fc fragment was used instead of the full 150-kDa monoclonal antibody. This choice enabled an increase of the acquisition time in the carbon dimension from 8 to 21 ms, improving spectral resolution while maintaining a good signal-to-noise ratio (Fig. 3). Interestingly, all Fc methyl signals overlapped with those of the mAb, further supporting the use on this divide-and-conquer strategy.
Fig. 3 The alternative text for this image may have been generated using AI.
Superimposition of 1H-13C SOFAST methyl spectra of anti-LAMP1 mAb in black with its Fc fragment in blue. To generate the Fc fragment, the mAb was cleaved above the hinge between T223 and H224 using an IgdE enzyme (FabALACTICA™, Genovis). Spectra were acquired on samples at natural abundance on an 800 MHz spectrometer, with an acquisition time in carbon dimension of 8 ms for the mAb and 21 ms for the Fc
The methyl group assignment of the crystallisable fragment was transferred from the isotopically labelled, non-glycosylated Fc produced in a cell-free system to the glycosylated Fc obtained by enzymatic cleavage of a mAb produced in CHO cells (Fig. S5). Overlaying the 2D methyl spectra of both Fc constructs enabled successful assignment transfer for 86% of alanines, 100% of isoleucines, 94% of leucines, 100% of methionines, 77% of threonines, and 83% of valines, resulting in an overall assignment of 83% of methylated residues in the glycosylated Fc spectrum (Fig. 4). The main limitation arises from the difficulty of transferring assignments in crowded regions of the spectrum, further complicated by the low intensity of some methyl signals in the spectrum acquired on the Fc sample at natural abundance. This low intensity can be partly due to the glycan heterogeneity, decreasing the intensity of the signals impacted by the glycans. Nevertheless, all well-resolved signals in non-crowded regions were successfully assigned.
Fig. 4 The alternative text for this image may have been generated using AI.
(a) Assigned 1H-13C ALSOFAST methyl spectrum of the glycosylated Fc fragment from anti-LAMP1 mAb produced in CHO cells at natural abundance. The two signals annotated with a green asterisk correspond to methyl groups of N-acetylglucosamine (GlcNAc) moieties from the glycans. (b) Fc structure (PBD: 3JII) showing the residues with important shift of methyl resonances between the 1H-13C spectrum of the non-glycosylated Fc fragment produced in a cell-free system and the spectrum of the glycosylated Fc fragment from anti-LAMP1 produced in CHO cells. Glycans are represented in blue. Methyl groups are represented by spheres. Non-methylated amino acids and non-assigned methylated amino acids are in grey, assigned methylated amino acids are in black when CSP < 0.03 ppm and in red when CSP ≥ 0.03 ppm. CSP values between glycosylated and non-glycosylated Fc were calculated using the following formula: \(\:CSP=\sqrt_^+_}\right)}^}\). For residues with two methyl groups (isoleucines, leucines, and valines), the average CSP was used when both signals were assigned
Interestingly, two additional signals were detected in the glycosylated Fc spectrum that were absent in the non-glycosylated one (signals marked with asterisks in Fig. 4). To investigate their origin, we acquired a methyl spectrum of a deglycosylated Fc fragment, obtained from a CHO-produced mAb, and compared it to the spectrum of its glycosylated counterpart. While most of the peaks were either perfectly superimposed or slightly shifted due to structural changes upon deglycosylation, the two signals of interest completely disappeared, confirming their assignment to the methyl groups of N-acetylglucosamine moieties from the glycans (Fig. S6).
To further characterise the structural differences between the two Fc constructs, chemical shift perturbations (CSPs) were calculated for each assigned methyl signal (Fig. S7). As expected and illustrated in Fig. 4, the largest perturbations were observed for residues located in the CH2 domain, where glycans are attached. Despite these local changes, the successful transfer of methyl assignments by the simple overlay of the two 2D spectra demonstrates the feasibility of atomic-resolution NMR analysis of glycosylated IgG1 antibodies at natural abundance. The successful transfer of methyl group assignments to glycosylated Fc fragments of mAbs produced in CHO cells at natural isotopic abundance represents a major step forward for the structural characterization of therapeutic monoclonal antibodies under native-like conditions. This assignment enables the precise localisation of structural modifications, such as those induced by stress, degradation, or interaction with antigens or receptors, directly within the 3D structure of the Fc region, without the need for isotopic labelling. Such capability will be particularly valuable in the context of quality control and comparability assessments during mAb development. By overlaying methyl NMR spectra from different production batches, it becomes possible to detect subtle conformational changes and identify specific residues affected by post-translational modifications or process-related variations. This atomic-level resolution will provide a powerful analytical tool to ensure batch consistency, monitor structural integrity, and support regulatory compliance throughout the development of therapeutic antibodies.
Studying the effects of methionine oxidation on the Fc fragment by NMRThe methyl group assignment established for the glycosylated Fc fragment produced in CHO cells provides a powerful tool for probing structural changes directly on therapeutic mAb batches. This approach is particularly relevant during the pharmaceutical development of new antibodies, where standard stress protocols are applied to simulate harsh storage conditions and assess molecular stability. Notably, methionine oxidation was observed following stress exposure and was found to impact pharmacokinetics (Stracke et al. 2014) and complement-dependent cytotoxicity activity (Mo et al. 2016; unpublished internal data). As reported in the literature, oxidation is among the most frequent chemical modifications affecting mAbs during production and storage and can alter biological activity (Nowak et al. 2017; Torosantucci et al. 2014). Moreover, NMR has already proven to be a powerful tool for monitoring the effect of methionine oxidation on mAb batches. For instance, 2D methyl fingerprints of model NISTmAb were analysed following complete methionine oxidation, revealing not only strong differences in the methionine signals region, but also chemical shift changes in other regions of the spectrum (Solomon et al. 2023). This study hypothesized that oxidation could affect the local structure surrounding the oxidized methionines; however, no site-specific information could be obtained due to the lack of methyl group assignment. On the Fc region, 2D 1H-15N spectra were compared upon methionine oxidation using non-glycosylated Fc fragments produced in E. coli and uniformly isotopically labelled with 2H, 15N, and 13C (Liu et al. 2008). The methyl group assignment of the Fc fragment from a mAb produced in CHO cells at natural abundance now provides a straightforward and efficient approach to identify amino acids affected by methionine oxidation, by overlaying 2D spectral fingerprints and detecting shifts in methyl signals, directly on mAb batches from biotherapeutic production pipelines.
To investigate the impact of methionine oxidation on the higher-order structure (HOS) of the mAb, particularly within the Fc region, partial chemical oxidation was induced by incubating overnight the anti-LAMP1 mAb with 2.4% (v/v) tBHP. Following mAb cleavage, SEC-MS intact mass spectrometry analysis of the fragments revealed near-complete oxidation of the two methionines of the Fc, M252 and M428, and no oxidation in the Fab fragment (Fig. S8). A 2D methyl NMR spectrum of the oxidized Fc was acquired and compared to the native Fc spectrum (Fig. 5).
Fig. 5 The alternative text for this image may have been generated using AI.
(a) Superimposition of 1H-13C ALSOFAST methyl spectra of the glycosylated Fc fragment from anti-LAMP1 mAb before (in black) and after (in blue) methionine oxidation. Orange circles indicate assigned methyl resonances for which CSP values are above 0.01 ppm. Upon oxidation, methionine signals shift outside of the spectrum window. Asterisks indicate signals for which the contour level was multiplied by a factor of 2. (b) Impact of methionine oxidation shown on the structure of a glycosylated Fc fragment (PBD: 3JII). Methyl groups are represented by spheres. Non-methylated amino acids and non-assigned methylated amino acids are in grey, assigned methylated amino acids are in black when CSP < 0.01 ppm and in orange when CSP ≥ 0.01 ppm, and methionines are in purple. For amino acids with two methyl groups (isoleucines, leucines, and valines), average CSPs were used when both signals were assigned
The signals corresponding to M252 and M428 were no longer visible, having shifted from around δH = 2.0 ppm/δC = 17.0 ppm to around δH = 2.6 ppm/δC = 39.9 ppm, outside the typical methyl spectral window. After transferring the assignments from the native to the oxidized Fc spectrum, chemical shift perturbations were calculated for all assigned methyl signals (Fig. S9). Although some assignments could not be transferred due to signal overlap or low intensity, CSPs were successfully calculated for 78% of methylated residues. While most CSPs were rather weak, several signals showed significant shifts. The corresponding amino acids are shown in orange on the Fc structure (Fig. 5). These residues were found to be located around the oxidized methionines, in both CH2 and CH3 domains, indicating localised structural changes near the oxidized M252 and M428. No long-range effects were observed, confirming that oxidation-induced changes are spatially restricted. This newly developed NMR approach enabled the straightforward identification of residues impacted by this stress, simply by overlaying 2D methyl spectra acquired directly on the Fc fragment of industrial mAb batches at natural abundance.
Comments (0)