
Remember me
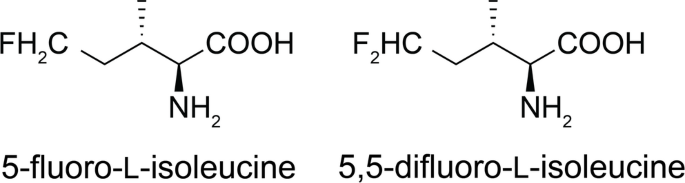
To compare the rate of hydrolysis of FIle with those of the previously used amino acids (2S,4S)-5-fluoroleucine (FLeu1) and (2S,4R)-5-fluoroleucine (FLeu2; Tan et al. 2024; 2025), we incubated the HCl salts of FLeu1 and FLeu2 under the same conditions (55 mM HEPES buffer pH 7.5, 30 °C), monitoring the heights of the fluorine signals and the appearance of inorganic fluoride. In these experiments, FLeu1 remained unaltered after 1 h and FLeu2 lost less than 10% of its 19F-NMR signal with the concomitant appearance of fluoride.
1D 19F-NMRUnless mentioned otherwise, all NMR spectra were recorded on a 500 MHz NMR spectrometer equipped with a cryoprobe. Figure 2 shows the 1D 19F-NMR spectra of R3H-F and R3H-F2. The spectra recorded with 1H decoupling (Fig. 2a and c) show evidence of sample heterogeneities as expected, if the 19F chemical shifts are sensitive to the presence or absence of other fluorinated residues in the vicinity. Nonetheless, the different species detected in the spectrum of R3H-F2 (Fig. 2c) show very similar chemical shifts, suggesting that the different species differ more subtly than expected for the different diastereomers of the diFIle amino acid used to produce the protein (Figure S1) and vindicating the assumption that the isoleucyl-tRNA synthetase and the peptidyl-transfer centre of the ribosome select the diastereomer of canonical isoleucine.
Without decoupling, the spectrum of R3H-F shows three main peaks of similar size (Fig. 2b). The sample precipitated during the NMR measurements, reducing the signal intensity to a third over the course of 4.5 days. In the case of R3H-F2, the undecoupled spectrum (Fig. 2d) shows basically the same signals as the spectrum recorded with 1H decoupling (Fig. 2c) except for broader apparent line widths and the presence of a new signal at -114.4 ppm, which increased as the sample precipitated during NMR measurements. Only the large 2JFF coupling was resolved in the spectra of R3H-F2, whereas the 2-bond and 3-bond 1H−19F couplings observed for the free amino acid (Figure S1) remained unresolved. After 4.5 days of NMR measurements, the signal intensity was reduced about five-fold due to sample degradation.
Fig. 2 The alternative text for this image may have been generated using AI.
1D 19F-NMR spectra of R3H-F and R3H-F2 recorded at 25 °C. (a) Spectrum of R3H-F recorded with 1H decoupling, using 223 scans. The initial sample concentration was about 800 µM. (b) Same as (a), but without decoupling. 1024 scans. (c) Spectrum of R3H-F2 recorded with 1H decoupling. 2024 scans. The initial sample concentration was about 500 µM. (d) Same as (c) but recorded 4.5 days later without decoupling. 20,240 scans. Sample degradation was indicated by greatly decreased sensitivity and the new peak at -114.4 ppm
The line widths at half maximum were as narrow as 15 Hz for R3H-F (50 Hz for the broad signal at -215.6 ppm) with 1H decoupling (Fig. 2a). The line widths of R3H-F2 were about 30 Hz (Fig. 2c). A measurement of T1ρ(19F) using a CPMG train of 180o(19F) pulses spaced by 2 ms delays yielded values of 21 ms, 41 ms and 12 ms for residues 733, 761 and 780, respectively. Without 1H decoupling, the line widths at half maximum were about 140 Hz in R3H-F and 120 Hz in R3H-F2 (Fig. 2b and d). The broader signal envelope in R3H-F is expected for the presence of two large 2JHF couplings rather than one. To probe the impact of the second fluorine in diFIle on longitudinal relaxation, we performed inversion-recovery experiments with R3H-F2, which yielded T1(19F) values ranging between 0.2 and 0.3 s (with residue 780 relaxing most rapidly and residue 733 slightly faster than residue 761). The sample heterogeneities and limited sample lifetimes made it challenging to record 2D NMR spectra.
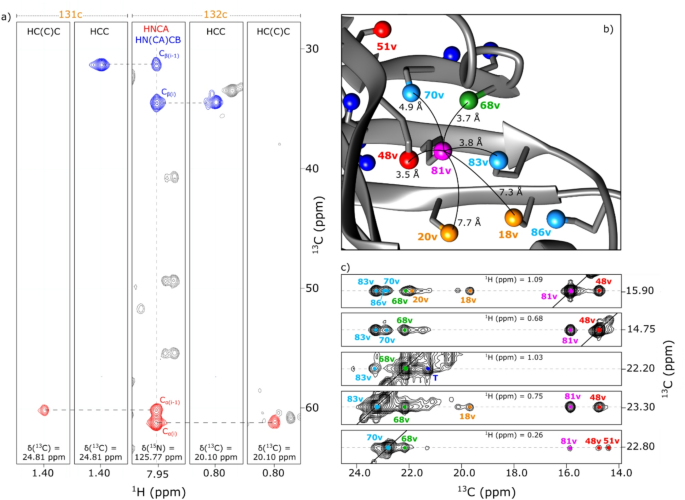
2D NMR of R3H-FA NOESY spectrum of R3H-F confirmed the conservation of its three-dimensional structure by the conservation of 1H chemical shifts and NOE patterns. The 19F-NMR resonances were assigned by a short-delay 1H,19F correlation experiment (Tan et al. 2024), which yielded cross-peaks with the protons of the CδH2F and Cγ1H2 groups (Fig. 3a). The spectrum shows the 1H-NMR signals of the CδHF2 groups between 3 and 4.5 ppm and of the Cγ1H2 groups between 0.5 and 2.5 ppm. Comparison of the 1H chemical shifts observed in this spectrum with those of the wild-type R3H domain reveals conservation of the relative chemical shifts of the 1H resonances of the FIle side chains. For example, in the wild-type protein, the 1H-NMR signals of the Cγ1H2 and CδH3 groups of Ile780 are significantly shifted upfield by ring-currents from His759, while the 1H-NMR signals of Ile733 and Ile761 are closer to each other with those of Ile733 slightly more down-field. Furthermore, Ile733 features a larger difference in chemical shifts between its γ1-protons than Ile761. The same features are recapitulated in the spectrum of Fig. 3a.
The attempt to detect through-space scalar 19F−19F couplings in R3H-F between residues 733 and 761 by [19F,19F]-TOCSY spectra failed. Figure 3b shows that the only cross-peaks detected were with minor signals at about − 217 ppm. The most plausible interpretation of these cross-peaks is their origin in chemical exchange rather than scalar couplings, as a [19F,19F]-TOCSY spectrum recorded with 70 ms mixing time did not yield significantly increased cross-peaks as expected for the tan2(πJτm) dependence of the intensity ratio of TOCSY cross-peaks over diagonal peaks, where τm is the mixing time (Braunschweiler and Ernst 1983). As cross-peaks associated with small through-space couplings feature with much greater intensity in TOCSY than NOESY spectra (Orton et al. 2021; Tan et al. 2024, 2025; Abdelkader et al. 2025), we also recorded a [19F,19F]-NOESY spectrum. This spectrum showed the same cross-peaks with similar intensities relative to the diagonal peaks (Figure S3). As the cross-peaks with residues 733 and 761 do not line up exactly, the respective exchange peaks appear to be with two different unidentified minor species with slightly different chemical shifts near − 217 ppm.
Fig. 3 The alternative text for this image may have been generated using AI.
2D NMR spectra of R3H-F. (a) Short-delay 1H,19F correlation experiment (Tan et al. 2024). Parameters used: Δ1 = 7 ms, Δ2 = 2.5 ms, t1max = 7 ms, t2max = 102 ms, total recording time 2 h. The 1D 19F-NMR spectrum is plotted at the top with the resonance assignments. (b) [19F,19F]-TOCSY spectrum. Parameters used: 43 ms mixing time (DIPSI-2 mixing), t1max = 5.4 ms, t2max = 102 ms, total recording time 10.5 h
Fig. 4 The alternative text for this image may have been generated using AI.
NMR spectra of R3H-F2. (a) 19F-19F DQF-COSY spectrum. The 1D 19F-NMR spectrum of Fig. 3c is plotted at the top with the resonance assignments. Parameters used: t1max = 6.7 ms, t2max = 106 ms, total recording time 2.5 h, processing with 40 Hz line broadening in both dimensions. (b) Short-delay 1H,19F correlation experiment (Tan et al. 2024). Parameters used: t1max = 6.9 ms, t2max = 86 ms, Δ1 = 7 ms, Δ2 = 2.5 ms, total recording time 8 h. The cross-peaks of residue 780 have the opposite sign because the chemical shift degeneracy prevents evolution under the 2JFF coupling during the refocussing INEPT period of the experiment
2D NMR of R3H-F2The 2D 19F-19F DQF-COSY spectrum shows that the diFIle residues in positions 761 and 733 display 19F chemical shifts differing by 3.3 and 5.1 ppm, respectively, whereas the 19F chemical shifts of the CHF2 group of residue 780 are degenerate (Fig. 4a). The short-delay 1H,19F correlation experiment shows the 1H-NMR signals of the CδHF2 groups at about 5.7 ppm and of the Cγ1H2 groups between 1.5 and 2.5 ppm (Fig. 4b). As in the case of R3H-F, the relative 1H chemical shifts observed in the wild-type protein are reiterated in R3H-F2 and we based the 19F NMR resonance assignments on this. The CδHF2 groups of residues 761 and 733 show different cross-peak intensities with the different γ1-protons, indicating that the 3JHF couplings are not averaged by rotation of the CHF2 groups. Instead, they preferentially populate conformations that produce large 3JHF couplings for some of the 19F spins and small 3JHF couplings for others.
Comments (0)