
Remember me
Direct comparisons between catalysts in this field is challenging as rates are reported under individually selected and/or optimized conditions. Analysis of the literature shows many require high CO2 pressures and moderate temperatures, challenging the selection of catalysts operating at the low pressures and higher temperatures desirable for scale-up (Supplementary Fig. 1). To select catalysts suitable for in-depth kinetic investigations of CO2 pressure dependence, we evaluated the literature for catalysts with precedent for good activity (turnover frequency >100 h−1) and selectivity (>90%) at low CO2 pressures (≤10 bar) (Supplementary Fig. 1 and Supplementary Table 2). We also selected catalysts that retain their performances at medium to high temperatures (45–100 °C), so as to maximize rates while minimizing polymer viscosity29. From a long list of catalysts showing optimum performances at pressures below 30 bar, catalysts 1–4 were selected13,33,34,41. They fulfil the performance criteria, are synthetically accessible and represent different classes including both mono-metallic or multi-metallic catalysts and catalysts operating with or without cocatalysts (Fig. 2). The rates for each of these catalysts were determined under varied CO2 pressures (2–30 bar) and using otherwise identical conditions33,34,41. The results of these experiments are compared to the previously reported Co(III)K(I) catalyst 5 for which the CO2 insertion equilibrium was proposed13 (Fig. 2).
Fig. 2: Catalysts studied in this work. The alternative text for this image may have been generated using AI.
The structures and key data for the catalysts 133, 234, 334, 441 and 513. The figure includes turnover frequency (TOF) and selectivity for polycarbonate data at the lowest carbon dioxide pressure reported in the original publications. tBu, tertiary butyl (–C(CH3)3); OBzF5, pentafluorobenzoate (–OCOC6F5); Ph, phenyl (–C6H5); PPNCl, bis(triphenylphosphine)iminium chloride; OAc, acetate (–OCOCH3).
All these leading catalysts are cobalt complexes, as it outperforms other metal choices21,33,35,42 (Supplementary Table 2). Since the leading commercial epoxide is PO, PO–CO2 ROCOP catalysts were investigated first9,35. However, the copolymerization of CHO (CHO–CO2 ROCOP) is also a commonly used catalyst benchmark in the field, hence catalyst 3 was investigated for CHO–CO2 ROCOP34.
KineticsCatalysts 1–5 were prepared according to literature procedures13,33,34,41, characterized using infrared and ultraviolet-visible light spectroscopy and, where possible, using 1H and 13C NMR spectroscopy (Supplementary Figs. 2–33).
To investigate whether catalysts 1–4 exhibit behaviours consistent with a metal-alkoxide and CO2 insertion equilibrium, kinetic analyses were conducted using each catalyst. All reactions were conducted in neat epoxide since these conditions are desirable at scale (no organic solvents). Catalysts should also control the polycarbonate molar mass, dispersity and polymer chain end-groups, specifically maintaining activity when using excess (di)alcohols, controlling for (di)hydroxyl polymer end-groups43. All polymerizations were therefore conducted in the presence of trans-1,2-cyclohexanediol in neat epoxide, that is [catalyst]:[diol]:[epoxide] = 1:20:4,000 at 50 °C.
Taking catalyst 2 as a representative example of the experiments conducted for each of the catalysts, first, a series of polymerizations were conducted under CO2 pressures from 2 bar to 25 bar. At a fixed pressure, polymerizations were monitored using in situ infrared spectroscopy allowing for the calculation of a pseudo first-order rate constant, kobs, from the semi-logarithmic plot of ln([epoxide]/[epoxide]0) versus time (Fig. 3b,c). Experiments were conducted at least in duplicate to enable quantification of errors. Next the kobs values were plotted against the applied CO2 pressures, showing a linear increase in rate from 2–14 bar (Fig. 3d). The same data plotted as ln(kobs) versus ln(P(CO2)) have a gradient of 0.97, indicating a first-order rate dependence on CO2 pressure (Fig. 3e). At pressures above 14 bar CO2, the rates were constant and no further increase in kobs was observed. Above the threshold pressure (14 bar), Pthreshold, there is a zero-order dependence on CO2 pressure (Fig. 3d). Polymerization rates were also plotted against [CO2], showing the same trends13,44 (Supplementary Figs. 43–46).
Fig. 3: Kinetic analysis conducted using catalyst 2. The alternative text for this image may have been generated using AI.
a, Structure of catalyst 2. b, In situ infrared spectrum, showing the peaks corresponding to PPC (1,750 cm−1). c, Exemplar semi-logarithmic plot of [PO]/[PO]0 versus time, where the rate constant, kobs, is the slope of the graph, using the rate data for the polymerization at 25 bar CO2. It has previously been shown that values for such initial rates compare very well with integrated rates determined over wider conversion ranges (20–80%)51. d, Experimentally determined rates (kobs) versus P(CO2). All rate constants were determined as the average of n = 2 independent runs, with errors indicated as ± the standard error from the mean, typically falling ±10%. kmax is the maximum polymerization rate constant, determined as the mean of the kobs values in the CO2 pressure independent regime. e, Plot of ln(kobs) versus ln(P(CO2)) showing a gradient of 0.97. All ln(kobs) values were determined from kobs values obtained as the average of n = 2 independent runs, with errors indicated as ± the standard error from the mean. f, Concentration versus time plot showing the excellent agreement between the experimental data and data generated using the rate law and modelled using COPASI software (Supplementary Fig. 34 and Supplementary Tables 3–6).
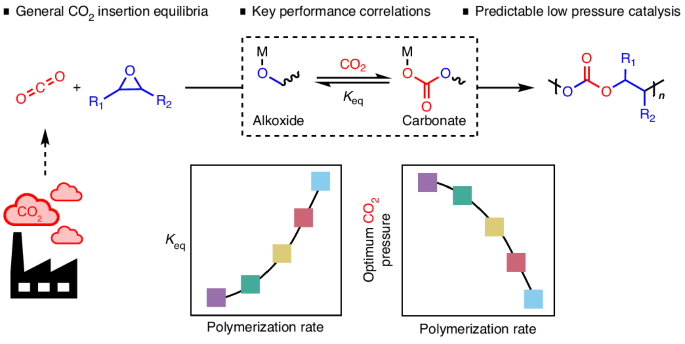
The experimental kinetic data for all the catalysts were collected and analysed in the same way as for catalyst 2. All catalysts showed two different regimes of activity versus CO2 pressure, and for each catalyst a threshold pressure was identified as the lowest operating pressure for maximum rates (Supplementary Figs. 43–46). These kinetic data indicate that catalysts 1–4 all show metal-alkoxide and CO2 insertion equilibria (Fig. 1b). These data are interpreted by low pressures resulting in CO2 insertion equilibria controlling the effective concentration of the carbonate intermediate, which is the key intermediate in the catalytic rate-determining step. Above the threshold CO2 pressure, the equilibrium lies towards the carbonate and maximum rates result13.
The CO2 insertion equilibrium constant was determined for all five catalysts in the same way. In brief, in the CO2 pressure independent regime, the equilibrium lies entirely towards the carbonate intermediate, hence [catalyst]0 = [carbonate], assuming the catalyst can only be speciated as an alkoxide or carbonate intermediate (that is, no catalyst decomposition occurs). The carbonate intermediate concentration at a given pressure, [carbonate]p, was determined from the ratio of the rate constant at that pressure and the maximum rate constant, multiplied by maximum carbonate concentration. Accordingly, the CO2 insertion equilibrium constant, Keq, was determined at each pressure and an average value determined (Supplementary Tables 7–12).
$$_}}=\frac}]}}][}}_]}$$
(1)
The five catalysts show Keq values that vary from 0.25 ± 0.02 M−1 for catalyst 4 to 3.10 ± 0.26 M−1 for catalyst 3 (Supplementary Tables 7–12). A common rate law was proposed that accounts for the influence of the CO2 insertion equilibrium and the concentration of the metal-alkoxide intermediate: this rate law applies at all CO2 pressures (equation 2). Next, for each catalyst the experimental conversion versus time data was compared to data modelled using the rate law (Fig. 3f for catalyst 2 and Supplementary Fig. 34). All catalysts showed an excellent agreement between the experimental and kinetic model data over the entire data range. This finding, applicable to all five catalysts, underscores the generality of the rate law and utility of quantifying the CO2 insertion equilibria (Keq).
$$}=_}}_}}\left[}\right][}}_]\left[}\right]$$
(2)
Variable substrate concentration-rate dependencies, observed with CO2 pressure in this work, are also known in other fields, for example enzyme kinetics45. The data for catalyst 2 were also fit using a Michaelis–Menten kinetic model. Plotting the initial rate, vi, against [CO2], and fitting with the Michaelis–Menten model, revealed Keq = 0.49 M−1 and vmax = 6.6 × 10⁻⁴ Ms−1, which are in good agreement with the values for Keq = 0.62 ± 0.09 M−1 and vmax = 5.8 × 10⁻⁴ Ms−1 determined using the rate law presented in this work (Supplementary Fig. 52). The benefit of using our experimental and kinetic methods are that they directly determine the carbon dioxide insertion equilibrium constant Keq and the threshold CO2 pressure Pthreshold, the latter is absent from saturation kinetic models.
Generality of metal alkoxide and CO2 insertion equilibriumAccording to the common rate law, the CO2 insertion equilibrium constant directly correlates with the polymerization rate. Therefore, we plotted the CO2 insertion equilibrium constant, Keq, for each of catalysts 1–5, against their rates, measured at 5 bar CO2 and 50 °C (kobs,5 bar). The plot reveals a clear exponential correlation between carbon dioxide insertion equilibrium constant and rate (Fig. 4b and Supplementary Fig. 53). The highest performing catalyst (3) exhibits the highest CO2 insertion equilibrium constant, 3.10 ± 0.26 M−1. Conversely, the lowest performing catalyst (4) has the lowest CO2 insertion equilibrium constant, 0.25 ± 0.02 M−1 (Fig. 4b–d).
Fig. 4: Relating the CO2 insertion equilibrium constant, Keq, to polymerization rates. The alternative text for this image may have been generated using AI.
a, General reaction scheme for epoxide–CO2 ROCOP showing the proposed CO2 insertion equilibrium between a Co-alkoxide and a Co-carbonate intermediate. b, Plot showing all catalysts and values for Keq versus kobs at 5 bar CO2 pressure and 50 °C. All kobs values were determined as the average of n = 2 independent runs, with errors indicated as ± the standard error from the mean, typically falling ±10%. Values for Keq and corresponding errors were calculated as indicated in Supplementary Tables 7–12. c, Plot showing data for all catalysts with Pthreshold versus Keq. Values for Keq and corresponding errors were calculated as indicated in Supplementary Tables 7–12. d, Plot showing data for all catalysts with Pthreshold versus kobs, at 5 bar CO2 pressure and 50 °C. All kobs values were determined as the average of n = 2 independent runs, with errors indicated as ± the standard error from the mean, typically falling ±10%. In all plots, squares represent PO–CO2 ROCOP and triangles represent CHO–CO2 ROCOP. The symbol colours correspond to the catalysts colour with their associated numbering as defined in Fig. 2. Data for catalyst 5 were taken from ref. 13.
These activity correlations underline the importance of CO2 insertion equilibria across the different catalysts and provide a new way to compare and design better catalysts. To interpret the data, a mechanism whereby the rate-determining step involves catalyst carbonate attack on the epoxide is invoked (Fig. 1b). The concentration of this key catalyst species (metal carbonate) is controlled by the CO2 insertion equilibrium. Thus, catalysts with favourable CO2 insertion equilibria, for example catalyst 3, show greater catalytic performance. The slower and less selective catalysts, for example catalysts 1 or 4, show low CO2 insertion equilibrium constants, consistent with higher concentrations of residual alkoxide intermediate.
The threshold CO2 pressure, Pthreshold, values describe the minimum CO2 pressure to achieve the maximum rate. These values are likely to be very important to any process to make polymers1,4,5,6. The values vary considerably for catalysts 1–5 from 7–16 bar CO2. Plotting, Pthreshold against Keq, for catalysts 1–5 reveals a linear correlation (Fig. 4c). The better performing catalysts have higher equilibrium constants and lower Pthreshold: that is, they reach maximum performance at lower CO2 pressures. Pthreshold also exponentially correlates to the measured kobs,5 bar (Fig. 4d). This kinetic treatment directly links two measurable variables: the rate constant, kobs,5 bar and Pthreshold, a parameter central to low energy process operation. Such a correlation is particularly important, since it identifies how to maximize performances while minimizing the operating pressure with its associated economic and environmental costs (Supplementary Table 1).
Prediction of equilibrium parametersThere are clear correlations between rate, equilibrium and threshold pressure that apply to all five catalytic systems, which span a wide range of different catalyst classes (Fig. 2). One consequence is that these correlations could be generalizable to other epoxide–CO2 copolymerizations, conducted isothermally, with experiments in this work all being conducted at 50 °C. It may be that the carbon dioxide insertion Keq and Pthreshold are predictable for any catalyst or monomer using a single measurement of rate coefficient, kobs, which is set in this work at 5 bar. To experimentally test this hypothesis, a previously reported heterodinuclear Co(II)Mg(II) catalyst (6), not included in the original catalyst selection, was synthesized and examined for CHO–CO2 ROCOP46 (Supplementary Fig. 54 and Supplementary Table 13). Catalyst 6 was selected as it showed very high performances in the copolymerization catalysis, including operating at low loadings and temperatures. In addition, catalysts 1, 2 and 5, previously investigated for PO–CO2 ROCOP, were each examined for a second monomer combination: CHO–CO2 ROCOP. First, each catalyst was monitored for CHO–CO2 ROCOP, at 5 bar CO2 pressure, to obtain the rate coefficient kobs,5 bar. Using kobs,5 bar, the CO2 insertion equilibrium constant, Keq, and threshold pressure, Pthreshold, were predicted using the exponential relationships that were previously uncovered (Figs. 4 and 5 and Supplementary Table 13). The predicted equilibrium constants for catalysts 1, 5 and 6 are comparable, with Keq = 0.27 M−1 (1), 0.85 M−1 (5) and 0.28 M−1 (6) (Supplementary Table 13). They also show similar, high, values for the predicted Pthreshold = 16 bar (1 and 6) and 14 bar (5). In contrast, catalyst 2 has a substantially higher predicted CO2 insertion equilibrium constant, Keq = 23.4 M−1 and a notably lower predicted Pthreshold (Fig. 5). To further investigate the general predictability of Keq, a previously reported organoborane catalyst was tested for CHO–CO2 ROCOP47 (Supplementary Fig. 54 and Supplementary Table 13). However, the observed activities were too low under these conditions to warrant further equilibrium or rate analysis.
Fig. 5: Prediction of threshold pressures for maximum catalytic performance. The alternative text for this image may have been generated using AI.
a, Plot of threshold pressure for maximum catalytic performance (Pthreshold) versus polymerization rate constant, kobs, at 5 bar CO2 pressure and 50 °C. Squares represent kobs for the PO–CO2 ROCOP, and triangles for CHO–CO2 ROCOP. kobs values were determined as the average of n = 2 independent runs, with errors indicated as ± the standard error from the mean, typically falling ±10%. Data for catalyst 5 were taken from ref. 13. Crosses represent measured values of kobs,5 bar and predicted Pthreshold values for catalysts 1, 2, 5 and 6 for the CHO–CO2 ROCOP (Supplementary Table 13). b, Table showing the predicted Pthreshold and the measured catalytic performance at Pthreshold and at a pressure above it (20 bar) for catalysts 1, 2, 5 and 6. The rate data, kobs, were obtained at 50 °C, using catalyst (0.025 mol%, 2.5 mM), CHO (6 ml, 9.9 M), trans-1,2-cyclohexanediol (0.5 mol%, 49 mM). c, Structures of the catalysts 1, 2, 5 and 6 for which Pthreshold was successfully predicted. The symbol colours in the graphs correspond to the catalysts colour with their associated numbering as defined in Fig. 2.
Following the predictions of Pthreshold and Keq, the accuracy of the predicted values for catalysts 1, 2, 5 and 6 was tested experimentally. For catalyst 5, CHO–CO2 ROCOP was investigated at pressures from 5 bar to 25 bar, with the Pthreshold being 14 bar and matching the predicted value (Supplementary Fig. 55). For catalyst 1 and 6, the value of the predicted pressure threshold is tested by conducting CHO–CO2 ROCOP at the predicted Pthreshold (16 bar CO2, Fig. 5), and at a higher pressure than the threshold (20 bar CO2). If the predicted Pthreshold is accurate, the catalytic performance should remain unchanged and indeed, the kobs is equivalent at each of those pressures (kobs,16 bar = 0.85 × 10⁻⁵ s−1, kobs,20 bar = 0.86 × 10⁻⁵ s−1 for catalyst 1 and kobs,16 bar = 0.91 × 10⁻⁵ s−1, kobs,20 bar = 0.77 × 10⁻⁵ s−1 for catalyst 6). Catalyst 5 was applied at pressures of 14 (predicted threshold pressure) and 20 bar; it showed very similar rates at both pressures (kobs,14 bar = 3.90 × 10⁻⁵ s−1, kobs,20 bar = 4.10 × 10⁻⁵ s−1) once again validating the successful identification of the threshold pressure.
Since catalyst 2 performs far better at 5 bar than the other two catalysts, its Pthreshold was predicted to be below 5 bar. This result implies that catalyst 2 has already achieved its maximum rates at 5 bar. Hence, catalyst 2 showed the same catalytic performance at both 5 bar and 20 bar (kobs,5 bar = 3.86 × 10⁻⁵ s−1, kobs,20 bar = 3.91 × 10⁻⁵ s−1), strongly suggesting that its Pthreshold is <5 bar (Fig. 5 and Supplementary Table 13). These experiments are surprising since the data generated using PO–CO2 ROCOP can be used to successfully predict Pthreshold for CHO–CO2 ROCOP and to accelerate identification of the optimum operating conditions, that is, minimum pressure for maximum rate. The results obtained using catalysts 1, 2, 5 and 6 for the CHO–CO2 ROCOP indicate that the kinetic methods may be further generalizable to other monomers. It is particularly helpful to use a single kinetic evaluation (kobs,5 bar) to identify and predict the optimum operating conditions for that catalyst.
The general applicability of Keq as a predictor of catalytic performance is further illustrated by three other known catalysts for which pressure-dependent kinetics were reported26,27,48. An antimony catalyst (with bis(triphenylphosphine)iminium chloride co-catalyst) showed an equilibrium constant of <1 bar−1 in CHO–CO2 ROCOP, resulting in a Pthreshold > 20 bar (Supplementary Fig. 56). A similar Pthreshold above 20 bar was reported for a di-Zn(II) β-diiminate catalyst. By contrast, a zinc β-diiminate catalyst 7 showed a threshold pressure <5 bar CO2 pressure26. In the original reports no equilibrium constants were determined; however, we estimated Keq <1 M−1 and Keq ~ 3.67 M−1 for the zinc catalysts, respectively (Fig. 6, catalyst 7).
Fig. 6: Relating the value of CO2 insertion equilibrium constants to threshold pressures for maximum catalytic performance. The alternative text for this image may have been generated using AI.
Plot of the combined data for all catalysts showing the carbon dioxide threshold pressure values, Pthreshold, and CO2 insertion equilibrium constants, Keq, determined in this investigation (with colours identifying different catalysts and square markers referring to PO–CO2 ROCOP, triangles to CHO–CO2 ROCOP). The plot shows that only catalyst 2 applied for CHO–CO2 ROCOP achieves the target low pressure (<10 bar) and high insertion equilibrium (>10 M−1) performance.
The kinetic prediction method indicates that only catalysts with kobs,5 bar > 2.5 × 10⁻⁵ s−1 (Keq > 10 M−1), are expected to show CO2 pressure independent performances below 10 bar. The PO–CO2 ROCOP catalysts examined all show Keq < 5 M−1, and at 5 bar all show performances that depend on carbon dioxide pressure (squares, Fig. 6). Even in the broader literature there are not yet any PO–CO2 ROCOP catalysts known or reported to enter the target regime: that is, showing high rates and selectivity at <10 bar pressure. The methods presented here should help accelerate new catalyst testing and identify catalyst structure–performance relationships, particularly focused on how catalyst structure drives carbon dioxide insertion chemistry. In contrast, for CHO–CO2 ROCOP, catalyst 2 already shows a Keq > 10 M−1 and achieves excellent performances at <5 bar CO2 pressure (Fig. 6). The literature also reveals other CHO–CO2 ROCOP catalysts reported to exhibit high rates at low CO2 pressures; these catalysts are recommended for evaluation using the methods reported here to confirm whether pressure independent performances are achieved at <10 bar. Where such criteria are achieved, the catalysts may even function using more dilute CO2 sources (that is, <1 bar pressure): a regime that is very rarely explored in this field of catalysis46,49.
Both catalyst structure and monomer choice influence the CO2 insertion chemistry, highlighting the value in using the CO2 insertion parameters, Keq and Pthreshold, as metrics for catalyst comparison. One benefit of these metrics is that they inform directly on the process operating conditions with respect to catalytic performance. Comparing catalysts using these parameters may be more informative than the conventional use of activity (that is, turnover frequency) as figure of merit. It is well known that such activity measurements are both monomer and condition dependent; in contrast, Keq allows for comparisons over a range of CO2 pressures and different epoxides. The ability to rapidly predict the carbon dioxide insertion Keq or Pthreshold values drastically reduce the experimental work needed to compare new catalysts and to identify the lowest pressure operating conditions for them.
The correlations and the practical experimental protocols should be especially useful in selecting catalysts for larger-scale use, and in identification of their optimum operating conditions
Comments (0)