
Remember me
Ethical approval for this study was obtained from the institutional review board of Kanagawa Children’s Medical Center (No. 170-7; February 2025), and the study was conducted in accordance with the principles of the Declaration of Helsinki.
This single-center retrospective cohort study included infants with CDH born at a gestational age of ≥35 weeks who were admitted to the neonatal intensive care unit within 24 h of birth between January 2017 and December 2024.
This study builds upon our previous study that included 30 infants who underwent surgery for CDH and initial postnatal echocardiography21. The present study extends the previous cohort by including an additional 19 infants and five predefined serial echocardiographic time points for each infant.
The timing of surgery was determined through multidisciplinary discussion between the surgeons and neonatologists based on clinical assessment of pulmonary hypertension and overall respiratory and circulatory stability. To minimize potential bias, the clinicians responsible for the surgical decision making were not involved in the study design and were blinded to the aims of the present analysis and to the 3D echocardiographic measurements.
Biventricular loading conditions and function were assessed using transthoracic echocardiography at 1, 2, and 3 days of age; within 12 h before surgery; within 18 h after surgery; and between 24 and 72 h after surgery. For the analyses at 1–3 days of age, only preoperative measurements were included; the postoperative data of one infant who underwent surgical repair before 3 days of age were excluded.
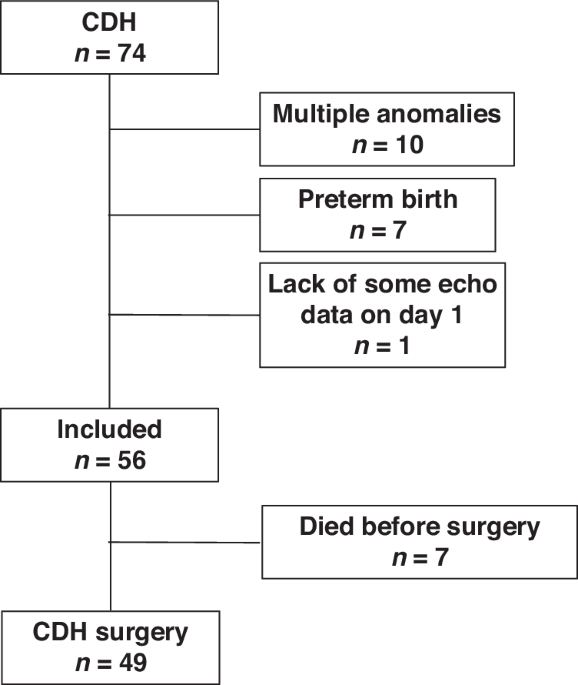
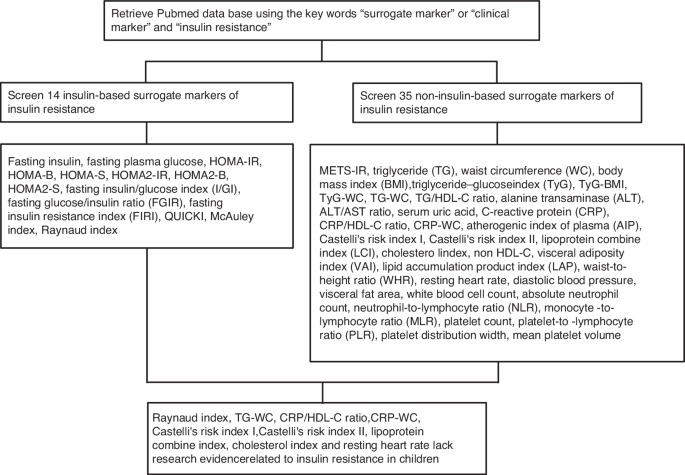
As shown in Fig. 1, infants with significant congenital anomalies, including major cardiac anomalies other than patent foramen ovale, patent ductus arteriosus, or persistent left superior vena cava, as well as those with multiple anomalies, were excluded. Infants who died before surgical repair were excluded because they did not reach the predefined perioperative assessment timepoints. The clinical course and early postnatal hemodynamics of these early non-survivors have been reported in detail in our previous study21. Intraoperative defect size was classified according to the Congenital Diaphragmatic Hernia Study Group (CDHSG) defect size classification (stages A–D) based on operative findings27.
Fig. 1: Flow diagram of patient selection. The alternative text for this image may have been generated using AI.
Overall, 74 infants with CDH were admitted to our hospital. Eighteen infants were excluded owing to the presence of multiple anomalies (n = 10), preterm birth (n = 7), or missing echocardiographic data (n = 1). Of the remaining 56 infants, 7 died before surgical repair and did not reach the predefined perioperative assessment timepoints. The final cohort consisted of 49 infants who underwent surgical repair. CDH congenital diaphragmatic hernia.
Routine fetal ultrasonography was performed for all newborns with prenatally diagnosed CDH. Disease severity was assessed using the observed-to-expected lung-to-head ratio (o/e LHR) and the lung/thorax transverse area ratio during the fetal period28,29. All patients with CDH were managed by a multidisciplinary team following an institutional protocol based on Japanese CDH clinical guidelines30. Mechanical ventilation was initially started with high-frequency oscillation (HFO). In accordance with our previously reported protocol, the ventilator mode was individualized based on each patient’s respiratory status and clinical course. Patients showing smooth weaning or high airway resistance on preoperative respiratory function testing were switched to conventional mechanical ventilation (CMV), while others continued on HFO ventilation31,32. Perioperative cardiovascular management was provided according to institutional practice based on Japanese clinical guidelines for CDH. Inhaled nitric oxide (NO) was used for the management of pulmonary hypertension as clinically indicated. No infants received additional pulmonary vasodilator therapy specifically targeting pulmonary hypertension during the study period.
Clinical characteristicsDemographic data, including sex, gestational age, birth weight, Apgar scores, and mode of delivery, were extracted from the patients’ electronic medical records. Additional clinical details for the CDH group, such as defect laterality, surgical timing, stomach and liver positions, cardiovascular treatments, and outcomes at neonatal discharge, were also extracted. The CDHSG defect size classification (A–D) distribution was recorded as a measure of disease severity.
The respiratory severity score (RSS) was calculated as the product of the mean airway pressure (mmHg) and the fraction of inspired oxygen33. The vasoactive–inotropic score was calculated as the sum of dopamine and dobutamine doses (μg/kg/min), plus 100-times the epinephrine and norepinephrine doses (μg/kg/min), 10,000-times the vasopressin dose (U/kg/min), and 10-times the milrinone dose (μg/kg/min)34. The oxygenation index was calculated using the following formula: (inspired oxygen percentage × mean airway pressure [MAP; mmHg] × 100) ÷ arterial partial pressure of oxygen (mmHg).
Echocardiographic measurementsEchocardiographic data were gathered by a single experienced echocardiographer (K. Toyoshima). As per our institutional protocol, RV and LV volumes were evaluated using 3D echocardiography. Full-volume 3D echocardiography datasets were obtained via the apical approach, utilizing a commercially available ultrasound system and equipment (EPIQ7G or EPIQ CVx with the X7-2 probe; Philips Healthcare, Andover, MA, US). The depth and sector angle were adjusted to capture the entire LV or RV, maintaining a frame rate of over 40 fps. A full-volume scan, comprising six R wave-triggered subvolumes, was acquired to ensure the complete LV or RV was included in the 3D dataset. Each capture consisted of six cardiac cycles, which were stitched together. We obtained 3D data from six cardiac cycles captured under deep sedation to minimize body motion and allow stable image acquisition21.
An experienced investigator (K. Toyoshima) performed the 3D echocardiographic analysis to measure LV and RV volumes using commercially available 3D echocardiography software (4D LV-Analysis version 4, 4D RV-Function version 3; TomTec Imaging Systems, Unterschleissheim, Germany), which has been previously reported to provide reproducible measurements of ventricular volumes14,35,36.
To obtain LV volume, the LV endocardial border in the LV-focused four-chamber view was semi-automatically determined after two-point clicking of the LV apex and the center of the mitral valve annulus in the apical four-chamber, two-chamber, and three-chamber views extracted from the 3D echocardiography datasets. When necessary, the endocardial border was manually adjusted. The software produced time-domain LV volume curves, from which LV volumes and LVEF were derived. The software automatically generated measurements of LV end-diastolic volume (LVEDV), LV end-systolic volume (LVESV), LV stroke volume (LVSV), LVEF, LV global longitudinal strain (LVGLS), LV global circumferential strain (LVGCS), and LV torsion. The 3D speckle-tracking method assesses EF and myocardial strain by tracking the entire endocardial surface within a volumetric dataset, enabling simultaneous longitudinal and circumferential strain measurements without geometric assumptions37,38.
Effective arterial elastance (Ea) and end-systolic elastance (Ees) were approximated as (mean blood pressure ÷ SV) and (mean blood pressure ÷ ESV), respectively24. The Ea/Ees ratio was used as an index of ventricular–arterial coupling24,25. We calculated Ea/Ees from the LV and RV ESV/SV, as measured by 3D echocardiography19,26.
RV volume was measured by defining three orthogonal planes and specific landmarks in the apical RV-focused four-chamber view (Fig. 2). Based on the initial view adjustments, the program automatically generated four-chamber, sagittal, and coronal RV views, along with measurements of RV end-diastolic volume (RVEDV), RV end-systolic volume (RVESV), RVSV, and RVEF (Fig. 2). We subsequently calculated the LVEDV/RVEDV ratio to evaluate the balance between LV and RV volumes. RV pressure–volume loops were constructed in a subset of infants using tricuspid regurgitation (TR) pressure gradient (TRPG)-derived RV pressure, and analyzed for 12 infants in whom TRPG was measurable at every perioperative timepoint as a proof-of-concept analysis of RV ventricular–arterial coupling.
Fig. 2: Offline analysis of 3D echocardiographic RV volume calculations at end-diastole. The alternative text for this image may have been generated using AI.
The green contours indicate the semi-automatically detected RV endocardial border. EDV end-diastolic volume, EF ejection fraction, ESV end-systolic volume, RV right ventricular, SAX short-axis, SV stroke volume, 3D three-dimensional, 4Ch four-chamber.
Left atrial (LA) volume was calculated using the single-plane area–length method in the four-chamber view (LA volume = 0.85 × [LA area]² ÷ LA length)39. Parameters dependent on body size were indexed to body weight (BW).
The reproducibility of LV and RV volume measurements using 3D echocardiography, even in low-birth-weight infants, has been reported in our previous studies, including analyses of intra-observer and inter-observer variability using intraclass correlation coefficients and Bland–Altman methods19,20,21.
Statistical analysesDescriptive statistics, including the mean ± standard deviation and median [interquartile range], were used to summarize the demographic and clinical data of the infants with CDH. Categorical data are expressed as n (%). Hemodynamic, respiratory, and echocardiographic parameters across three timepoints were compared using one-way repeated measures analysis of variance (ANOVA). For continuous variables with a normal distribution, the repeated-measures ANOVA was used, followed by the Bonferroni-adjusted pairwise comparisons. For continuous or ordinal variables with a non-normal distribution, the Friedman test was applied, followed by Bonferroni-adjusted Wilcoxon signed-rank tests for post hoc analysis. For categorical (binary) variables assessed repeatedly across three time points, the Cochran’s Q test was used, followed by the Bonferroni-adjusted McNemar tests for pairwise comparisons when appropriate.
Statistical analyses were performed using EZR (version 1.54; Saitama Medical Center, Jichi Medical University, Japan), a graphical user interface for R (The R Foundation for Statistical Computing, Vienna, Austria). P < 0.05 was considered statistically significant.
Comments (0)