
Remember me
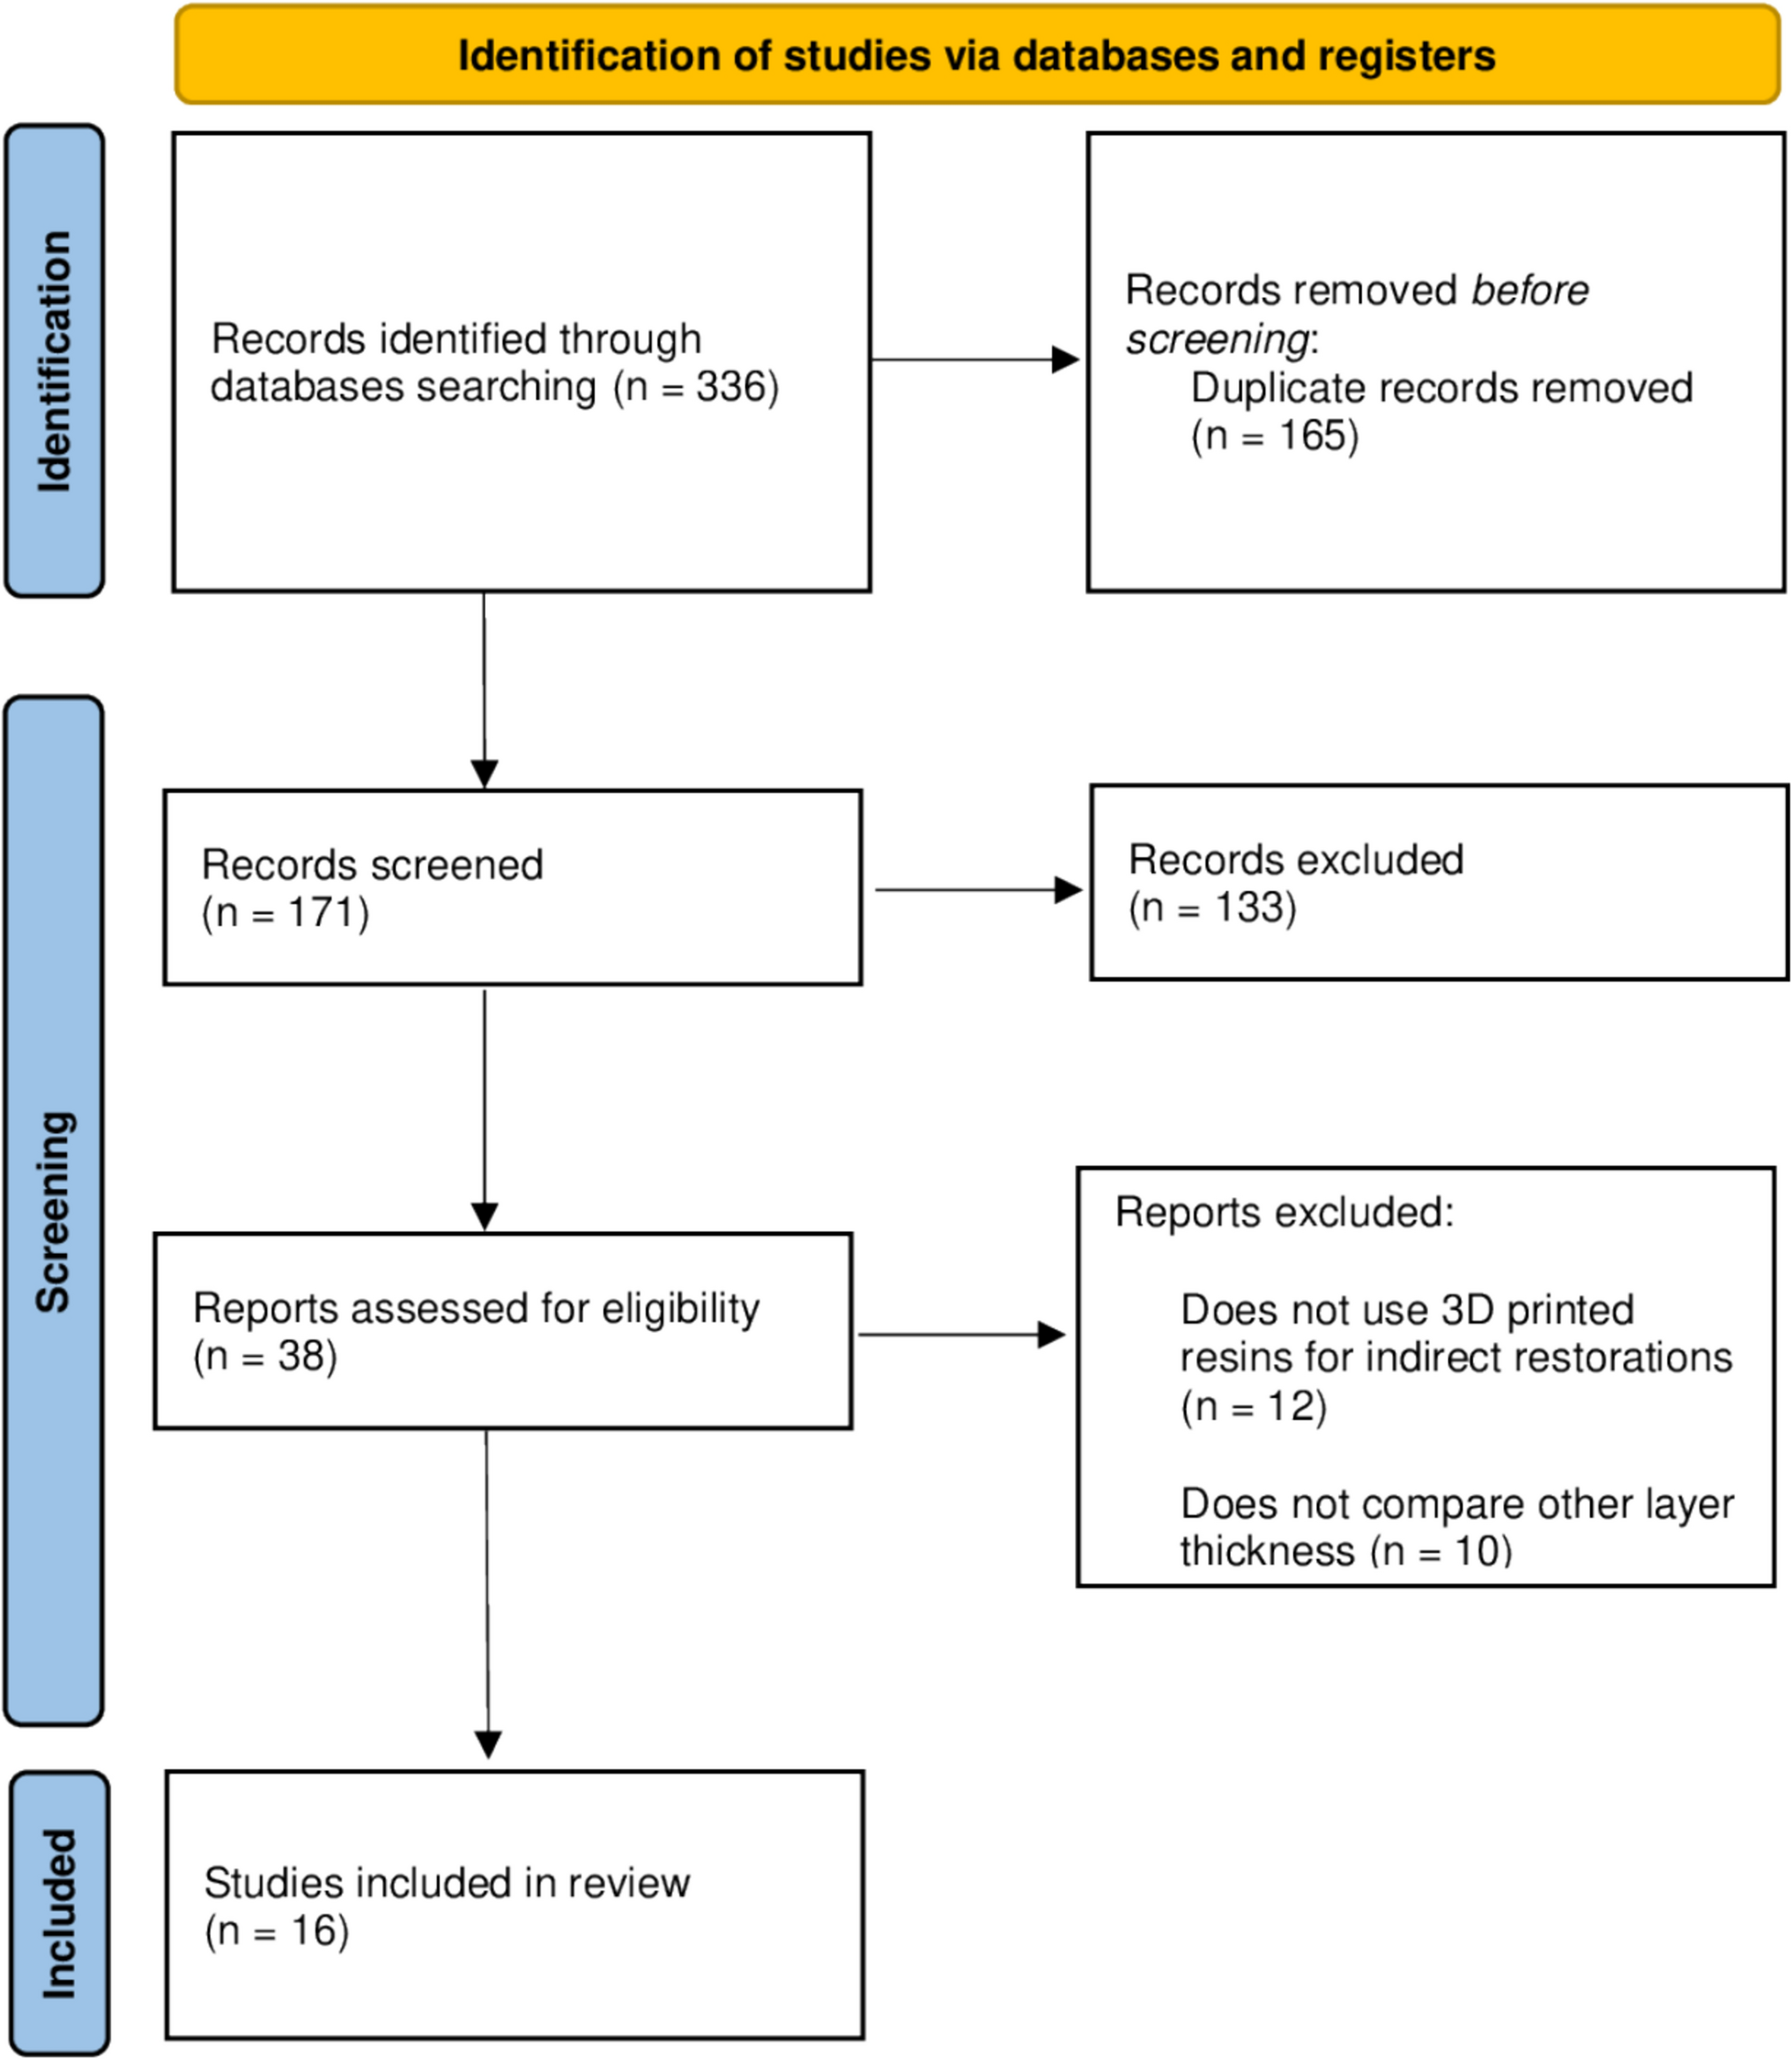
Using the search strategy, 336 articles were identified from four databases (PubMed, Scopus, Web of Science, and LILACS). After searching each database, duplicates were removed using the EndNote reference manager (EndNote; Clarivate). Articles published in different languages were translated, all titles and abstracts were screened, the eligibility criteria were applied, and 38 studies were selected for full-text assessment. Subsequently, the articles were read completely, and 22 were excluded. Thus, 16 studies published in English between August 2019 and September 2025 were included. The details of the search process are shown in Fig. 1.
Fig. 1
PRISMA Flow diagram describing study selection
All studies were in vitro experiments (Table 2). Across the included studies, the primary research objectives centered on assessing how additive-manufacturing parameters, especially layer thickness, build orientation, and post-processing protocols, influence the mechanical, physical, and clinical performance–related properties of 3D-printed interim dental materials. Multiple investigations evaluated the effect of layer thickness in combination with aging, finishing/polishing, or post-curing procedures on flexural strength, surface roughness, hardness, cell adhesion, and porosity of printed resins for crowns or provisional restorations [3, 16, 17, 19,20,21]. Other studies examined dimensional accuracy, including trueness, marginal and internal fit, and internal gap, comparing printed restorations with subtractively manufactured or PMMA-milled controls [1, 4, 8, 22,23,24]. Build orientation was also investigated as a factor influencing prosthesis fit, mechanical performance, and printed layer integrity [19, 23, 25, 26]. Additional studies focused on performance-related properties such as wear resistance under varying post-polymerization conditions [27] and the impact of layer thickness on optical properties and surface texture across different resin formulations indicated for provisional or definitive use [28].
Table 2 Characteristics of included studiesOnly one [3] of the sixteen studies did not used 100 μm thickness as comparison group. Two studies used definitive materials in addition to provisional ones [17, 28]. The only material used as control group in five studies [1, 8, 22, 23, 27] was PMMA. Twelve studies used DLP technology, two used LCD technology [3, 17] and three used SLA technology [19, 23, 25] for printing. Among the outcomes evaluated, five analyzed the flexural strength and fracture modulus [3, 16, 17, 19, 20] and marginal fit [3, 4, 23,24,25], three evaluated the degree of conversion [16, 17, 21] and surface roughness [3, 17, 28] and two reported hardness[16, 17] and trueness[8, 22].
Quantitative synthesis (meta-analysis) was performed based on subgroup analyses comparing the 50 µm print layer thickness with other thicknesses, and not all studies included in this review reported data for inclusion. Thus, 7 studies were analyzed qualitatively.
Regarding flexural strength and fracture modulus (Fig. 2), overall the 50 µm thickness obtained the best results with a statistically significant difference (p = 0.001). However, when comparing with 25 µm, studies demonstrated no statistical difference (p = 0.40; MD: −1.18; 95% CI: −3.94 to 1.57; heterogeneity: Chi2 = 0.64; I2 = 0%). On the contrary, when comparing with 100 µm a significant difference was observed (p < 0.0001; MD: −11.44; 95% CI: −17.13 to −5.75; heterogeneity: Chi2 = 33.71; I2 = 85%).
Fig. 2
Forest plot of flexural strength. MFH, Nextdent MFH; NNL, Nanolab; RSL, Resilab
When evaluating marginal and internal fit (Fig. 3), the 50 µm layer thickness presented the best results (p < 0.00001). Three other studies [1, 23, 25] compared the 50 µm thickness with 100 µm and were not included in the meta analysis. Supporting these findings, Jang et al. reported that 50 µm showed the best outcomes; however, Yang et al. indicated that there were no statistically significant differences between the two layer thicknesses (p = 0.681). In contrast, Park et al. concluded that, for implant-supported three-unit interim restorations, the 100 µm thickness was more suitable.
Fig. 3
Forest plot of marginal and internal fit
In relation to surface roughness (Fig. 4), when compared with a layer thicknesses of 25 µm there was no significant difference for the performance of the 50 µm groups (p = 0.09; MD: −0.07; 95% CI: −0.15 to 0.01; heterogeneity: Chi2 = 2.93; I2 = 32%). Moreira et al., however, reported that depending on the finishing and polishing protocol, the 25 µm layer can perform significantly better than the 50 µm layer. Nevertheless, relative to a layer thickness of 100 µm, significant difference was demonstrated with superior results of the 50 µm groups (p = 0.001; MD: 0.15; 95% CI: 0.06 to 0.25; heterogeneity: Chi2 = 42.82; I2 = 91%).
Fig. 4
Forest plot of surface roughness. TG, GC Temp; ND/MFH, Nextdent MFH; NNL, Nanolab; RSL, Resilab
A similar trend was observed about trueness (Fig. 5), as studies concluded that 20 µm and 50 µm layer thicknesses had similar performances (p = 0.40; MD: 2.65; 95% CI: −3.52 to 8.82; heterogeneity: Chi2 = 0.0; I2 = 0%). With respect to 100 µm layer thickness, the 50 µm revealed to be more appropriate (p = 0.01; MD: 14.60; 95% CI: 2.90–26.30; heterogeneity: Chi2 = 2.89; I2 = 65%).
Fig. 5
Concerning hardness (Fig. 6), the meta analysis indicated significant difference(p = 0.05; MD: −3.21; 95% CI: −6.50 to 0.07; heterogeneity: Chi2 = 772.61; I2 = 100%) and the highest mean values in the 50 µm groups when compared to 100 µm. When compared to 20 µm, Alshamrani, Raju, Ellakwa found no significant difference.
Fig. 6
Forest plot of hardness. MFH, Nextdent MFH; NNL, Nanolab; RSL, Resilab
Based on the bias analysis of the studies (Table 3), for domain bias in design and allocation (D1), 5 of the 16 included studies reported a control group. Only Wan et al. [27] reported randomization or sample allocation, and 7 of the 16 studies reported sample calculations. All studies sufficiently reported specimen standardization and identical experimental conditions for domain bias in the samples and specimen preparation (D2). For domain bias in the outcome assessment (D3), adequate test procedures and standardized results were reported in all studies. However, none of the studies reported operator blinding. For the domain “bias in the assessment of treatment and outcome data (D4)”, all studies sufficiently reported adequate statistical analysis.
Table 3 Assessment of risk of bias in included studies
Comments (0)