
Remember me
No ethical approval was required since the study used three-dimensionally (3D)-printed synthetic models with no human or animal tissue. This laboratory study was reported in accordance with the Preferred Reporting Items for Laboratory Studies in Endodontology (PRILE) 2021 guidelines.
The sample size was calculated using G*Power software (version 3.1.9.6). Based on the values reported in a previous study [17] and assuming a 95% confidence level (1–α), 95% statistical power (1–β), and an effect size of f = 0.926, the minimum required sample size was determined to be 2 specimens per resorption type, yielding a total of 16 specimens. To enhance the robustness of the analysis, four specimens were fabricated for each experimental condition, including seven resorption types and one non-resorptive control group. Thus, a total of 32 specimens were included in the study, with eight groups and four specimens per group.
Design of 3D-printed tooth modelsThe 3D-printed transparent tooth models with a pulp chamber and mature apex were specifically designed for various resorption types and produced by a manufacturer (EduDent Educational Materials, Istanbul, Turkey), based on the specifications provided by the authors. In all tooth models, a crown length of 6 mm and diameter of 5 mm were standardized, and a triangular access cavity was prepared to create a conical coronal reservoir simulating an endodontic access cavity.
The internal root canal anatomy of all models was standardized to represent a single-rooted tooth with a mature apex, including the presence of a defined apical constriction, standardized apical foramen diameter, and consistent root canal termination pattern [18]. The apical constriction was designed to be located approximately 0.5 mm coronal to the apical foramen, and the foramen diameter was standardized to 0.3 mm across all models. In addition, the internal canal configuration exhibited a uniform 0.2 taper from the coronal to the apical [18]. The canal taper, curvature, and internal dimensions were kept uniform to minimize anatomical variability and ensure that differences in electronic working length measurements were primarily attributable to the simulated resorption morphologies rather than variations in root canal anatomy. However, in external apical root resorption models, the apical constriction was eliminated to reflect the nature and morphological severity of apical resorption.
In these experimental tooth models (excluding the control group), four main categories comprising seven distinct types of RR were designed: internal root resorption (IRR): (1) IRR- 0.5 mm and (2) IRR- 1 mm; external root resorption (ERR): (3) ERR- 0.5 mm and (4) ERR- 1 mm; external apical root resorption (EARR): (5) EARR grade 2 and (6) EARR grade 3; and (7) external cervical resorption (ECR). The corresponding digital prototype designs are illustrated in Fig. 1.
Fig. 1
3D digital prototype designs representing different types of root resorption defect used in the study. a, b IRR-0.5 mm: Internal resorption cavity with a 0.5 mm perforation size in coronal (a) and sagittal (b) aspects. c, d IRR-1 mm: Internal resorption cavity with 1 mm perforation size in coronal (c) and sagittal (d) aspects. e, f ERR-0.5 mm: External resorption cavity with a 0.5 mm perforation size in coronal (e) and sagittal (f) aspects. g, h ERR-1 mm: External resorption cavity with a 1 mm perforation size in coronal (g) and sagittal (h) aspects. i, j EARR grade 2 resorption type in coronal (i) and sagittal (j) aspects. k, l EARR grade 3 resorption type in coronal (k) and sagittal (l) aspects. m, n ECR resorption in coronal (m) and sagittal (n) aspects
In the IRR models, the crown and root lengths were standardized at 6 and 18 mm, respectively. A resorption cavity with a diameter of 2.1 mm was created in the middle third of the root. Two types of IRR designs were prepared (n = 4), in which the cavity perforated the external root surface with widths of 0.5 mm (IRR- 0.5 mm) (Fig. 1 a,b) and 1 mm (IRR- 1 mm) (Fig. 1 c,d).
In the ERR models, the crown length was standardized at 6 mm and the root length at 18 mm. A resorption cavity with a diameter of 2.1 mm was created on the buccal surface of the middle third of the root. In this study, ERR defects were intentionally designed as perforating lesions extending from the external root surface into the root canal space to simulate severe external resorption. Two types of ERR designs were prepared (n = 4), in which the cavity was perforated into the root canal space with widths of 0.5 mm (ERR- 0.5 mm) (Fig. 1 e,f) and 1 mm (ERR- 1 mm) (Fig. 1 g,h).
In the EARR models, the crown length was standardized to 6 mm. The design of the EARR models was standardized according to the morphological severity described by Levander et al. [19]. Specifically, the models were created based on index scores 2 and 3 in their classification system. According to this index, a score of 2 represents apical resorption of less than 2 mm (minor resorption), while score of 3 denotes apical resorption extending from 2 mm up to one-third of the original root length. Accordingly, in the EARR grade 2 models (Fig. 1 i,j; n = 4) used in the present study, the root length was designed to be 18 mm on the longest side and 16 mm on the shortest side, which was affected by resorption. In the EARR grade 3 models (Fig. 1 k,l; n = 4), the root length was standardized to 12 mm. These parameters were adopted to ensure that the simulated apical defects reflected clinically relevant levels of apical resorption severity commonly observed in orthodontically induced and pathologically associated cases.
In the ECR models (Fig. 1 m,n; n = 4), the crown length was standardized to 6 mm and the root length to 18 mm. The ECR area was prepared on the buccal surface of the coronal one-third of the root, measuring 3 mm wide, 2 mm high, and 3 mm deep. The cavity depth was intentionally designed to penetrate the pulp chamber, thereby simulating a perforating ECR lesion. This ECR model was classified as Heithersay Class 2 (Class 2: well-defined lesion close to the coronal pulp but with little or no extension into radicular dentine), which is based on two-dimensional radiographic evaluation [20]. According to the three-dimensional classification recently proposed by Patel et al. [21], the lesion corresponded to Type 1Bp (1: located at or coronal to the cemento-enamel junction, B: a circumferential spread between 90° and 180°, p: pulpal involvement present).
For the control group (n = 4), standard tooth models representing the intact anatomy were fabricated. Each model had a crown length of 6 mm and a root length of 18 mm, with a standardized internal canal configuration exhibiting a 0.2 taper. No resorption defects were introduced in the specimens. These models served as the reference group to establish baseline measurements for comparison with the experimental resorption models, enabling the evaluation of morphological and structural alterations associated with different types of resorption.
All models were designed using a 3D design program (Meshmixer; San Rafael, CA, USA) and saved in the.stl format and transferred to a 3D printer (Anycubic Photon M3 Max, Shenzhen, China). A transparent urethane–acrylate‐based photosensitive resin was used as the 3D printing material. Representative photographs of all the 3D-printed models are provided to demonstrate the geometry and location of the simulated resorptive defects (Suppl. Figure 1). Consequently, we obtained 32 replicas (n = 4 for the control and RR groups) with a resolution of 46 µm and a layer height of 10 µm.
Actual WL measurementsCanal measurement and foraminal patency were confirmed using the direct visual method by introducing a size #10 K file (25 mm; Dentsply Maillefer, Tulsa, OK, USA) inside the canal until its tip could be visualized through the apical foramen with the aid of an operating microscope (× 20, DF Vasconcellos, Valença, RJ, Brazil). The silicone stop was carefully adjusted to the coronal reference, and the file was removed from inside the root canal. The file was measured three times using a digital caliper (Mitutoyo absolute digital caliper, Mitutoyo, Kanagawa, Japan), and the average was calculated. The measurement was then subtracted by 0.5 mm, which generally confirms that the instrument is at the apical constriction [22]. This visual measurement was recorded as the ‘actual working length (AWL)’.
Electronic WL measurementsA digital educational model (EduDent, Istanbul, Turkey) was used for WL determination with EALs (Fig. 2a). This customized model was designed to accommodate the standardized tooth models. The sockets in the model were filled with alginate to simulate the electroconductive properties of periapical tissues, enabling accurate in vitro measurement of WL under conditions mimicking clinical conductivity, as described by Lipski et al. [23]. Each 3D printed tooth was positioned within the socket (Fig. 2b). First, the metallic connector of the model was linked to the lip clip of the EAL to complete the electrical circuit. The file holder of the EAL was connected to a size #10 K file. The file was moved apically in the canal until the ‘0.0’ mark appeared on the device display. The electronic reading was considered valid if it remained stable for at least 5 s. The silicone stop was then set to the same anatomical reference point that had been used during the visual measurement and fixed to the file using flowable composite resin. The file was carefully removed and measured using a digital caliper. Each measurement was repeated three times, and the average was recorded. This electronic measurement was reduced by 0.5 mm and recorded as the ‘electronic working length (EWL)’.
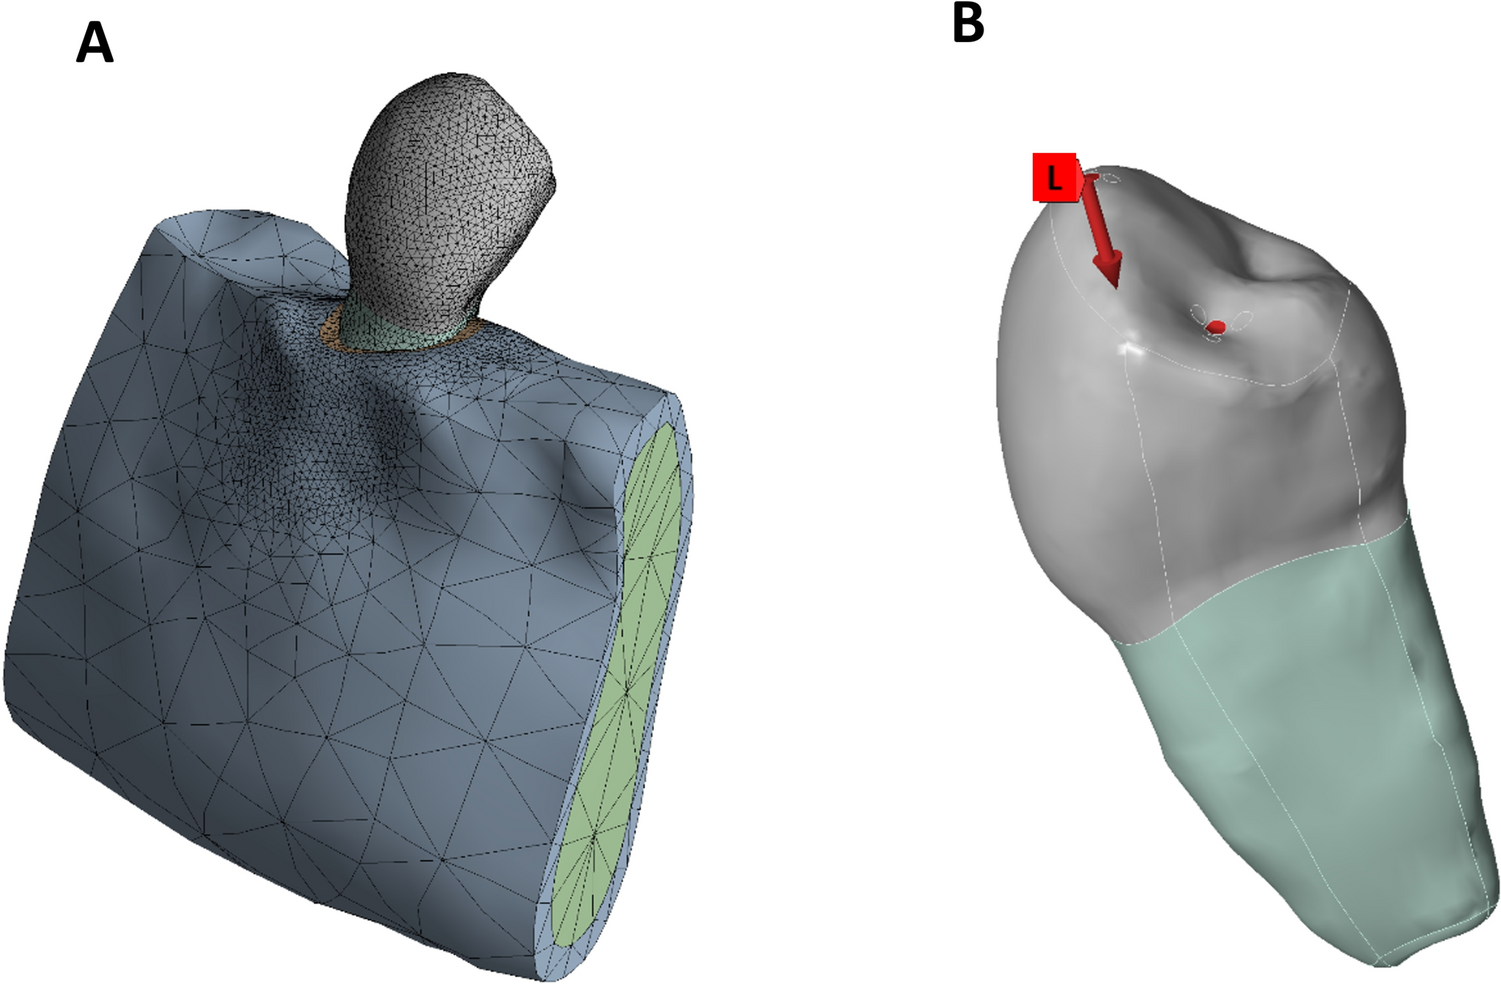
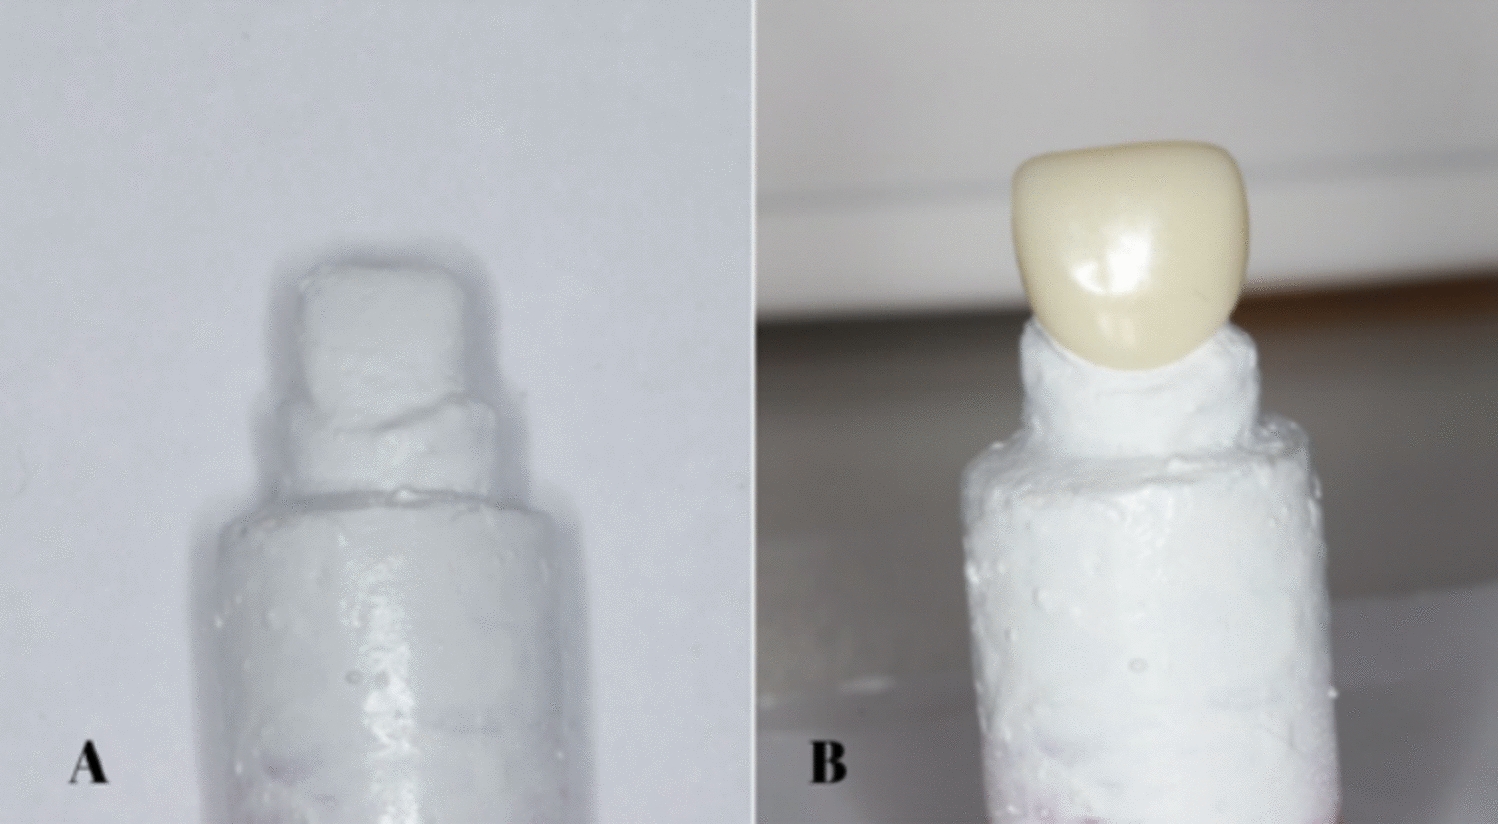
Fig. 2
a. Educational model for WL determination, b. the position of 3D printed tooth model within the socket
This study included four EAL devices. The Wirele-X (Forumtec, Ashkelon, Israel), iRoot (Bomedent, Changzhou, China), and AirPex (Eighteeth, Changzhou Sifary Medical Technology, China) are wireless devices. The Woodpex III Gold Plus (Woodpecker, Guilin, China) served as a non-wireless comparator. The measurement sequence for the four EALs was randomized using a computer-generated randomization list (random.org). Canal length measurements were performed under irrigation with 2% sodium hypochlorite (NaOCl) solution, as recommended by a previous study that reported optimal EAL accuracy at this concentration [24]. The use of this standardized concentration was intended to provide a conductive yet stable environment for EWL measurements, minimizing the influence of solution variability on impedance readings. Excess sodium hypochlorite from the pulp chamber was removed using cotton pellets. The alginate embedding medium was freshly prepared and used within 10 min for each tooth to avoid dehydration-related distortion [25]. All experimental procedures were performed by a single calibrated operator. Each measurement was repeated three times, and the average of the three readings was recorded as the final value (intraclass correlation coefficient = 0.996, demonstrating excellent reproducibility).
Error metrics and classificationFor each measurement, the absolute error (AE) was calculated using the following formula:
Based on the AE values, each reading was categorized as follows:
Precise: AE = 0.0 mm
Acceptable: 0.0 mm < AE ≤ 0.5 mm
Mistaken: AE > 0.5 mm
The primary outcome was absolute error, and the secondary outcomes were accuracy category proportions (precise/acceptable/mistaken) and device-wise AE differences within each RR model. These thresholds for AE were selected to ensure that even small deviations from the AWL were captured, allowing the accurate distinction of morphology-related performance differences among the devices. These cut-off values are consistent with the accuracy ranges commonly used in EAL validation studies [8, 17, 26, 27].
Statistical analysisStatistical analysis was performed using the IBM SPSS Statistics v23 software (IBM Corp., Armonk, NY, USA). The normality of the data distribution was assessed using the Shapiro–Wilk test. For variables exhibiting normal distribution, differences between the AWL and EWL measurements obtained from each EAL were analyzed using Paired Samples t-test. The Wilcoxon Signed-Rank test was applied for non-normally distributed variables. The consistency between the AWL and EWL measurements was evaluated using the Intraclass Correlation Coefficient (ICC).
Comparisons of accuracy rates among the apex locators were conducted using Cochran’s Q test, and pairwise post-hoc comparisons were performed with Bonferroni correction. Categorical variables were presented as frequencies (percentages), while continuous variables were expressed as mean ± standard deviation or median (minimum–maximum), as appropriate. Variables that met normal distribution assumptions were summarized as mean ± standard deviation, whereas non-normally distributed variables were reported as medians (minimum–maximum). Accordingly, parametric and non-parametric tests were selected based on the distribution patterns of each subgroup. A significance level of p < 0.05 was adopted for all analyses.
Comments (0)