
Remember me
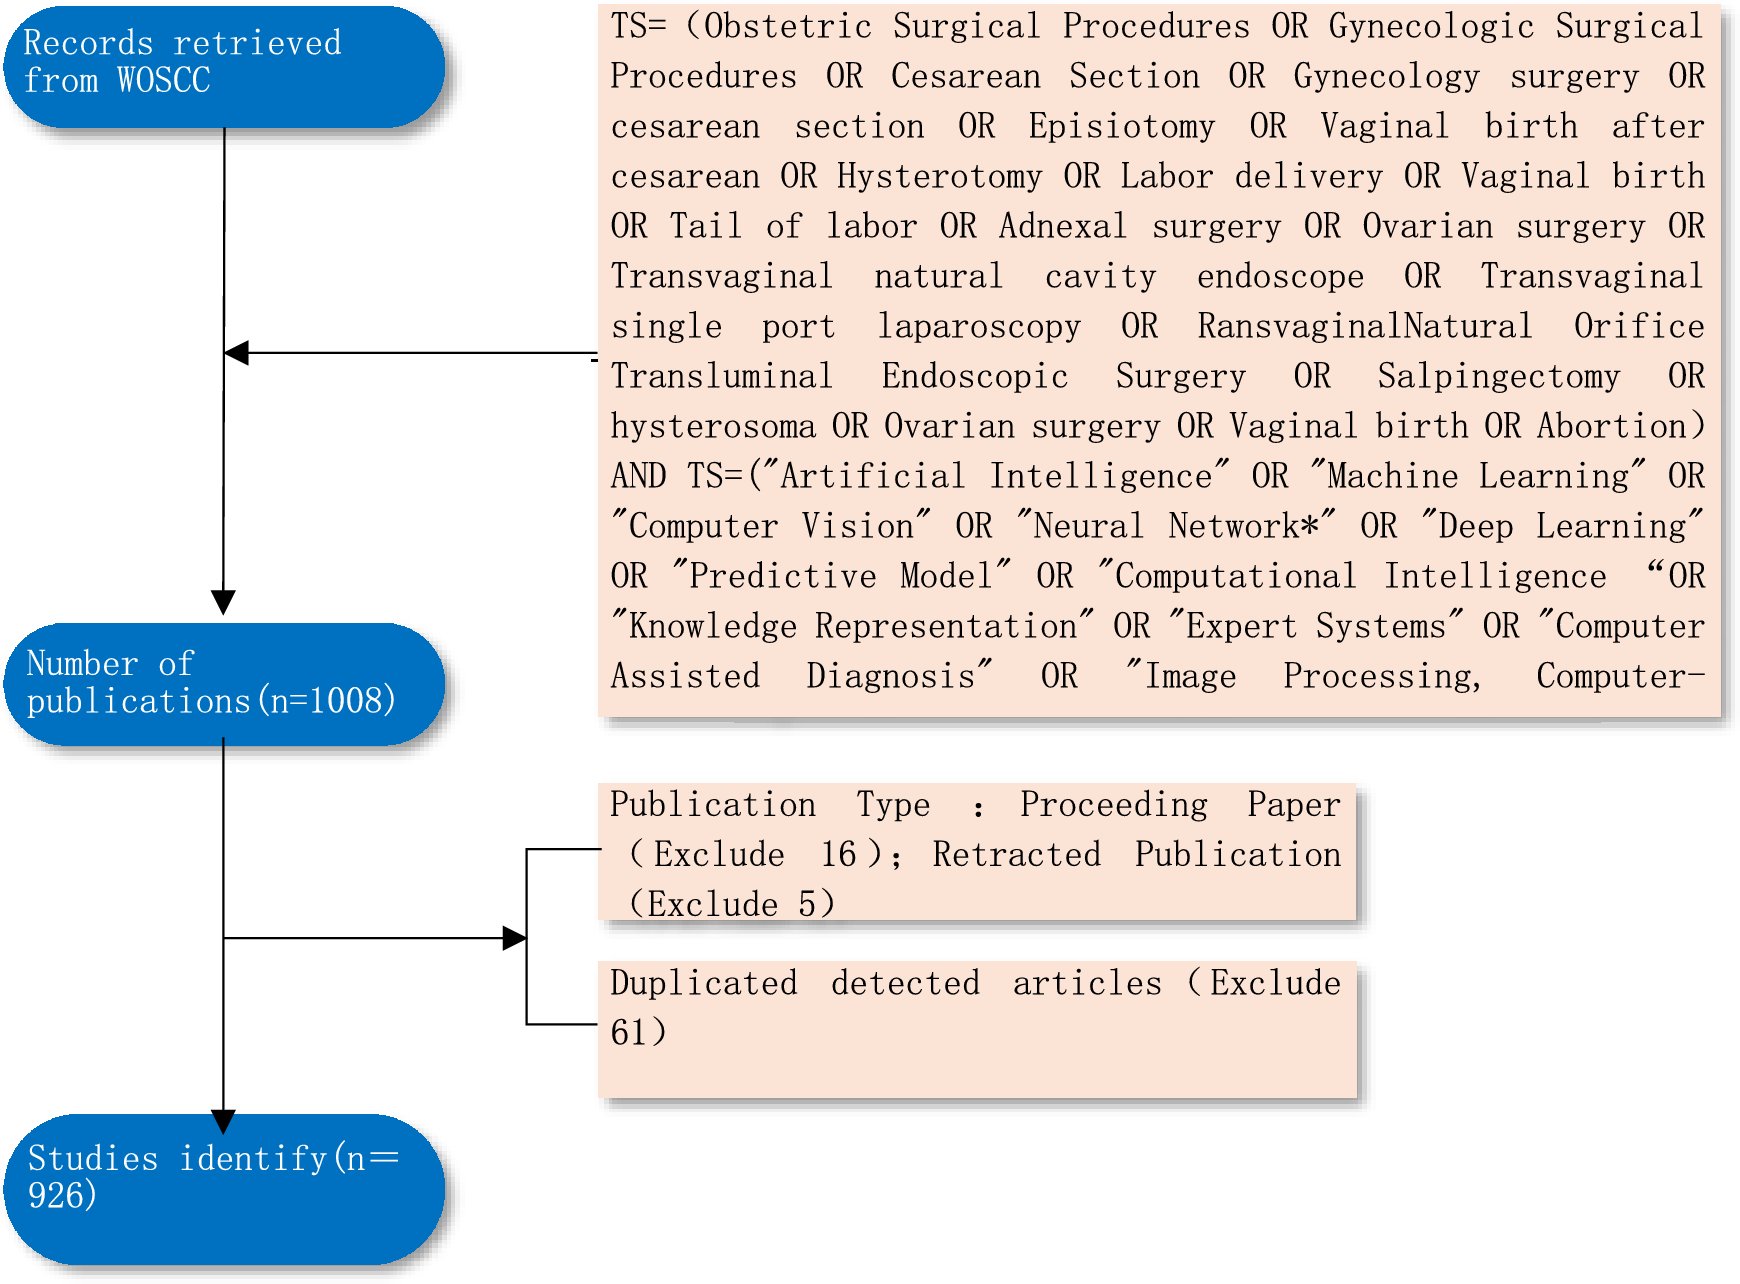
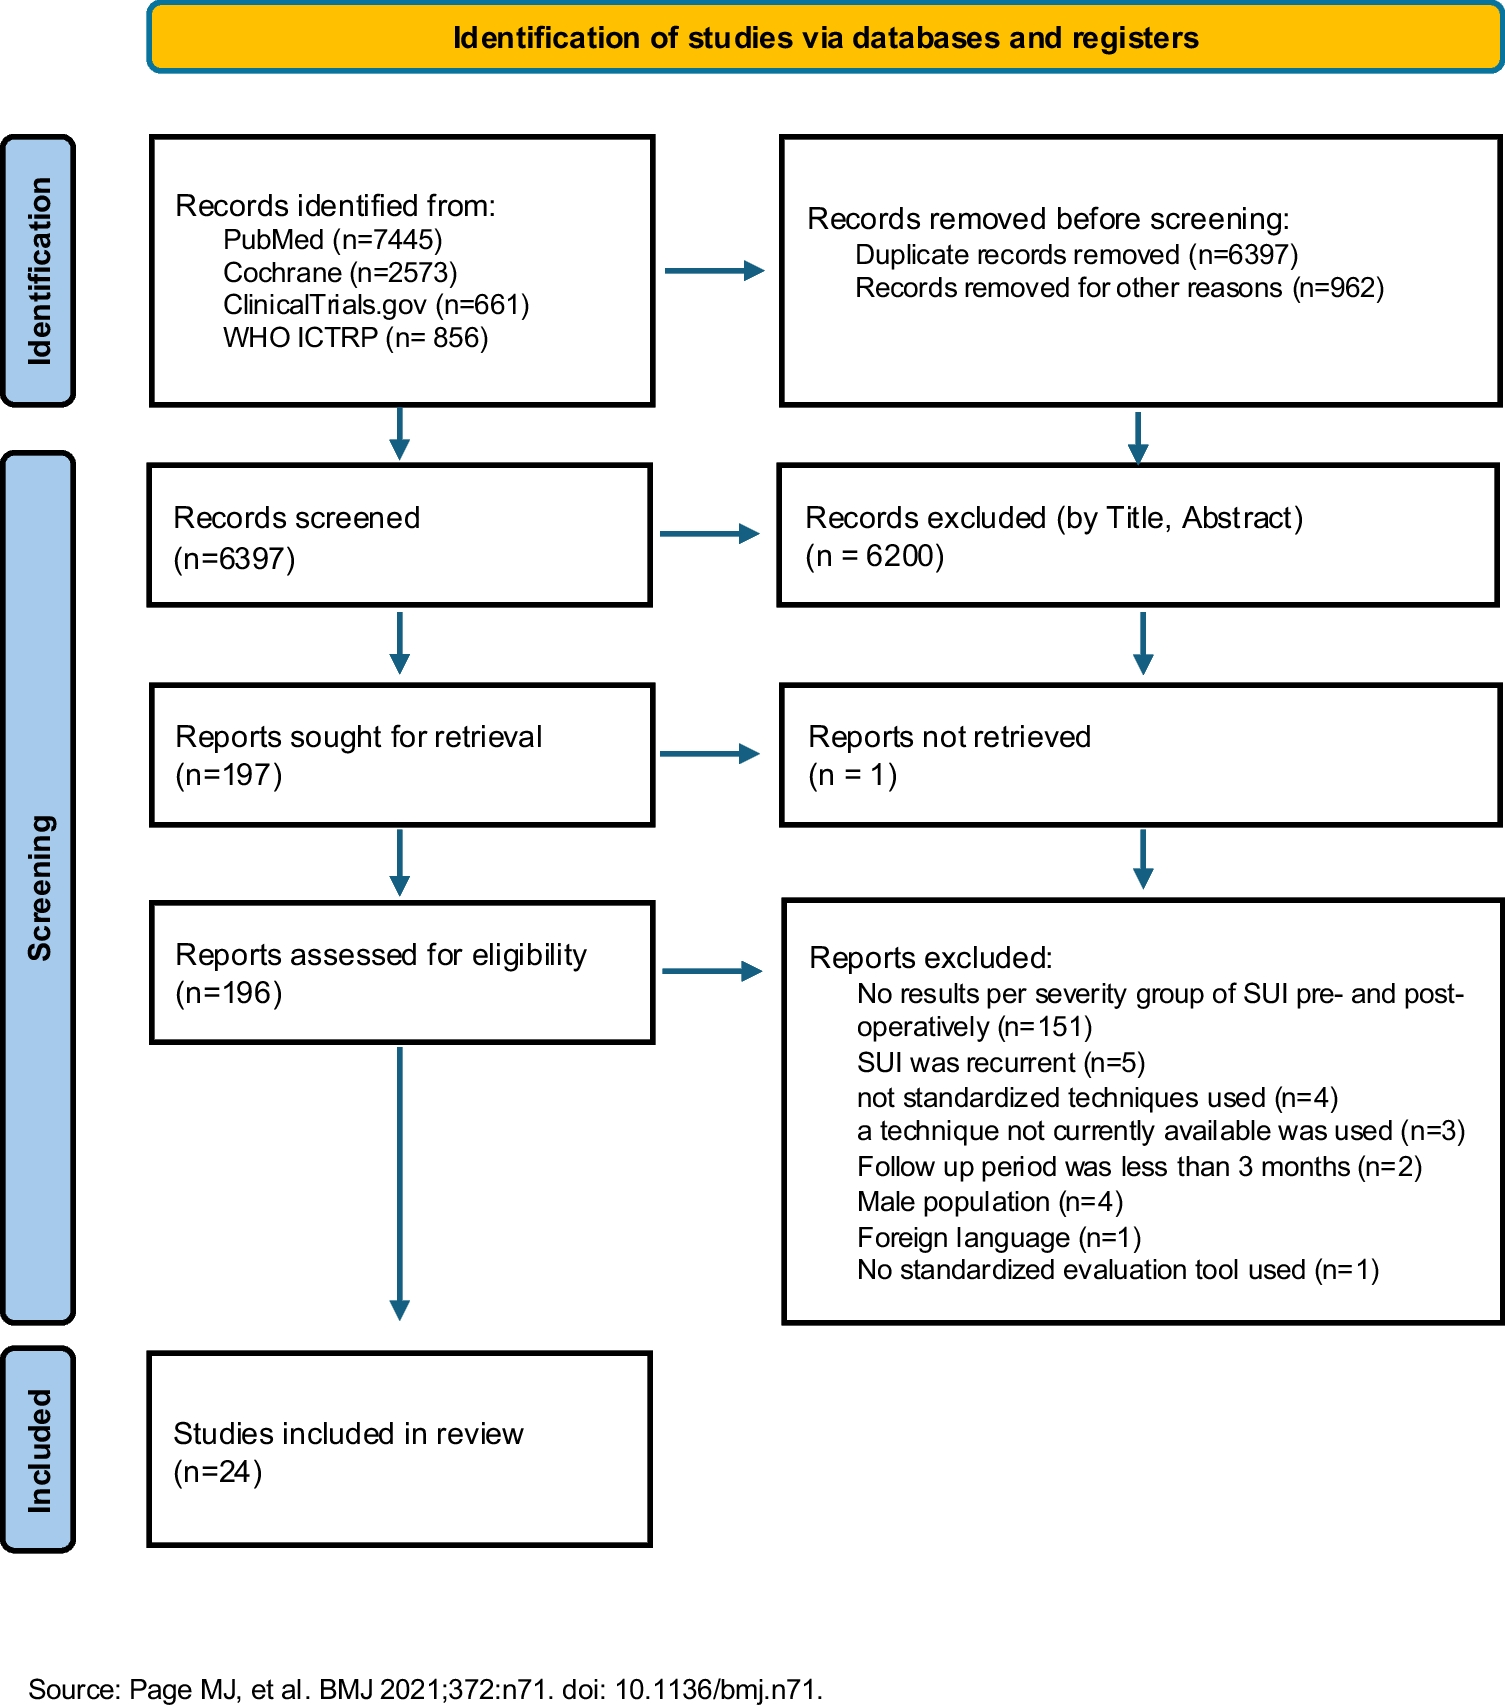
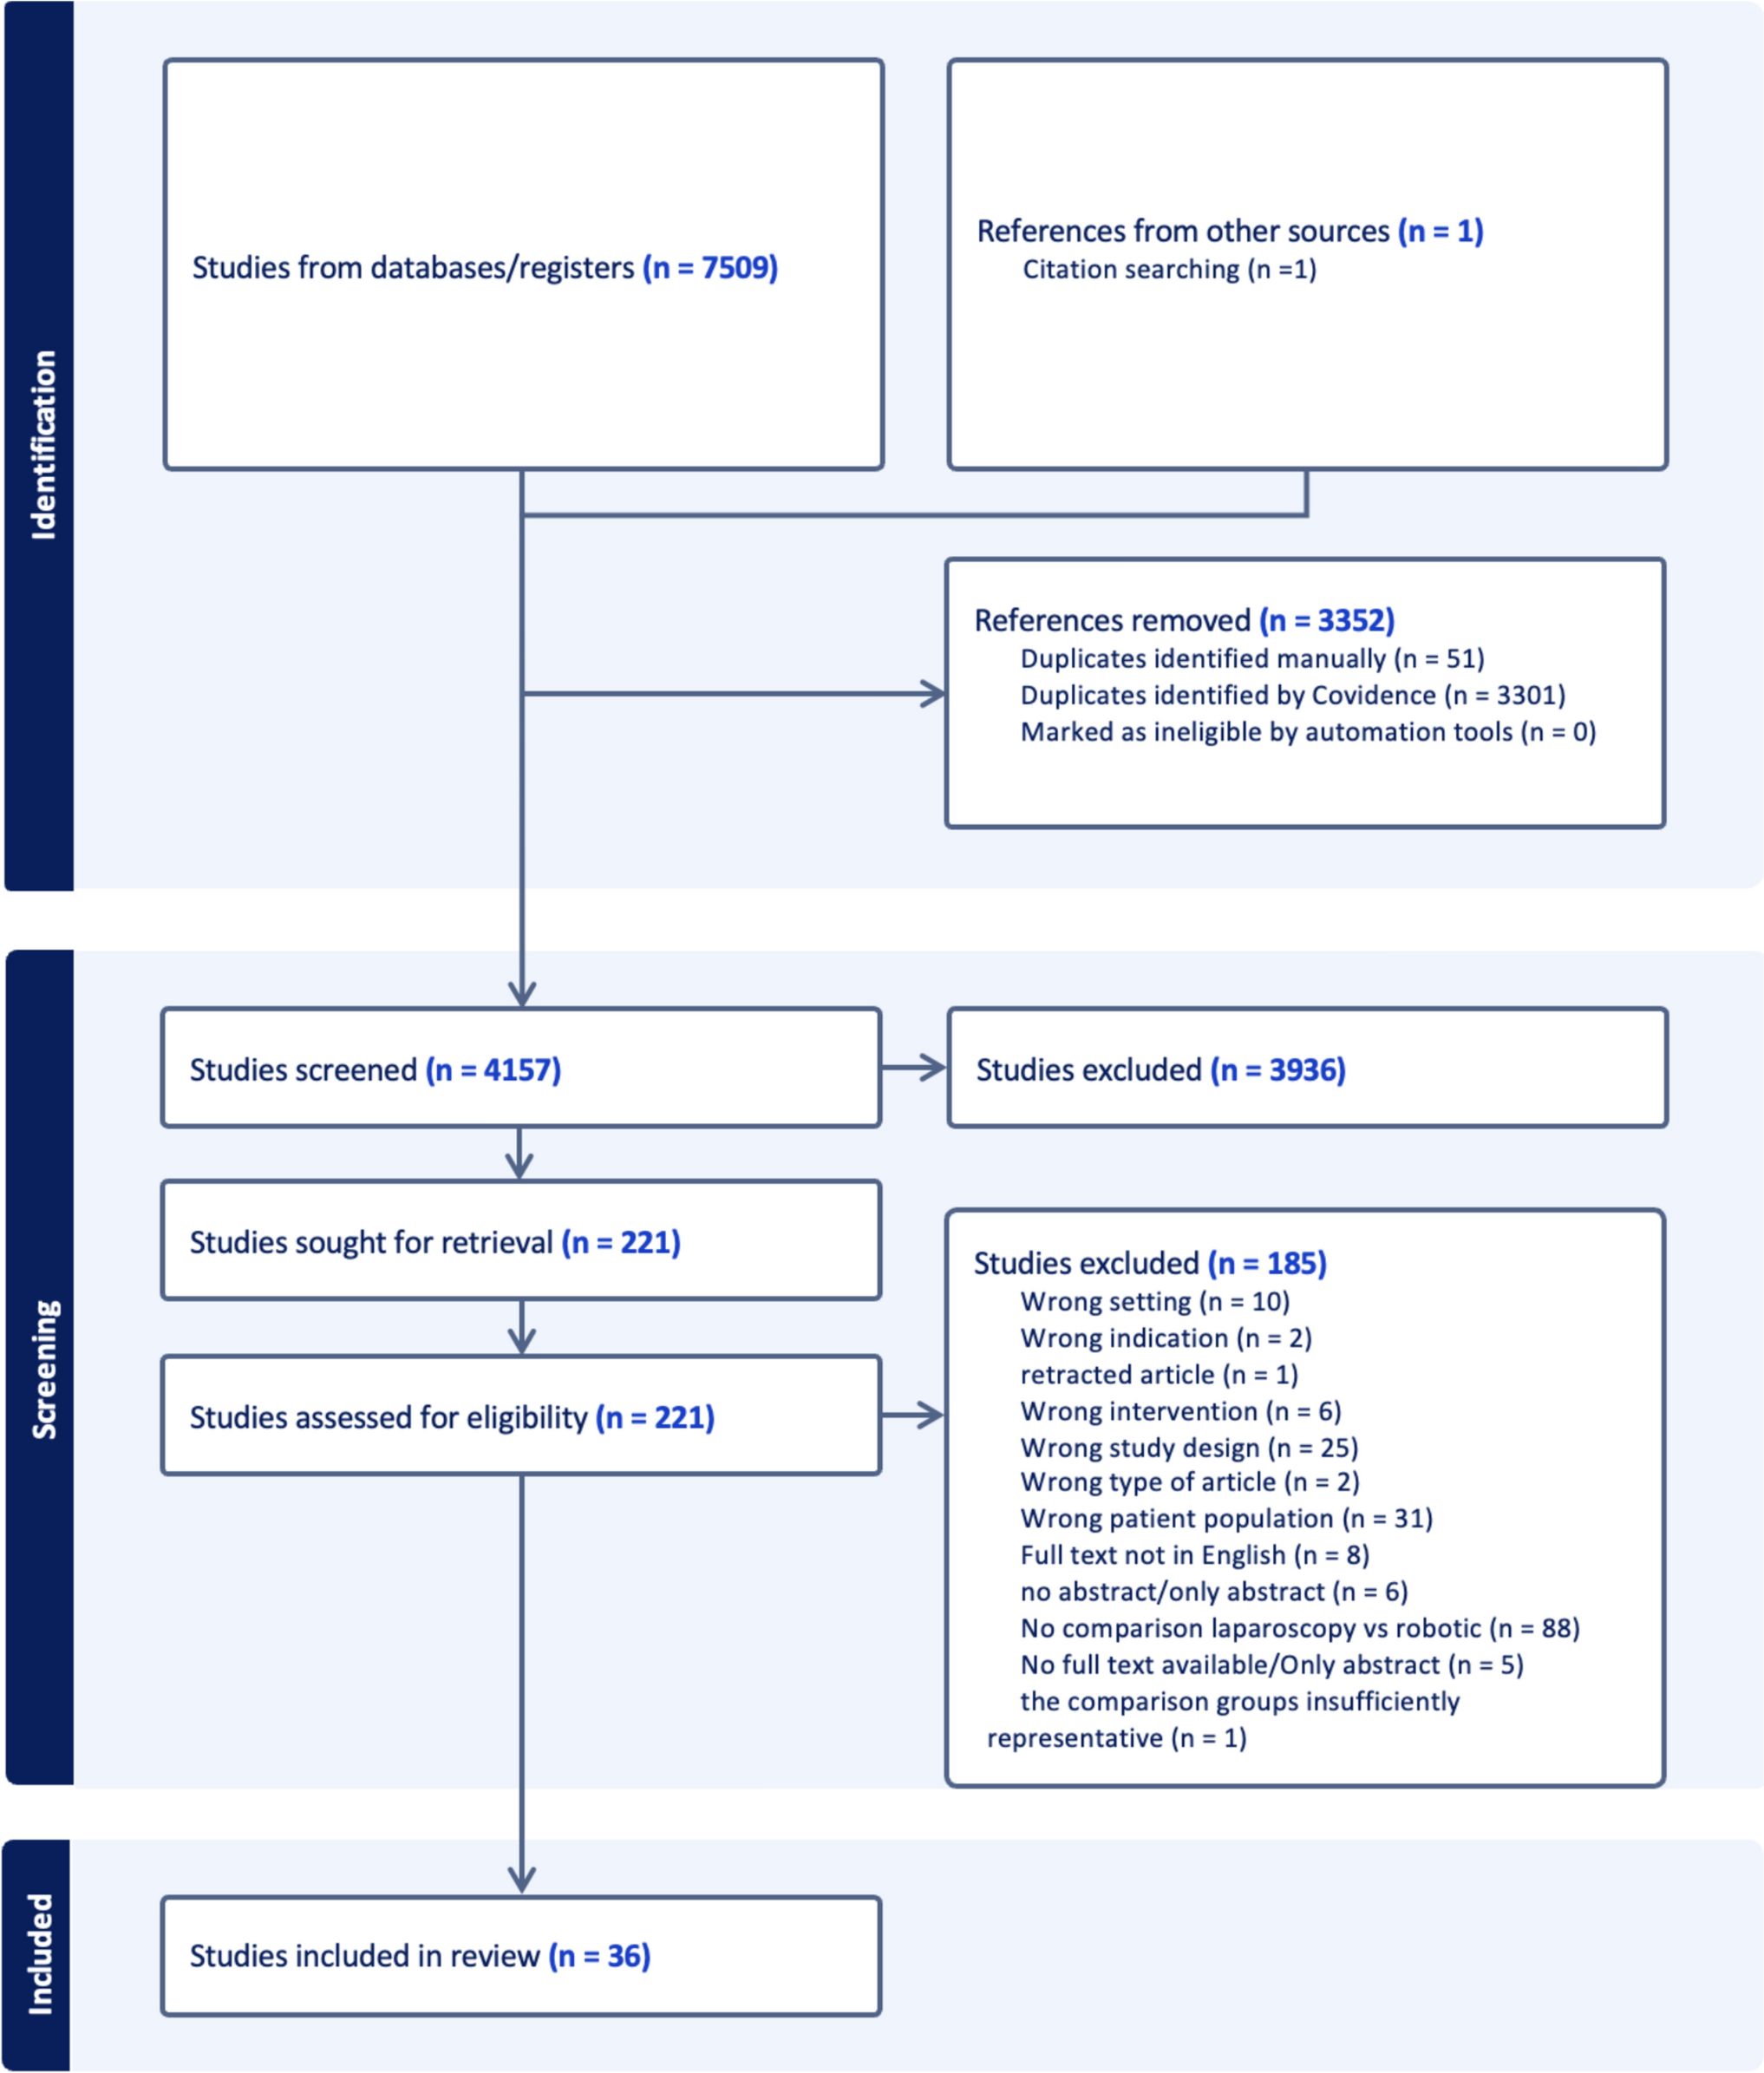
A total of 11,535 articles were found: PubMed: 4039, Cochrane: 3666, ClinicalTrials.gov: 325, WHO ICTRP: 856; Appendix 1). After removing the duplicate entries (6397), we excluded 197 articles based on title and abstract content. Another 172 articles were excluded based on exclusion criteria (PRISMA, Fig. 1, Appendix 1).
Fig. 1
Preferred Reporting Items for Systematic Reviews and Meta-Analyses flow chart
Study CharacteristicsFinally, a total of 24 studies (4380 patients) were included for further analysis. Of these, 6 were RCTs (1472 patients) [14,15,16,17,18,19], 11 were prospective nonrandomized studies (n = 543) [20,21,22,23,24,25,26,27,28,29,30], and 7 were retrospective cohort studies (n = 1937) [31,32,33,34,35,36,37]. In 13 studies (n = 3599) a synthetic or autologous graft was used (TVT 6 studies, trans-obturator vaginal tape/outside–in 2 studies, trans-obturator vaginal tape/inside–out (5 studies), single-incision mini-slings (SIMS; 2 studies), autologous/fascia lata sling (1 study)]; in 11 studies (n = 781) energy-based devices (erbium-doped yttrium aluminium garnet [Er:YAG] laser 5 studies) CO2 laser 3 studies, radio-frequencies (2 studies), or injectables (polydimethylsiloxane 1 study, platelet-rich plasma 1 study) were used.
Critical Appraisal Within Sources of Evidence/Risk of Bias in StudiesThe “Risk of bias summary” (Figs. 2a, 3a) summarizes the reviewers'judgements about risk of bias item for each included study. The “Risk of bias graphs” (Figs. 2b, 3b) illustrate the risk of bias of each category as percentages.
Fig. 2
a Risk of bias summary for randomized controlled trials (RCTs)/evaluation with the ROB-2 tool. b Risk of bias graph for RCT/evaluation with the ROB-2 tool
Fig. 3
a Risk of bias summary for randomized controlled trials (RCTs)/evaluation with the ROBINS-I tool. b Risk of bias graph for RCT/evaluation with the ROBINS-I tool
As stated above, RCTs (n = 6) were evaluated using the ROB-2 tool, non-RCTs and prospective studies (n = 11) were evaluated using the ROBINS-I tool, and retrospective studies (n = 13) were evaluated using the NOS.
Regarding the RCTs, 40 (54.1%) of the studies appear to have a low risk of bias, whereas the remaining 34 (45.9%) appear to have some concerns regarding bias (Fig. 2). Of the non-RCTs, 7 (26.9%) appear to have a serious risk of bias, 16 (69.2%) appear to have some concerns regarding bias, and 1 (3.8%) appears to have a serious risk of bias (Fig. 3).
Results of Individual Sources of Evidence/Results of Individual StudiesThe studies included are depicted in Table 1, in which the study design, the study time, the type of intervention, the number, and the mean age of the patients, as well as the type of instruments used for evaluation of the severity of SUI in each study are described (Table 1). Geographically, the studies were conducted in Europe (16 studies), Asia (4 studies), North America (3 studies), and South America (2 studies).
Table 1 Synthesis of resultsRegarding the instruments that were used for the evaluation of the severity of urinary incontinence peri-operatively, the objective evaluation was performed with the use of the 1-h pad test (2 studies) [19, 21], with the number of pads (2 studies) [26, 31], and with the McGuire classification (1 study) [14]. The subjective evaluation of the peri-operative severity of SUI was performed with the use of International Consultation Incontinence Questionnaire Urinary Incontinence Short Form (ICIQ-UI-SF; 7 studies) [20, 24, 25, 27, 28, 37, 38], with the Ingelman–Sundberg scale or its modifications (4 studies) [16, 29, 30, 34], with the Stamey grading scale (3 studies) [17, 32, 35], with the Sandvik Severity Index (2 studies) [18, 23], with the stress-related leakage, emptying ability, anatomy, protection, inhibition (SEAPI; 1 study) [36], and with a modified SUI scale (1 study) [22].
Results of SynthesesAccording to the results of these studies, successful treatment of mild or grade 1 incontinence was achieved in 84.73% of the patients (333 out of 393; 89.64%, 277 out of 309 patients who had MUS, and 66.67%, 56 out of 84 who had energy-based devices [EBDs]), successful treatment of moderate or grade 2 incontinence in 88.35% of the patients (1145 out of 1296; 92.01%, 1082 out of 1176 patients who had MUS, and 52.50%, 63 out of 120 who had an EBD), and successful treatment of severe/very severe or grade 3 incontinence in 75.73% of the patients (447 out of 591; 83.94%, 392 out of 467 patients who had MUS, and 44.35%, 55 out of 124 who had an EBD). However, dry rates (no incontinence) were achieved in 84.73% of the patients with mild or grade 1 SUI (333 out of 393; 89.64%, 277 out of 309 patients who had MUS, and 66.67%, 56 out of 84 patients who had an EBD), in 73.53% of the patients with moderate or grade 2 SUI (953 out of 1296; 78.32%, 921 out of 1176 patients who had MUS, and 26.67%, 32 out of 120 who had an EBD), and in 57.02% of the patients with severe/very severe or grade 3 SUI (337 out of 591; 70.66%, 330 out of 467 patients who had MUS, and 5.65%, 7 out of 124 patients who had an EBD). There was a statistically significant difference between grade 1, grade 2, and grade 3 success rates (grade 1 vs grade 3, p = 0.00056; grade 2 vs grade 3, p < 0.0001), but not between grade 1 and grade 2 success rates (grade 1 vs grade 2, p = 0.05744), and a statistically significant difference between grade 1, grade 2, and grade 3 dry rates (grade 1 vs grade 2, p = 0.0001; grade 1 vs grade 3, p < 0.00001; and grade 2 vs grade 3, p < 0.00001; Table 2).
Table 2 Results of interventions for stress urinary incontinence (SUI): the post-operative results are reported based on pre-operative grades of SUI severityA similar trend was found with both the objective and the subjective evaluation of SUI severity: the approach with the objective tools showed 86.53%, 81.19%, and 78.24% success rates in grade 1, grade 2, and grade 3 SUI respectively; the approach with the subjective tools showed 83.00%, 89.93%, and 71.20% success rates in grade 1, grade 2, and grade 3 SUI respectively.
According to our results, there was a statistically significant difference regarding the success rates between treatment of grade 1 SUI with MUS in comparison with treatment with energy-based devices (277 out of 309 vs 56 out of 84, p < 0.00001). Similarly, there was a statistically significant difference between treatment of grade 2 and grade 3 SUI with MUS in comparison with treatment with energy-based devices (1082 out of 1176 vs 57 out of 120, p < 0.00001; 381 out of 467 vs 55 out of 124, p < 0.00001).
The improvement in severity scores after treatment is depicted in Table 3. Overall, pre-operatively, 1.17% of patients had no SUI, 9.39% had mild (or grade I) SUI, 35.59% had moderate (or grade II) SUI, 49.39% had severe (or grade III) SUI, and 11.56% had very severe SUI. Post-intervention, 46.20% of the patients were dry, 24.86% had mild (or grade I) SUI, 27.04% had moderate (or grade II) SUI, 7.93% had severe (or grade III) SUI, and 1.34% had very severe SUI (Table 3).
Table 3 Results of interventions for stress urinary incontinence (SUI): the post-operative results are reported based on pre-operative grades of SUI severityFurther meta-analysis could not be performed due to the significant heterogeneity of the methodology and the reporting of the outcomes of the studies.
Comments (0)