
Remember me
We perform our experiments on two datasets which are Object-CXR [10] and the LVOT dataset. We provide details about the datasets in Sect. 4.1, our general approach in evaluating the saliency maps in Sect. 4.2, measure the effect of smoothing the saliency maps in Sect. 4.3, make a comparison during the initialization and post-training phases in Sect. 4.4, and compare the variability across different neural network models in Sect. 4.5. We make the code and the experiments available on https://github.com/canerozer/explainable-iqa.
DatasetsObject-CXR is a benchmarking dataset with the objective of recognizing and localizing foreign objects on Chest X-Rays. It contains a total of 10, 000 Chest X-Ray images, with 5, 000 images including foreign objects and 5, 000 images without.
Left Ventricular Outflow Tract (LVOT) detection is a cardiac MR dataset where the presence of LVOT is a local quality issue that hinders the accurate analysis of atrial regions. The dataset is composed of a range of 4-chamber cardiac MRI scans from 690 2D+ time patient records, with an even number of samples with and without LVOT. We apply a patient-wise splitting on the dataset, using 551 patients for training, 69 patients for validation, and 70 patients for testing. Since our network is designed to handle 2D images, we consider each of the slices of the four-chamber view independently. Hence, we expand the number to 8, 682 good quality and 8, 522 LVOT samples.
For the Object-CXR dataset, we directly use the bounding boxes released by JFHealthcare as part of the original benchmark, which were manually produced by expert annotators. For the LVOT dataset, ground-truth annotations were generated through a two-step process. First, an experienced cardiologist manually delineated the LVOT region using a pixel-wise segmentation mask on all slices where the structure appeared. Second, we computed the tightest axis-aligned bounding box that enclosed the segmentation mask, and used this bounding box solely for Pointing Game evaluation. A senior radiologist reviewed a randomly selected subset of the segmentation masks and confirmed their correctness.
Object-CXRWe train ResNet-34 [31] and EfficientNet-B0 [56] models, both predicting whether there is at least one foreign object present or not, given a resized \(600 \times 600 \times 3\) image. We fine-tune these models, previously trained on the ImageNet dataset [57], for 20 epochs using a batch size of 16 and a cross-entropy loss function. We adapt our input by triplicating it on the channel axis three times and replace the last layer of the pre-trained model, which now has two output neurons, with random parameters using He initialization [58]. In order to optimise the parameters during the training procedure, we use the Stochastic Gradient Descent with Momentum optimiser, with a learning rate set to 0.005, and the learning rate reduced by a factor of 10 every five epochs. Also, to prevent overfitting during training, we use colour jittering, affine transformations, and horizontal flips as data augmentations. Finally, we keep the best-performing model, based on validation accuracy. The performance of the models in terms of AUC score and accuracy is presented in Table 7, where we observe that the peak performance was achieved in the first trial of the ResNet-34 (R34) model, reaching an accuracy of 0.870 and an AUC score of 0.938.
LVOT detectionWe train ResNet-50 and EfficientNet-B0 models, which predict the presence or absence of LVOT, given a \(224 \times 224 \times 3\) input image. Similar to the Object-CXR, we use an ImageNet pre-trained model and fine-tune the model with Stochastic Gradient Descent with Momentum optimizer, setting the learning rate to 0.0002 and weight decay to 0.0005. The fine-tuning procedure takes 60 epochs using a batch size of 64 when the cross-entropy loss function is used. Additionally, the same types of data augmentations employed in the foreign object detection task are used. Our best LVOT detection model achieves top performance in the first trial of the ResNet-50 (R50) model, with an accuracy and AUC score of 0.971 and 0.998, respectively. For the rest of the paper, we refer to this dataset as the LVOT dataset.
Experimental evaluation on the saliency mapsIn order to analyse the saliency maps, we conduct a qualitative and quantitative assessment of the validation and testing sets for the Object-CXR and LVOT datasets. We begin by examining the impact of applying smoothing to the saliency maps generated by these methods. Subsequently, we delve into randomisation experiments, evaluating the saliency maps under two conditions: (i) complete randomisation of model parameters and (ii) adoption of convolutional layer parameters from ImageNet with randomised classification layer. We compare these outcomes with the results obtained from the trained models, showcasing their repeated Pointing Game scores. Lastly, we present our reproducibility results, intended to observe the consistency in Pointing Game accuracies across different models, specifically ResNet and EfficientNet.
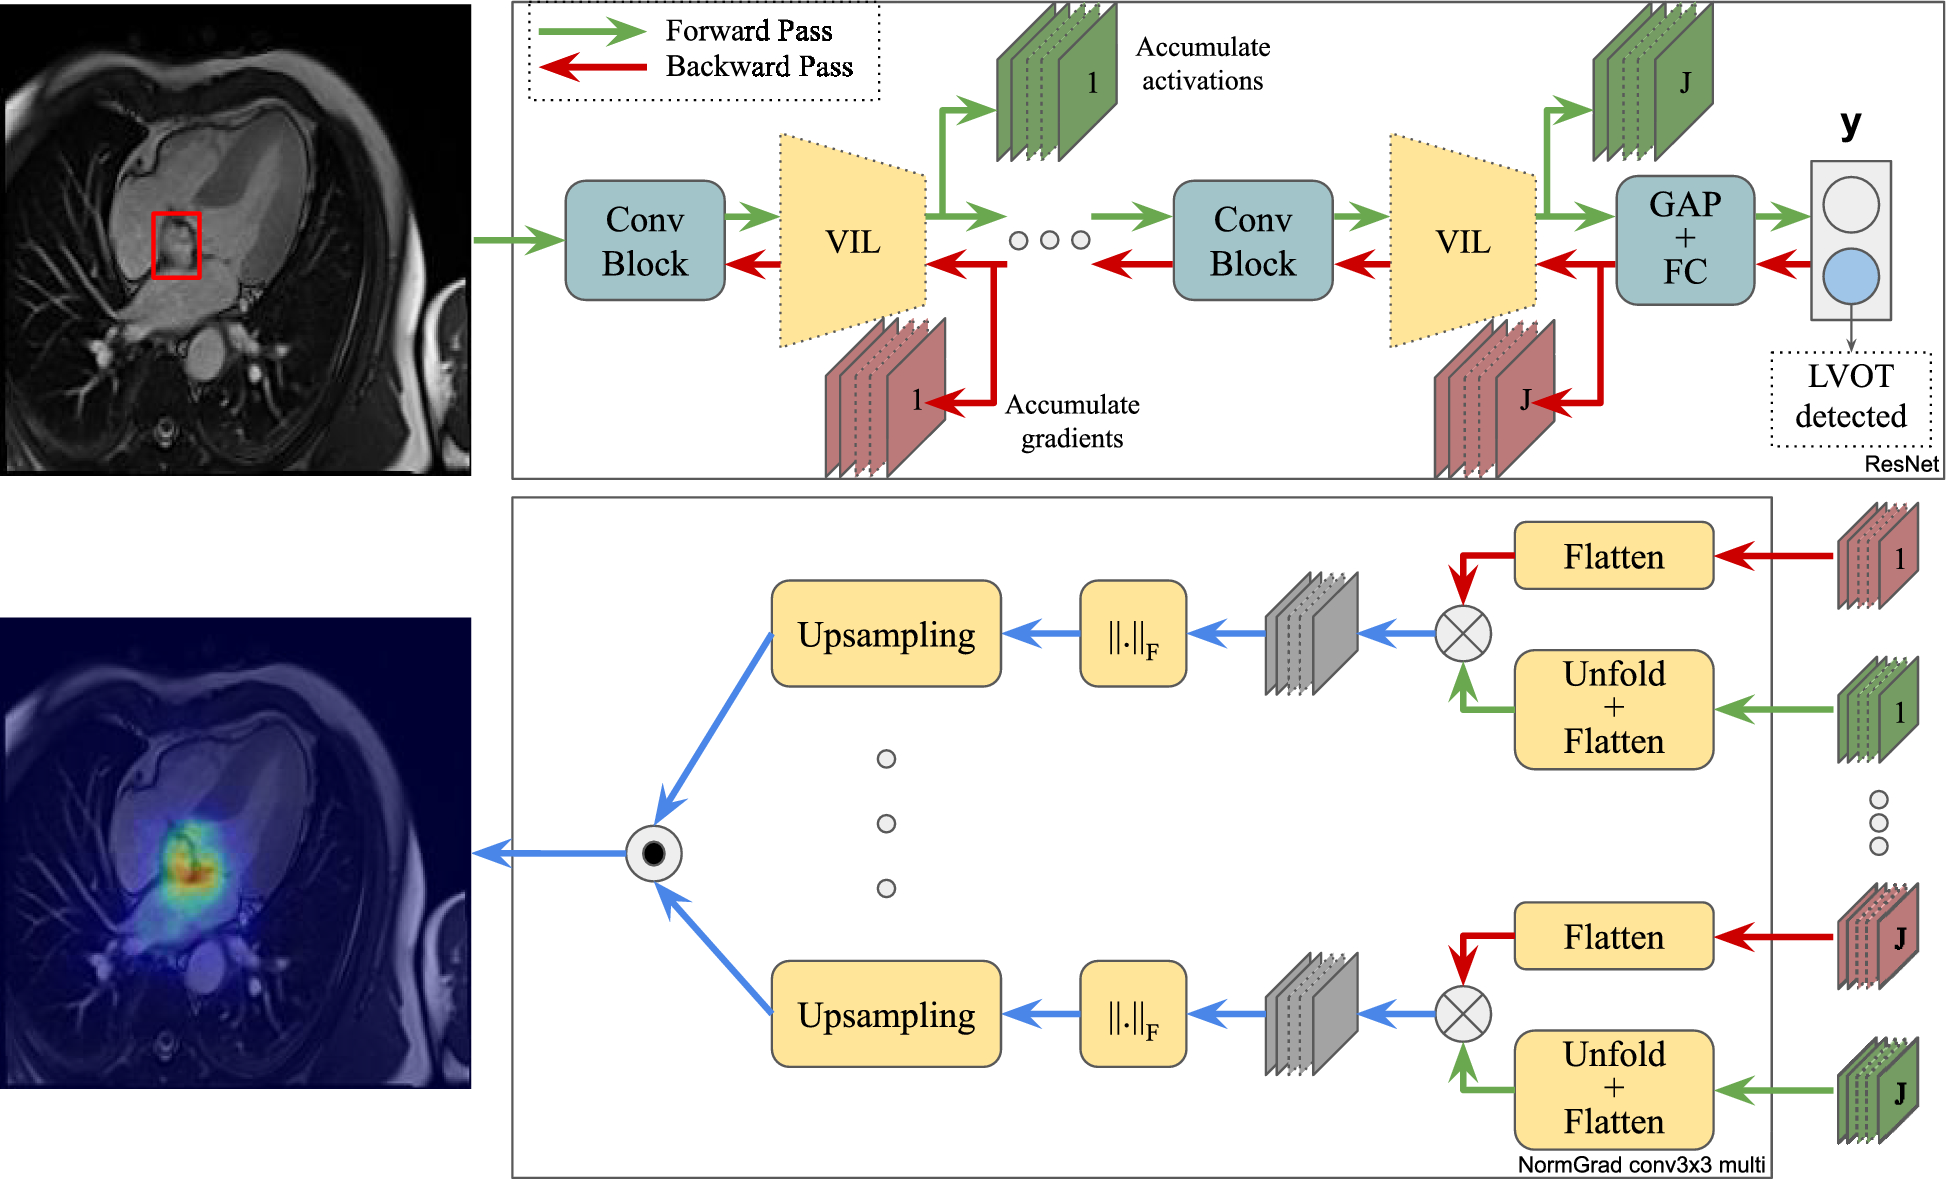
To highlight the abilities of NormGrad, we do not only stick to using the penultimate layer (conv4.2) of ResNet-50. We also use the spatial contribution at \(J=4\) different layers, e.g., conv2.0, conv3.0, conv4.0, and conv4.2 after aggregating the saliency maps corresponding to numerous layers of the ResNet architecture. For EfficientNet models instead, despite NormGrad Single also using the penultimate layer of the model (features.8.2), we aggregate the spatial contribution at \(J=10\) layers, namely, features.0.0, features.1.0, features.2.0, features.3.0, features.4.0, features.5.0, features.6.0, features.7.0, features.8.0, and, features.8.2. Then, we compare our results with other saliency detector baselines such as Grad-CAM [43], Guided Grad-CAM [43], Guided Backpropagation [41], and Input x Gradient [42].
In our study, we use Pointing Game [18] for quantitatively analysing the abilities of saliency detectors. Our purpose is to detect if saliency maps show a correspondence with the ground-truth bounding boxes given a medical scan. In Pointing Game, we measure this correspondence by finding the maximum value of a saliency map and then checking the maximum value’s proximity to the ground-truth with an offset, \(\tau\). We take the default value, \(\tau =15\), for both datasets. If the maximum value is close enough to the bounding boxes, we define the saliency map to be accurate. If we name the number of accurate saliency maps with T and inaccurate ones with F, we can derive an accuracy metric A such that:
$$\begin A = \frac \end$$
(5)
Effect of smoothing the saliency mapsFig. 2
The smoothing operation when used on different interpretability methods. Although IxG (Input x Grad), GBP (Guided Backpropagation), and Guided GradCAM’s saliency outputs change heavily, we do not observe such drastic changes in the saliency maps generated by GradCAM and NormGrad. Red bounding boxes demonstrate the ground-truth annotations for foreign objects
This study investigates the effects of smoothing on the performance of various saliency detectors for medical image quality problems. Motivated by the work of [18], which suggests that some methods such as Grad x Input tend to output noisy saliency maps and require a smoothing operation to reduce sparsity and noise, a Gaussian kernel with a standard deviation of 1.0 was applied to smooth the saliency maps. The results of smoothing the saliency maps are shown in Fig. 2, where it is observed that saliency maps generated by GradCAM and NormGrad are stable, but Input x Grad (IxG), Guided Backpropagation (GBP), and Guided GradCAM are not. We also notice that the conv3x3 multi model of NormGrad successfully focuses on all target foreign objects of interest, especially on the clip at the top. Furthermore, Table 2 demonstrates that the changes in Pointing Game accuracies are insignificant for both LVOT and Object-CXR datasets when NormGrad or GradCAM is used. However, smoothing becomes increasingly crucial for methods that directly use gradient information, as seen in the first three rows of Table 2. Therefore, smoothing was applied in all comparisons to provide fairness across all saliency detectors while considering the noisiness factor of Input x Grad, Guided Backpropagation, and Guided Grad-CAM. Despite this, the success of NormGrad is still evident, while the Multi versions of NormGrad appear to be more consistent when their performance on both datasets is considered.
Table 2 Pointing Game accuracies for all available saliency methods, with and without the application of smoothing, are reportedRandomisation and repeatability experimentsIn this part of our study, our goal is to demonstrate interpretability by measuring the Pointing Game accuracy of randomly initiated and trained models. We are influenced by the work of [14], which claims that saliency maps have several shortcomings, as saliency detectors are not always robust to randomisation, repeatability, and reproducibility. To measure the effect of randomisation on the saliency maps, we examined two different configurations to initialise the models. First, we use a model with all parameters randomised (Fully Randomised, FR) and second, we inherit an ImageNet [57] model for convolutional layer parameters and randomise only the final fully-connected layer (Semi Randomised, SR). Our purpose in analysing the models during the initialisation stage is to see whether it is possible to catch any significant difference in the interpretability maps after training the neural network. Hence, we assess whether we can use this information as an alternative way of measuring a deep learning model’s performance in terms of explainability. During full randomisation, we used He initialisation [58] to randomise the weight parameters whereas for semi-randomisation, we used the ImageNet pre-trained model parameters. While repeating these randomisation experiments three times to have an estimate with high confidence, we also train three models with different seeds to demonstrate the performance as a result of training. We also make a comparison between pre- and post-trained models’ performance. In all our experiments, we report the mean and standard deviation of the Pointing Game accuracy.
Higher Pointing Game scores for fully randomised models than for semi-randomised models can occasionally occur because broad architectural activation and gradient patterns may overlap with the target region by chance, relative to the expected behavior of a model that has not learned any meaningful representation. These randomised networks are included only as diagnostic baselines to help assess the stability of saliency extraction under different initialization conditions, and their scores do not correspond to meaningful localization capability.
Results for the LVOT experimentsIn Table 3, we demonstrate the randomisation and repeatability experiments for the LVOT dataset. First, we notice a significant improvement in the Pointing Game accuracies after training the networks and running all of the saliency detection methods. As we demonstrate in Fig. 3, we associate it with the appropriately learned representations to fulfill the task and aggregate the information coming from different layers. This also leads to another statement that it is almost obligatory to train the neural networks for making them point to relevant regions of interest.
Table 3 Pointing Game accuracies (mean±standard deviation) of all available saliency methods when the model is initiated via ImageNet parameters except for the final fully-connected layer (Semi-randomised, SR), random parameters at full (Fully-randomised, FR), and repeatedly trained and examined (Repeated) for the LVOT datasetFig. 3
Saliency maps before and after training. Learning appropriate representations has an enormous effect on the quality of saliency maps. Still, combining the saliency map information of different layers is crucial with regard to precision. The red bounding box highlights the LVOT region as the ground-truth
Secondly, utilizing the multi versions of NormGrad can result in substantial improvements in Pointing Game accuracy compared to the performance of single-layer saliency detectors. Transitioning from GradCAM to the multi layer setting of NormGrad Conv1x1, we observe an enhancement in our Pointing Game accuracy from 0.547 to 0.611. Further advancements are evident upon adopting the multi layer setting in place of the single-layer setting of NormGrad. The most notable performance improvement is observed in the NormGrad Conv3x3 setting, achieving a repeated Pointing Game accuracy of 0.602 from 0.430 by utilizing multiple layers. This improvement can be attributed to the efficiency of NormGrad Multi in localizing small target regions of interest, considering the activation maps and gradients of four different layers. Lastly, we cannot draw a conclusive statement for the LVOT dataset regarding whether using pre-trained parameters would enhance the initial performance of Pointing Game accuracy since, for some NormGrad settings, fully-randomised models outperform their semi-randomised counterparts. This observation can be linked to the LVOT region’s small size compared to the image, suggesting that the multi configuration of NormGrad, utilizing gradients and activations from various layers, is crucial for addressing this limitation.
The consistency of NormGrad methods after retraining the models is also visually evaluated by comparing them with the baseline methods, revealing noticeable changes in saliency maps. As shown in Fig. 4, Input x Grad and Guided Backpropagation (GBP) present issues with additional focus on the background. GradCAM may exhibit saliency outside the cardiac area or fail to focus on the target region of interest in case of misclassification, and Guided GradCAM is reliant on the performance of GradCAM and GBP. However, NormGrad maintains consistency by covering the cardiac area in saliency maps and even enhances precision by combining saliency maps generated by multiple layers.
Fig. 4
Repeatability results for a sample from the LVOT Test Set (Best viewed in zoom). Consistent results are achieved for GradCAM, Guided GradCAM, and NormGrad methods, while the precision is the best for the Multi-setting of NormGrad. The LVOT region is indicated with a red bounding box, and the most salient point is marked with a cross
Results for the object-CXR experimentsThe results for the Object-CXR dataset are presented in Table 4, indicating a significant improvement in methods after training the models, similar to the LVOT dataset. As depicted in Fig. 5, this improvement is visually apparent after training the models. However, it is important to note that not all trained representations are relevant. In the "Trained" column of Fig. 5, saliency detectors like Input x Grad and Guided GradCAM highlight a region on the left side of the neck, not present for NormGrad-based methods, as seen in the bottom two rows of the same figure. NormGrad successfully identifies all foreign objects and even improves precision when using the multi-setting of NormGrad. Moreover, the standard deviations of the repeatability experiments on the Object-CXR dataset for the NormGrad methods are relatively smaller than the baselines’ standard deviations, demonstrating the confidence and utility of the NormGrad methods as an unbiased interpretability measurement tool regardless of task repetition. There is also an insignificant difference among the NormGrad methods, all of which outperform the baseline models. Interestingly, GradCAM has the lowest repeated Pointing Game metric among all saliency detectors, raising questions about its ability to point to relevant regions through saliency maps, as illustrated in Fig. 5. In summary, NormGrad provides the best results, achieving the highest mean repeated Pointing Game performance of 0.853 using the single layer and Conv3x3 setting. Additionally, unlike the results for randomisation in the LVOT detection task, there is an improvement in the Pointing Game accuracy as a result of using ImageNet features, attributed to the increased area of the foreign objects of interest.
Table 4 Pointing Game accuracies (mean±standard deviation) of all available saliency methods when the model is initiated via ImageNet parameters except for the final fully-connected layer (Semi randomised, SR), random parameters at full (Fully randomised, FR), and repeatedly trained and examined (Repeated) for the Object-CXR datasetFig. 5
Saliency maps before and after training demonstrate the significant impact of learning appropriate representations on their quality. Red bounding boxes highlight the ground-truth annotations for foreign objects
Reproducibility experimentsAnother criterion for evaluating the reliability of saliency detectors is their reproducibility on different architectures. In this context, we assess their performance whenever we train a completely different network architecture. We compare the saliency detection performance of ResNet with EfficientNet-B0 [56] for both tasks and propose a basic metric named "Difference of Means" (DoM) to measure the consistency under a change in network architecture. From our perspective, a saliency detector should be model-agnostic, and the generated saliency map should only depend on the input image. Consequently, the Pointing Game scores corresponding to different model architectures need to be similar, and the DoM measure provides a quantification of the consistency of the saliency detection method. To calculate the DoM measure, we obtain the repeated Pointing Game metric for each of the network architectures, and we find the absolute difference between their means. A lower DoM score indicates a more consistent saliency detection method, whereas a higher DoM score signals inconsistency in the saliency detection method across different architectures.
Pointing Game accuracies form empirical sets of scalar outcomes, not samples from a continuous probability model. Distributional divergences such as Kullback–Leibler and Jensen-Shannon therefore do not apply in this regime. In contrast, Maximum Mean Discrepancy (MMD) [59] provides a nonparametric comparison suitable for empirical scalar sets. In the one-dimensional case with a linear kernel, MMD reduces to the absolute difference of the means, which corresponds exactly to the DoM metric we employ. This correspondence allows DoM to be interpreted as a principled, distribution-based measure of consistency between saliency detectors across architectures.
Table 5 Pointing Game performances are compared across two different network architectures: ResNet (R50) and EfficientNet (EB0)Table 6 Pointing Game performances are evaluated on two network architectures: ResNet (R34) and EfficientNet (EB0)In Tables 5 and 6, we evaluate the performance of baseline methods and NormGrad on the LVOT and Object-CXR datasets using two different architectures. First, we observe that the performance of NormGrad methods surpasses that of the baselines on both datasets, except for GradCAM when the ResNet-50 (R50) architecture is used for the LVOT detection task. Notably, when single-layer methods perform poorly, NormGrad becomes more effective and precise by combining information from different layers, as all multi-layer settings of NormGrad exceed the baselines. Second, the best performance is achieved by the single-layer version of NormGrad for the LVOT detection task using the EfficientNet-B0 (EB0) model, while there is a slight discrepancy between this setting and the best setting for the Object-CXR benchmark. However, we also notice significant differences in mean Pointing Game performance when comparing these two models under the single-layer version of NormGrad, particularly for the LVOT detection task. Although this issue does not occur for the Object-CXR benchmark, the use of multiple layers is crucial for accurate model interpretation, as indicated by the minimal DoM measure on both datasets. The differences in the saliency maps generated by different models are illustrated in Fig. 6 for the Object-CXR dataset.
It is worth mentioning the effect of using different VIL types, as their behavior varies noticeably across datasets and configurations. We observe distinct behaviors of the visualization layer (VIL) types depending on the dataset. For Object-CXR, differences among Scaling, Conv1×1, and Conv3×3 are minimal, with all variants achieving similarly high Pointing Game accuracies. Because foreign objects in Object-CXR are comparatively large and visually prominent, precise spatial modeling through the VIL plays a less critical role. For LVOT, however, the choice of VIL has a substantial impact. In the single-layer configuration, NormGrad Scaling performs best among the VIL types. In the multi-layer configuration, Conv1×1 achieves the highest performance, with differences being more pronounced in the EB0 architecture than R50. This pattern arises from the characteristics of the LVOT detection problem: in our dataset, the LVOT region tends to be localized near the image center, making global channel-wise reweighting (Scaling and Conv1×1) more effective than larger spatial kernels.
Fig. 6
Reproducibility results for a sample from Object-CXR Test Set when ResNet-34 (R34) and EfficientNet-B0 (EB0) architectures are utilized for foreign object detection task. Consistent results are achieved for NormGrad methods since it focuses on all three foreign objects of interest. Red bounding boxes demonstrate the ground-truth annotations for foreign objects
Comments (0)