
Remember me
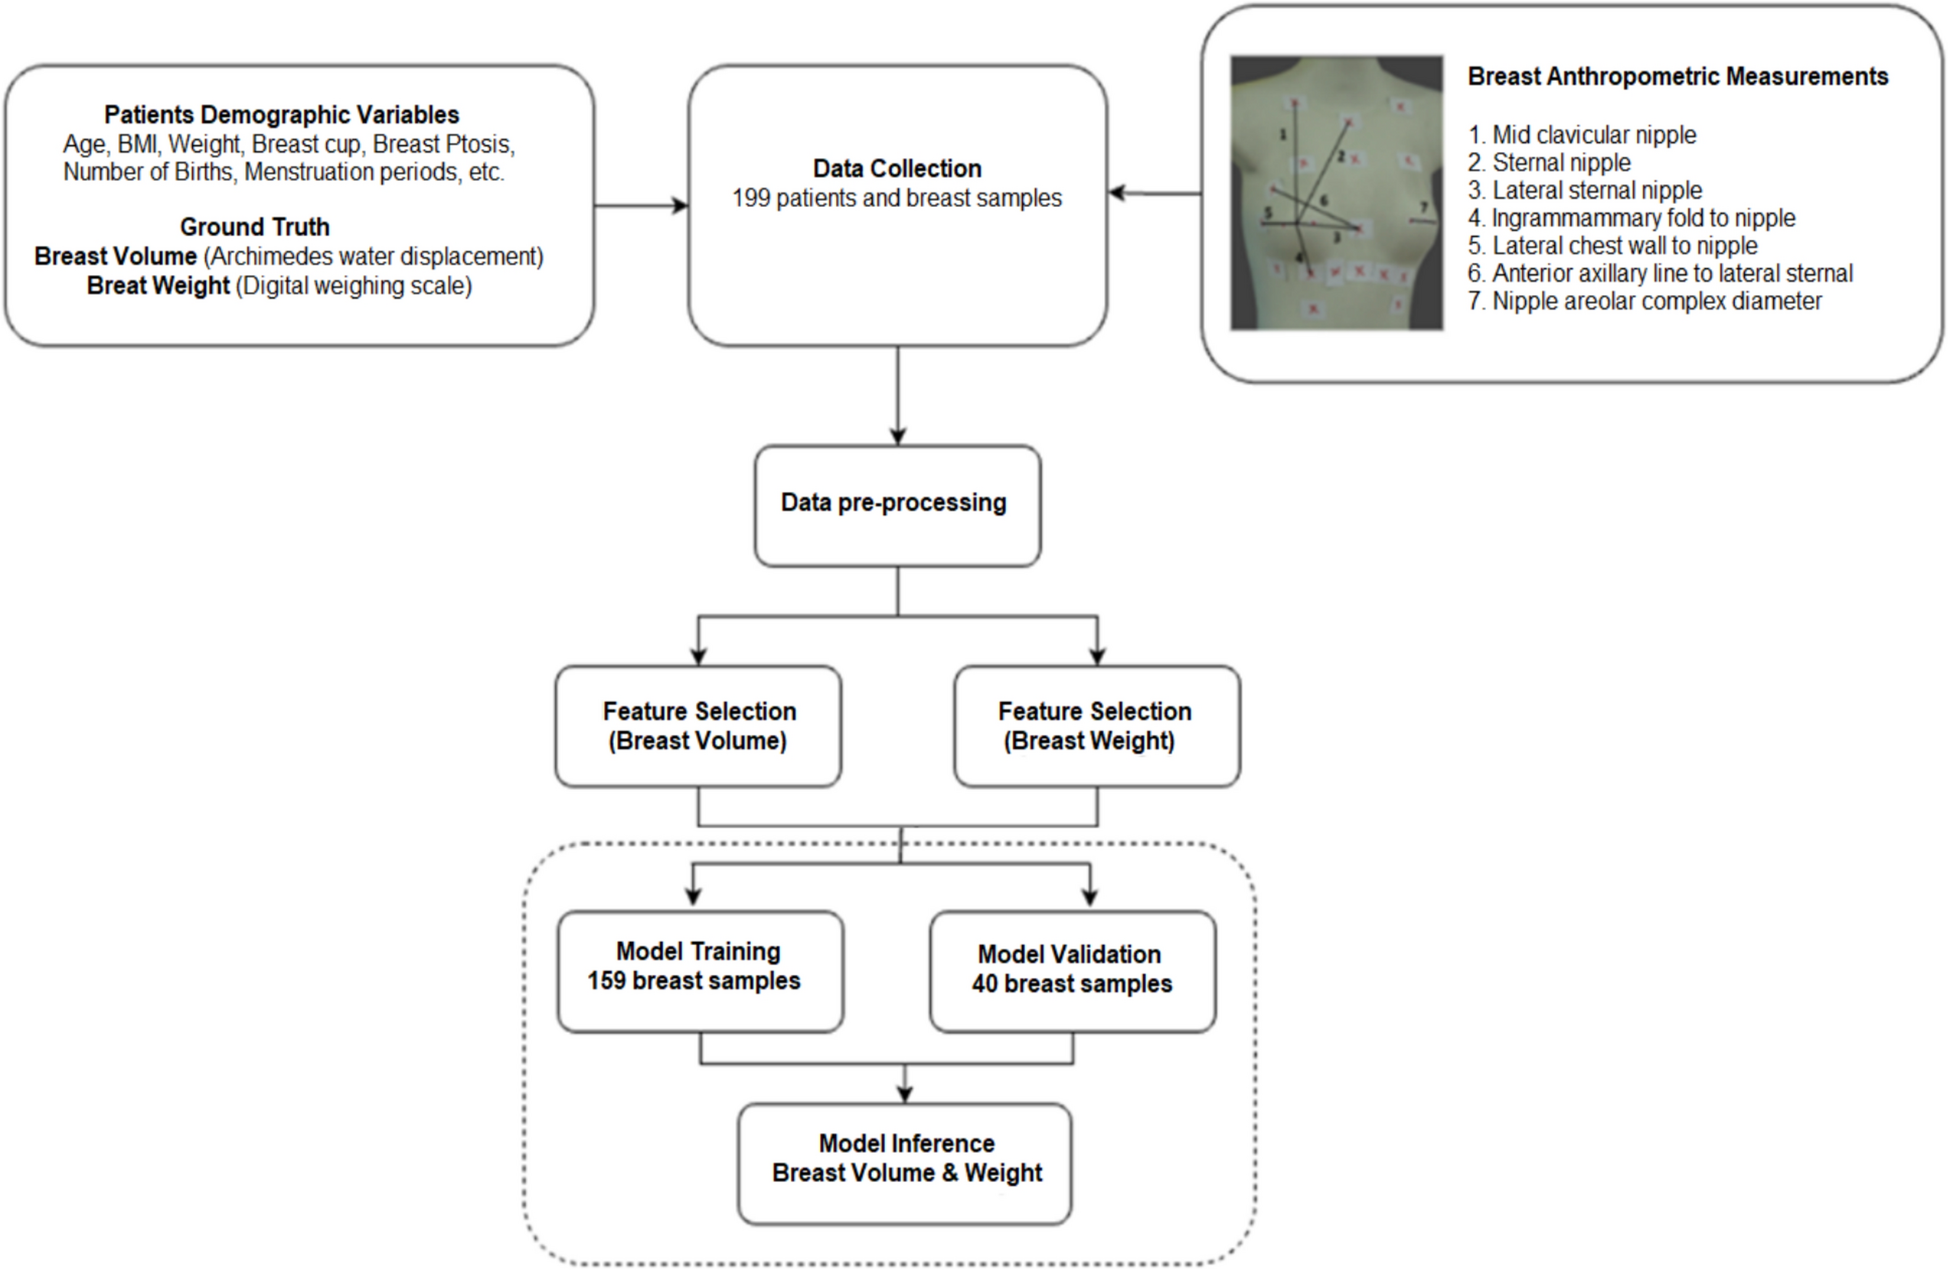
The dataset was collected at UMMC and comprised the records of 199 patients. Each record contained an exhaustive list of attributes, along with written diagnoses, breast volume, and weight.
Breast volume and weight distributionA total of 199 sets of breast data have been collected (BMI = 25.33 ± 5.29). The study included 199 patients with a mean age of 60.3 years (range: 31–95 years) and a median age of 61 years. In terms of ethnicity, 111 patients were Chinese (55.8%), 58 were Malay (29.1%), and 30 were Indian (15.1%). The distributions for breast volume and weight were skewed to the right, as shown in Fig. 2. This trend was also observed in a study of 41,102 women (BMI = 25.4 ± 4.2)[49].
Fig. 2
Histogram and kernel density plot for a breast volume and b breast weight. The plot is based on the data of 199 patients. It can be observed that the distribution for both breast volume and weight were skewed towards the right
Statistical analysisA two-sided hypothesis test using the Spearman Correlation Coefficient was performed on each patient’s demographic and breast anthropometric variables, regarding breast volume and weight, where the correlation (r) and significance (p-value) were computed. The results are documented in Table 1.
Table 1 Descriptive and statistical analysis (Spearman Correlation Coefficient) of patients’ demographic and breast anthropometric variables in relation to breast volume and weightIn breast volume prediction, surgeons at UMMC identified clinically significant features, including BMI, ptosis severity, cup size, age at first childbirth, weight, and seven breast measurements (nipple-areolar diameter, lateral sternal–anterior axillary line, sternal–nipple, mid-clavicular–nipple, and lateral sternal–nipple distances), along with hormonal contraception use. Chosen for their clinical relevance and impact on breast shape, these features encompass both physiological and geometric factors that affect breast volume. By integrating these elements, the expert-derived set enhances model interpretability and provides insight into why expert feature selection sometimes surpasses algorithmic approaches in capturing clinically meaningful variations in breast volume.
Interestingly, several highly significant features (p £ 0.01) were shared between breast volume and breast weight, namely BMI, ptosis severity, breast cup, first childbirth, weight, and all seven breast anthropometric measurements (nipple areolar complex diameter, lateral sternal anterior axillary line, sternal nipple, mid-clavicular nipple, and lateral sternal nipple). Hormonal contraception proved to be moderately significant in breast volume estimation, but not for weight, although its p-value of 0.05 was close to the threshold of significance. A moderate correlation (\(0.40 < \left| value} \right| < 0.69\)) could be observed for breast volume and weight with breast cup, BMI, body.
weight and five of seven breast anthropometric measurements[51]. A notable discovery was that a large proportion of features that had a statistically significant effect on one characteristic displayed an equal influence on its counterpart, leading to the hypothesis that statistical models of both tasks were reliant on highly similar indicators.
Feature selectionThe important features from Boruta, statistical (Spearman Correlation Coefficient), and the domain expert are documented in Table 2. Notably, BMI, breast cup, and all seven breast anthropometric measurements were shown to be associated with breast volume and weight. Additionally, the number of childbirths, age at first childbirth, and body weight were found to be useful predictors of breast volume and weight that met the criteria imposed by Boruta (importance score ≥ 0.80) and statistical tests (p < 0.01). Features identified by breast surgeons at UMMC included BMI, ptosis severity, breast cup size, age at first childbirth, body weight, seven breast anthropometric measurements (nipple-areolar complex diameter, lateral sternal–anterior axillary line, sternal–nipple, mid-clavicular–nipple, and lateral sternal–nipple distances), and hormonal contraception use. These features were selected based on their clinical relevance and known influence on breast morphology, integrating both physiological and geometric determinants of breast volume. By explicitly incorporating features with mechanistic and morphometric significance, the domain expert feature set enhances the interpretability of the predictive model. This approach also helps explain why expert-guided feature selection may outperform purely algorithmic methods, particularly in capturing clinically meaningful variations in breast volume.
Table 2 List of important features in determining breast volume and weight. ‘*’ indicates the attribute is selected by the respective feature selection methodsBreast volume estimationTable 3 compares the results of models trained on the three feature sets using the three machine learning algorithms: linear regression, SVR (with a linear kernel), and random forest regression. The linear regression model, operating purely on features selected by domain experts, performed remarkably well across all three-validation metrics, with an R-squared value of 81.81% and a minimum MAE of 94.70; a correlation value of 0.91 indicated a strong and dependable statistical model. The random forest regressor performed comparably, with an R-squared value of 74.22% and an MAE of 105.61; however, it could be improved by utilizing features obtained through a standard statistical test. One could hypothesize that expert-defined features, informed by genuine medical expertise, yield a more generalizable model compared to statistically selected characteristics that are only determined based on a limited training set. Furthermore, a clear linear relationship existed between attributes and breast volume, as evidenced by the linear regression model outperforming its more complex and non-linear counterparts by up to 17.77%.
Table 3 Performance of machine learning models for breast volume predictionThe best model for breast volume estimation, Mvolume, a linear regression model trained with domain experts features is depicted as follows:
$$}_}}} \;}\;}}\;}\;}}\;}\;}\;}}\;}\;}\;}}\; - \;}}\;}\;}}\;}\;}}\; - \;}}\;}\;}}\;}\;}}\;}\;}}}$$
(7)
Breast weight estimationTable 4 details the results for breast weight estimation. For breast weight, the linear regression model operating on statistically selected features outperformed its counterparts, with an R-squared value of 72.02%. In contrast, the SVR model, using the same feature set, displayed a stronger correlation score of 0.8701. In terms of MAE, the linear regression model for BORUTA features performs the best. In contrast to the prediction of breast volume, models trained on features selected by domain experts produced the worst overall performance.
Table 4 Performance of machine learning models for breast weight predictionThe linear regression model trained on statistical data for breast weight estimation, Mwieght, is given by:
$$M_}}} = }.}f_}} ~ + }.}f_}} ~ - }.}f_}} ~ + }.0}f_}} ~ - }0.0}f_}} ~ + }.}f_}}} ~ - }.}f_}}} ~ + }.}f_}}} ~~ + }.}f_}}} ~ + }.}f_}}} ~ + }.}f_}}} ~ - }.}0f_}}} ~ - }.}0f_}~}} + }0.}_}$$
(8)
Interestingly, we find that there is a high correlation between the weights for the breast anthropometric measurements features , for both breast volume and weight models. Specifically, the features have a positive sign, while the features have a negative sign.
More results analysisTo gain further insights into the model's performance, we conducted additional analyses on the prediction results for the full dataset (comprising both training and validation sets) of 199 samples. For prediction of breast volume on the whole dataset, the r-squared (r2) was 91.00% and MAE was 94.7 ml. The 95% Confidence Interval (CI) [lower, upper] for the ground truth value is [-16.66 ml, 14.949 ml].
From the graph in Fig. 3a, it could be observed that the volume predicted by the machine learning model was highly correlated (r = 0.91) with the Archimedes breast volume. Interestingly, Fig. 3b shows that the range between the first and third quartiles of the predicted volume for each ptosis severity type was within ± 100 ml. Notably, there were only a total of six outliers in the mild, moderate, and severe ptosis categories, but within the no ptosis category itself, there were 12 outliers.
Fig. 3
Performance analysis of breast volume estimation using the best machine learning model. a Actual-prediction plot showed that the volume predicted by the machine learning model was highly correlated (r = 0.91) with the Archimedes breast volume. b Volume-difference boxplot showed that the range between the first- and third-quartile of the predicted volume for each ptosis severity type was within ± 100 ml
For predicting breast weight, the r-squared (r2) on the whole dataset was 87.01%. The MAE value was 112.8959 g. The 95% CI [lower, upper] with actual values were -15.38 g and 14.95 g, respectively. In the actual-prediction plot in Fig. 4a, the predicted weight by machine learning showed a strong correlation with the ground-truth weight (r = 0.87). Furthermore, the machine learning model kept the error well within ± 100 g. Additionally, the boxplot in Fig. 4(b) indicated that the range between the first and third quartiles of the predicted weight for each ptosis severity type was within ± 100 g. As in breast volume prediction, there were significantly more outliers for the no ptosis category.
Fig. 4
Performance of breast weight estimation using the best machine learning model. a Actual-prediction plot shows that the weight predicted by machine learning was highly correlated (r = 0.87) with the ground truth weight. b Weight-difference boxplot showed that the range between the first- and third quartile of the predicted weight for each ptosis severity type was within ± 100 g
Comments (0)