
Remember me
Data on 1,217 out of a possible total of 1,240 events were captured yielding a data capture rate of 98.10%. Event capture rates were 99.50% for ‘In OR’, 100% for ‘Pre-Procedure Verification’, 97.69% for ‘Timeout’, 99.50% for ‘Incision’, 92.08% for ‘Closure’, and 100% for ‘Out of OR’ timestamps (Table 1). On average, each single-panel case in the EHR involved 253 clickable, documentable events.
The minimum overall error rate for any of the six events studied was 9.95%. This exceeded the expected error rate of 0.1% to 0.5% for a simple routine task. This can be interpreted in one of several ways. Either the task of time-stamping in the EHR is far more complex that we understood it to be or the complexity and/or stress in the environment influences performance of these tasks to such a degree that it assumes the performance metrics of a complicated non-routine task with an error rate at or above 10%.
The analysis of EHR documentation by event type revealed differences in the accuracy, delay rates, and error rates across distinct procedural milestones. 1,010 events (82.99%) were correctly documented, with varying levels of errors among event types. The ‘Pre-Procedure Verification’ had the highest error rate at 27.31%, followed by ‘Out of OR’ at 20.30%. ‘Timeout’ and ‘Closure’ had moderate error rates at 14.69% and 15.05%, respectively. The lowest error rates were observed in ‘In-OR’ (13.93%) and ‘Incision’ (9.95%) (Table 1).
Documentation delays were observed in 630 events, 51.40% of the total, with significant variability across event types. The highest delay rates were found in ‘Pre-Procedure Verification’ (97.87%) and ‘Timeout’ (81.42%), both of which occur during the busiest phases of the surgery and involve multiple team members who are frequently multi-tasking. In contrast, ‘Closure’ and ‘Out of OR’ had lower delay rates at 22.09% and 20.74%, respectively. The average length of delays for procedures with recorded delays varied significantly, with the longest average delays occurring during ‘Pre-Procedure Verification’ (25.25 min) and ‘In OR’ (23.92 min). In contrast, ‘Closure’ and ‘Incision’ experienced shorter delays, averaging 5.85 min and 5.18 min, respectively. These findings underscore the relationship between the complexity and activity levels of different procedural events and the percentage and duration of delays.
Table 1 Results by event Type. Documentation accuracy and delays in EHR time-stamping by event type. Metrics include the total number of events, the percentage of events correctly recorded, delays (frequency and average duration in minutes), and error rates. The average delay for “Out of OR” events could not be calculated, as nurses frequently documented this event outside the OR after patient had left and the observers were unable to discern when Documentation occurredThe chi-square analysis of error rates by OR size revealed a statistically significant relationship to the ‘Pre-procedure Verification’ event (p = 0.0320), with larger ORs exhibiting higher error rates compared to smaller ones. This finding suggests that higher error rates occur in environments or periods of increased complexity. Typically, procedures performed in larger ORs involved service lines (GEN, NEURO, ORTH) that require more equipment, personnel, and intricate workflows, introducing additional complexity in these cases.
Similarly, the chi-square analysis of the number of nurses involved in charting demonstrated a statistically significant association with higher error rates during ‘Pre-procedure Verification’ event when more than one nurse was present in the room (p = 0.0145). In contrast, other procedural steps, including ‘In OR,’ ‘Timeout,’ ‘Incision,’ ‘Closure,’ and ‘Out of OR’ did not exhibit significant differences (p > 0.05). Consistent with previous studies [13], an increased number of individuals potentially sharing charting responsibilities may increase environmental complexity during the early stages of the procedure, where clear communication and task delineation are critical.
Interestingly, linear regression did not find a significant effect of surgery length on overall error rates (β = 0.00034, 95% CI [–0.00102, 0.00171], p = 0.387; R² = 0.375). Likewise, interruptions in nurses’ charting were also not significantly related to overall error rates (β = 0.00333, 95% CI [–0.00060, 0.00726], p = 0.068; R² = 0.869). However, logistic regression analyses indicated that predictors of increased error rates for the ‘Pre-procedure Verification,’ included having more than one nurse charting (OR = 3.02, 95% CI [1.14–8.01], p = 0.026) and procedure lengths between 11 and 20 min (OR = 0.20, 95% CI [0.044–0.946], p = 0.043). The former of these results suggest that additional people in the room and the latter, compression of case length when charting 253 tasks/case in EHR may also contribute to environmental complexity that increases error rates.
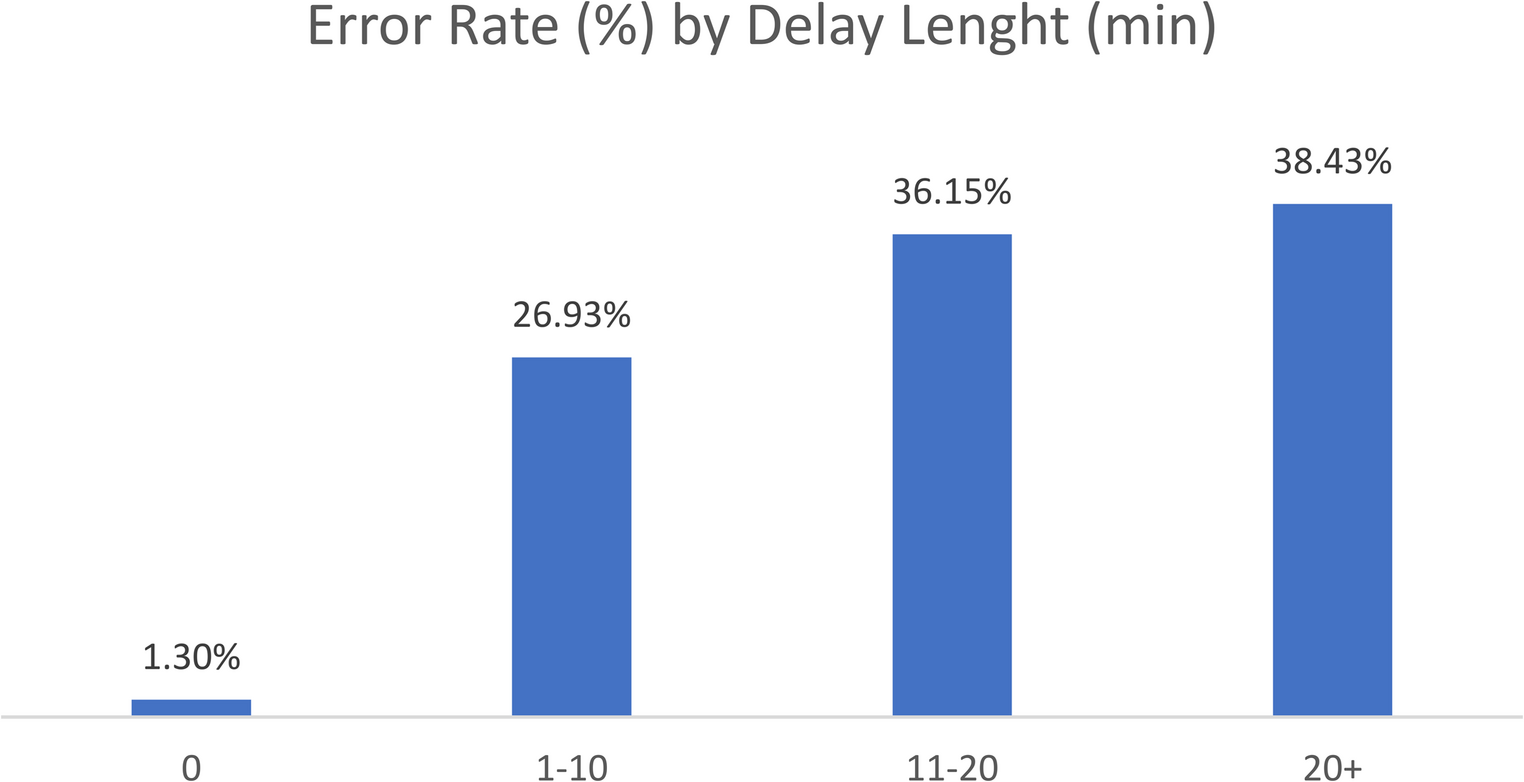
Correlation analysis demonstrated a strong positive link between overall delay rates and overall error rates (r = 0.71). Notably, when no delay occurred between the event and its documentation, the error rate was as low as 1.30% (Fig. 1.). However, error rates escalated sharply with increasing length of delays: 26.93% for delays of 1–10 minutes, 36.15% for 11–20 minutes, and peaking at 38.43% for delays exceeding 20 minutes. Logistic regression analysis indicated that delays exceeding 20 minutes were significantly associated with increased error rates during the ‘Timeout’ event (OR = 348, 95% CI [8.6–13,960], p = 0.002), while shorter delays (1–10 minutes) were significant predictors of errors at the ‘Incision’ event (OR = 12.7, 95% CI [2.8–57.0], p < 0.001). No significant predictors were identified for the ‘In-OR,’ ‘Closure,’ or ‘Out of OR’ events (p > 0.05).
Fig. 1
Error rate by delay length in minutes
The proportion of delays varied significantly between service lines, with the lowest percentage observed in Gastroenterology (37.21%) and the highest in Orthopedics (71.19%), followed closely by Neurosurgery (69.49%). Dental and Plastic Surgery also showed high delay rates at 58.62% and 45.76%, respectively. The average length of delays ranged from as low as 7.10 min in Otolaryngology and 8.24 min in Gastroenterology to 16.65 min in General Surgery, and 19.39 min in both Orthopedics and Multi-Panel (cases involving multiple service lines). Neurosurgery exhibited the longest average delay at 24.62 min (Table 2).
Table 2 Results by service Line. Documentation accuracy and delays in time-stamping by surgical service line. Metrics include the total number of events, the percentage of events correctly recorded, delays (frequency and average duration in minutes), and error ratesThere was a clear relationship between procedure complexity and error rates. While Gastroenterology had the lowest error rate (9.30%), Orthopedics again had the highest (33.90%), with Neurosurgery (28.81%) and Multi-Panel cases (25.89%) also exhibiting elevated error rates. These results underscore that as procedure complexity increases—whether due to equipment requirements, larger teams, or intricate workflows—the error rate rises.
Comments (0)