
Remember me

The analytical dataset included 429,610 participants, and after an average of 12.3 years follow-up (5,297,095 person-years for aortic aneurysm incidence and 5,306,264 person-years for aortic aneurysm mortality), a total of 2434 incident aortic aneurysm cases (71 of these were from death records only) and 122 aortic aneurysm deaths occurred. Participants with higher total cholesterol tended to be older, and more women and white participants had higher total cholesterol (Table 1). In addition, those with higher cholesterol were on average less deprived, had lower education, were more likely to be hypertensive and less likely to use lipid-lowering medications, but little differences were observed in smoking status, BMI, physical activity and height across quintiles of total cholesterol (Table 1). Characteristics of study participants across quintiles of LDL, non-HDL cholesterol, HDL cholesterol, triglycerides and lipoprotein(a) are shown in Supplementary Tables 1–5.
Table 1 Characteristics of participants in the UK biobank study by quintiles of total cholesterol concentrationsIn the multivariable model, after adjustment for age, sex, ethnicity, Townsend Deprivation Index, education, smoking status and cigarettes per day, BMI, physical activity, height, hypertension, and lipid-lowering medications, we observed positive associations between the highest vs. lowest quintile of total cholesterol (HR 1.22, 95% CI 1.07–1.41), LDL cholesterol (1.39, 1.21–1.60), apolipoprotein B (1.52, 1.33–1.74), non-HDL cholesterol (1.50, 1.29–1.73), triglycerides (1.23, 1.06–1.42), lipoprotein(a) (1.34, 1.17–1.54) and aortic aneurysm risk, while HDL cholesterol (0.57, 0.48–0.67) and apolipoprotein A1 (0.54, 0.46–0.63) were inversely associated (Table 2). These associations were strengthened for total cholesterol (1.30, 1.12–1.53), LDL cholesterol (1.46, 1.25–1.71), apolipoprotein B (1.57, 1.35–1.83), and non-HDL cholesterol (1.58, 1.34–1.86) (Supplementary Tables 6–9), but remained similar for the remaining lipids (Supplementary Tables 10-13), when the first 5 years of follow-up was excluded. The positive associations for total cholesterol, LDL cholesterol, apolipoprotein B, non-HDL cholesterol, triglycerides, and lipoprotein(a) tended to be stronger in men than women. The positive and inverse associations tended to be most pronounced for abdominal aortic aneurysm, and null or weaker for thoracic aortic aneurysm and unspecified aortic aneurysm (Supplementary Tables 6–13). When stratified by whether the aneurysm ruptured or not, associations were in general similar to the main analysis for non-ruptured aortic aneurysm, and statistically non-significant for ruptured aortic aneurysm, however, there were few cases of ruptured aortic aneurysm (Supplementary Tables 6–13).
Table 2 Associations between quintiles of blood lipid concentration and aortic aneurysm in UK biobankWhen aortic aneurysm mortality was examined, the results were mixed with null associations for total cholesterol (HR for highest vs. lowest quintile 0.68, 95% CI 0.34–1.34), LDL cholesterol (0.92, 0.47–1.80), apolipoprotein B (1.34, 0.69–2.58), non-HDL cholesterol (0.89, 0.44–1.80) and triglycerides (1.07, 0.55–2.09), but a positive associations was observed for lipoprotein(a) (2.27, 1.22–4.20), while HDL cholesterol (0.36, 0.15–0.85) and apolipoprotein A1 (0.42, 0.20–0.88) were inversely associated (Supplementary Tables 6–13).
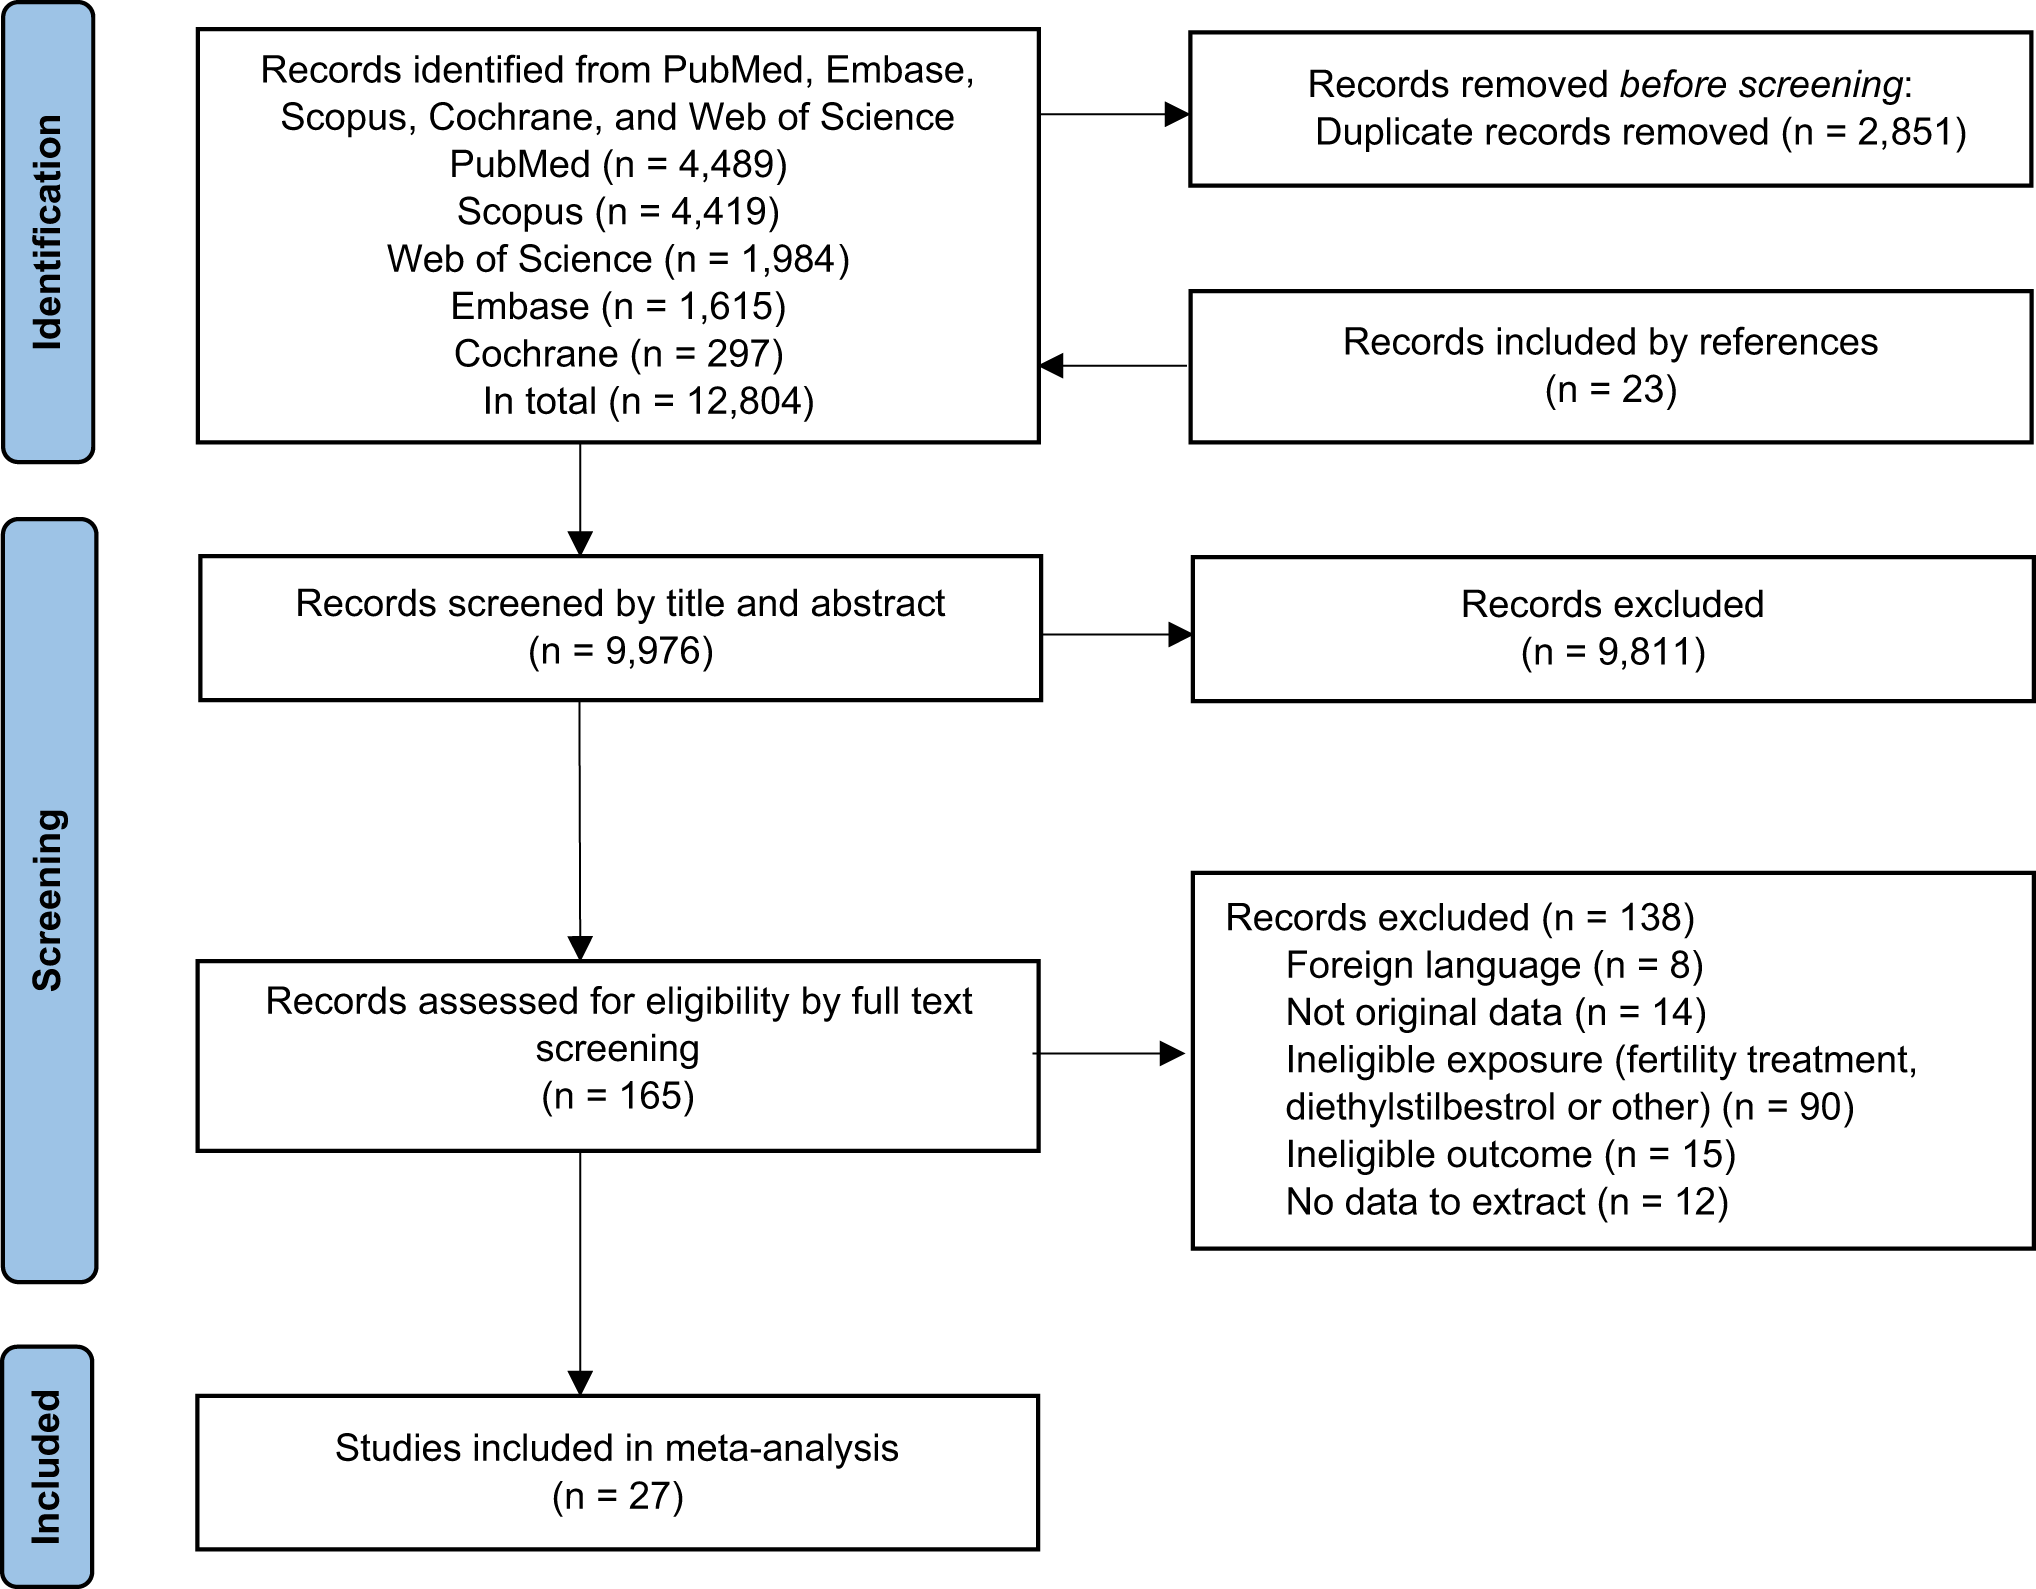
Meta-analysisLiterature searchThe database searches generated a total of 3,675 records, and 3,555 records were excluded based on screening of title and abstract, leaving 120 records for full-text review. Out of these, 98 records were excluded due to various reasons (Fig. 1, Supplementary Table 14), leaving 22 publications with data from 18 cohort studies included in the systematic review and meta-analysis [3, 5, 8, 18,19,20,21,22,23,24,25,26,27,28, 43,44,45,46,47,48,49,50] in addition to the UK Biobank study (Supplementary Table 15). Two publications reported results from the same cohort [8, 20], but one reported categorical results (included in the nonlinear dose-response analysis) [20], and the second reported continuous results (included in the linear dose-response analysis) [8].
Fig. 1
Flow-chart of study selection for systematic review and meta-analysis of blood lipids and aortic aneurysm risk
Study characteristicsThe characteristics of the studies included are summarized in Supplementary Table 15. Twelve studies were from Europe (including the present study), five studies were from the USA and two studies were from Asia. Five studies were in men only, while thirteen included both men and women, and one included women only. Fourteen studies had a follow-up time ≥ 10 years, while only five studies had a follow-up duration of < 10 years. The number of participants varied from 175 in a nested case-control study to 4,162,640 in a Korean study, and the number of cases ranged from 35 to 18,160. Four studies reported on aortic aneurysm overall and fifteen studies reported on abdominal aortic aneurysm, and only two reported on thoracic aortic aneurysm.
Study quality assessmentThe results of the NOS study quality assessment process are presented in Supplementary Table 16. Study scores were excellent, ranging from 5.25 to 8 across publications, with an average score of 6.88 and a median score of 7 out of a maximum of 8, suggesting the studies were of generally good quality.
Meta-analysisTotal cholesterolA total of 15 prospective studies (14 published studies [3, 8, 18,19,20,21,22,23,24,25, 27, 43,44,45] and UK Biobank) with 5,219 cases and 635,267 participants were included in the meta-analysis of total cholesterol and the risk of aortic aneurysm. In the linear dose-response analysis, the summary RR per 1 mmol/L increment in total cholesterol was 1.16 (95% CI 1.10–1.22, I2 = 74%, pheterogeneity<0.001) (Fig. 2a). The summary RR ranged from 1.14 (1.08–1.19) when excluding the study by Reed et al. [8], to 1.18 (1.11–1.26) when excluding the study by Tang et al. [3] (Supplementary Fig. 1). There was indication of publication bias with Egger’s test (p = 0.003), and with Begg’s test (p = 0.09) (Supplementary Fig. 2). When using the trim and fill method, seven studies were added to the plot and the summary RR became 1.07 (1.01–1.13). Seven studies (six published studies [3, 19,20,21, 44, 45] and UK Biobank) were included in the high vs. low analysis (4,163 cases, 578,103 participants), the summary RR was 1.75, 1.33–2.30, I2 = 67%, n = 7) (Supplementary Fig. 3). There was no indication of nonlinearity in the nonlinear dose-response analysis and there was a positive dose-response relationship (pnonlinearity=0.18; Fig. 2b).
Fig. 2
Linear and nonlinear dose-response meta-analysis of total, LDL and non-HDL cholesterol and aortic aneurysm
LDL cholesterolA total of four studies (three published studies [3, 27, 46] and UK Biobank) with 3,277 cases and 457,494 participants were included in the analysis of LDL cholesterol and aortic aneurysm. The summary RR per 1 mmol/L increase in LDL cholesterol was 1.11 (1.04–1.19, I2 = 63%) (Fig. 2c). Three studies (two published studies [3, 46] and UK Biobank) were included in the high vs. low analysis (3,242 cases, 457,319 participants) and the summary RR was 1.43 (1.27–1.60, I2 = 0%) (Supplementary Fig. 4). The test for nonlinearity was not significant (pnonlinearity=0.09) and there was evidence of a positive dose-response relationship between increasing LDL cholesterol and aortic aneurysm risk (Fig. 2d).
Apolipoprotein BThree studies (two published studies [44, 47] and UK Biobank) were included in a high vs. low analysis of apolipoprotein B and aortic aneurysm (2,636 cases, 460,202 participants). The summary RR was 1.72 (1.24–2.38, I2 = 60%) (Supplementary Fig. 5).
Non-HDL cholesterolTwo studies (one published study [26] and UK Biobank) were included in the meta-analysis of non-HDL cholesterol and aortic aneurysm (2,624 cases, 525,333 participants) and the summary RR per 1 mmol/L was 1.28 (0.98–1.67, I2 = 89%) (Fig. 2e) and for high vs. low levels was 1.70 (1.20–2.40, I2 = 60%) (Supplementary Fig. 6). There was a positive dose-response relationship and no evidence for a nonlinear association (pnonlinearity=0.28) (Fig. 2f).
HDL cholesterolFive studies (four published studies [3, 19, 21, 26] and UK Biobank) with 3,387 cases among 528,513 participants were included in the meta-analysis of HDL cholesterol levels and the risk of aortic aneurysm. In the linear dose-response analysis, the summary RR per 1 mmol/L increment in HDL cholesterol was 0.59 (0.50–0.70, I2 = 72%, pheterogeneity<0.001) (Fig. 3a). The summary RR ranged from 0.56 (0.46–0.69) when excluding the study by Tang et al. [3] to 0.63 (0.54–0.73) when excluding the study by Tornwall et al. [21] (Supplementary Fig. 7). Six studies (five published studies [3, 19, 21, 26, 49] and UK Biobank) were included in the high vs. low analysis (21,547 cases, 4,691,153 participants) and the summary RR was 0.47 (0.36–0.61, I2 = 86%) (Supplementary Fig. 8). There was strong evidence of nonlinearity (pnonlinearity<0.001) with a steeper reduction in risk at lower HDL cholesterol levels than at higher levels (Fig. 3b).
Fig. 3
Linear and nonlinear dose-response meta-analysis of HDL cholesterol, triglycerides and lipoprotein(a) and aortic aneurysm
Apolipoprotein A1Two studies (one published [44] and UK Biobank) were included in the dose-response analysis of apolipoprotein A1 and aortic aneurysm (2,252 cases, 391,273 participants and the summary RR was 0.59 (0.26–1.35, I2 = 98%) (Supplementary Fig. 9). Three studies (two published studies [44, 47] and UK Biobank) were included in a high vs. low analysis of apolipoprotein A1 and aortic aneurysm (2,424 cases, 421,685 participants). The summary RR was 0.52 (0.40–0.68, I2 = 45%) (Supplementary Fig. 10).
TriglyceridesSeven studies (six published studies [3, 8, 18, 20, 26, 27] and UK Biobank) with 3,720 cases and 542,063 participants were included in the analysis of triglycerides and aortic aneurysm. The summary RR per 1 mmol/L increase in triglycerides was 1.02 (0.95–1.10, I2 = 55%, pheterogeneity=0.06) (Fig. 3c). The summary RR ranged from 1.01 (0.94–1.09) when excluding the study by Reed et al. [8], to 1.04 (0.97–1.12) when excluding the study by Koba et al. [26] (Supplementary Fig. 11). There was no indication of publication bias with Egger’s test (p = 0.87) or Begg’s test (p = 0.55) (Supplementary Fig. 12). Six studies (five published [3, 20, 26, 44, 49] and UK Biobank) were included in a high vs. low analysis of triglycerides and aortic aneurysm (21,598 cases, 4,696,774 participants) and the summary RR was 1.16 (0.93–1.45, I2 = 81%) (Supplementary Fig. 13). The test for nonlinearity was not statistically significant (pnonlinearity=0.42), and there was no clear association between triglycerides and aortic aneurysm across the observed range of triglyceride concentrations (Fig. 3d).
Lipoprotein(a)Four studies (three published studies [5, 28, 50] and UK Biobank) with 3,502 cases and 435,573 participants were included in the analysis of lipoprotein(a) and abdominal aortic aneurysm. The summary RR per 50 mg/dl increase in lipoprotein A was 1.34 (1.17–1.55, I2 = 57%, pheterogeneity=0.07) (Fig. 3e). Five studies (four published studies [5, 28, 44, 50] and UK Biobank) were included in the high vs. low analysis (3,532 cases, 435,753 participants) and the summary RR was 1.40 (1.25–1.57, I2 = 0%) (Supplementary Fig. 14). The test for nonlinearity was significant (pnonlinearity=0.01) and the steepest increase in risk was observed at the low end of the curve and there was a positive dose-response relationship between increasing levels of lipoprotein(a) and aortic aneurysm risk (Fig. 3f).
Comments (0)