Bioactivity studyChemicals
Acetic acid (AA) was purchased from CID Pharmaceutical Co. in Giza, Egypt. All other chemical employed in the study met the strict criteria of being analytical grade and possessing the utmost purity.
Experimental animals
Male Wistar rats weighing 150 to 170 g were obtained from the National Research Centre’s Animal Facility in Egypt. The rats were kept in standard conditions with free access to both food and water. All procedures were conducted with the formal approval of the National Research Centre’s Ethical Committee for Medical Research (Approval No.: MREC-13060133).
Induction of colitis
To prepare for colitis induction, the Wistar rats were fasted for one day but still had unlimited access to water. The rats were then anaesthetized using 100/mg/kg of Ketamine administered intraperitoneally (i.p.). Colitis was then induced by intrarectally administering 2 mL of 4% v/v acetic acid (AA) solution (in saline) via a polyurethane tube inserted 4.5 cm into the colon. To prevent the solution from leaking out, the rats were held in the Trendelenburg position during the instillation and for 1 min afterward (Bezerra et al. 2017).
Experimental design
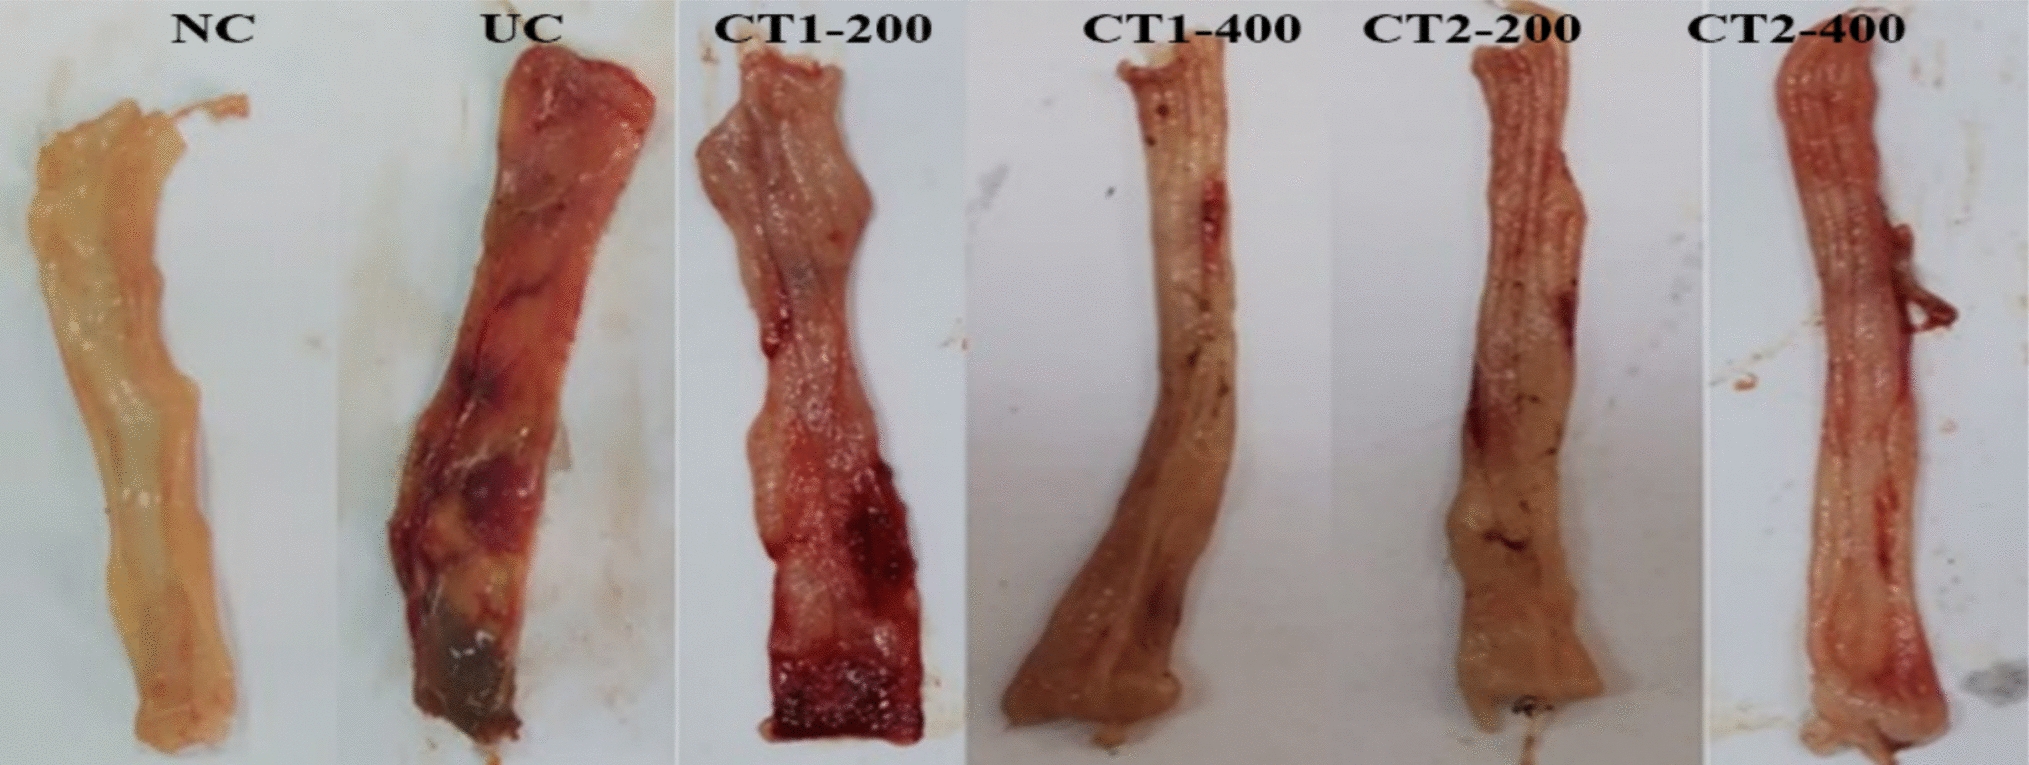
Forty-eight rats were divided randomly into 6 groups of 8 rats each. Group I (Control rats): received only the vehicle (distilled water, DW) orally for eight days and a rectal infusion of saline on 8th day. Group II (AA group): received 2 mL AA (4% v/v in saline) rectally at the 8th day. Group III and IV (CT1-200 and CT1-400 group + Control): received CT1 (200 and 400 mg/kg/day) once daily for 7 days by oral gavage and 2 mL AA (4% v/v in saline) on the 8th day. Group V and VI (CT2-200 and CT2-400 group + Control): received CT2 (200 and 400 mg/kg/day) once daily for 7 days by oral gavage and 2 mL AA (4% v/v in saline) on the 8th day.
Sample preparation
Forty-eight hours after inducing colitis with acetic acid, the rats were anaesthetized using thiopental sodium (40 mg/kg, ip). The colonic segments were then immediately removed, trimmed of fat, and rinsed in cold saline. These cleaned segments were then processed for the following three distinct analyses: macroscopic scoring, biochemical testing and histological examination. Macroscopic scoring was performed on colonic sections. Other sections were used to prepare colon homogenates, which were frozen at -80 °C for later biochemical testing. A third portion was preserved in 10% neutral buffered formalin for subsequent histological examination (microscopic analysis).
Colonic wet weight assay
The extent of edema (swelling) and the overall severity of colitis were determined by first weighing the distal 8 cm section of the rat colon (Zhou et al. 2001). Following this, wet weight-to-length ratio (g/cm) of the colon specimens were calculated to get a standardized measure of inflammation (Abdel-Rahman et al. 2015).
Macroscopic colonic damage scoring
To visually assess the extent of mucosal damage, the colon tissues were cut open lengthwise. The severity of the lesions observed on the inner surface of the colon (macroscopic) was then graded using a 0 to 4 scale (Table 1) (Millar et al. 1996).
Table 1 Macroscopic Scoring of Colon SectionsMeasurement of serum CRP and CALP
The concentrations of C-reactive protein (CRP) and CALP (Calprotectin) in the serum were measured using commercially available ELISA kits. The CRP kit was sourced from BT-LAB (Cat. No. E0053Ra, BT-LAB, Shanghai, China), and the CALP kit was from Elabscience® (Cat. No. E-EL-R2389, Elabscience®, Wuhan, China), with all assays strictly adhering to the manufacturers’ instructions.
Measurement of colon TNF-α, IL-6 and IL-10
The study quantified the colon concentrations of tumor necrosis factor-alpha (TNF-α), interleukin-6 (IL-6), and interleukin-10 (IL-10) were assessed biochemically using rat-specific ELISA kits (BioLegend, Cat. No. 438204, San Diego, USA), (CLOUD-CLONE CORP., Cat. No. SEA079Ra, Katy, TX 77494, USA), and (BT-LAB, Cat. No. E0108Ra, Shanghai, China), respectively.
Assessment of colon oxidative stress markers
The study measured the activity of reduced glutathione (GSH), malondialdehyde (MDA) level, and superoxide dismutase (SOD) activity in the colon tissue using an ELISA kit from BioVision, Milpitas, USA (Cat # K464-100, Cat # K739-100, and Cat #K335-100), respectively.
Histopathology examination
The harvested colon tissues of two rats per group were fixed in 10% neutral buffered formalin for 24 h, washed with tap water, dehydrated, cleared in xylene, routinely prepared to obtain 5–6 micron-thick paraffin-embedded sections and stained with H&E stain for light microscopy.
For histological study, colon tissues from two rats per group were first fixed in 10% neutral buffered formalin for 24 h. They were then thoroughly washed, dehydrated, and cleared in xylene. Next, the samples were embedded in paraffin and cut into very thin (5 to 6 micron thick) sections. Finally, these sections were stained with H&E (Hematoxylin and Eosin) for visual analysis.
Quantitative real-time PCR analysis
The gene expression levels of SIRT1 and PPAR-γ (with GAPDH mRNA serving as the reference gene) expression were quantified using quantitative Reverse Transcriptase-Polymerase Chain Reaction. First, RNA was extracted from the colon tissue using a kit from Macherey–Nagel GmbH & Co. (KG- Germany.) and then checked for purity (A260/A280 ratio) and concentration via spectrophotometry (dual wave length Beckman, Spectrophotometer, USA). The prepared RNA samples were stored at –80 °C. The qRT-PCR itself was performed using primers supplied from Bioline, a median life science company, UK (SensiFAST™ SYBR® Hi-ROX One-Step Kit, catalog no.PI-50217 V), and the resulting gene expression data was calculated and expressed using the 2 − ΔΔCT method. Primer sequence for the studied target genes (PPARγ&Sirt-1) and reference housekeeping gene (GAPDH) were shown in Table 2.
Table 2 Primer’s Sequence of All Studied GenesStatistical analysis
All experimental outcomes are presented as means ± standard error (SE). The tissue analyses specifically involved six samples per group. For comparing multiple groups, one-way analysis of variance one-way analysis of variance (ANOVA) were utilized, followed by the Tukey test at p ≤ 0.05. The lesion scores were analysed separately using the non-parametric Kruskal–Wallis test, followed by the Mann–Whitney test. All data processing and graphical generation were performed using GraphPad prism® software (version 6.00 for Windows, San Diego, CA, USA).
Phytochemical studyGeneral
Nuclear Magnetic Resonance (NMR) spectra (500 MHz for 1H and 125 MHz for 13C) were collected using a JEOL Spectrometer and processed with Delta NMR Software. For compound isolation, column chromatography utilized Diaion® HP-20 (Sigma-Aldrich Chemie GmbH, Germany), Silica gel G (E. Merck, Darmstadt, Germany) 60 mesh, and Sephadex LH-20 (E Merck) as stationary phases. Thin-layer chromatography (TLC) was performed with Silica gel aluminium sheets G 60 (F254-Merck) and spots were located using a UV lamp. All solvents used for extraction and chromatography were analytical grade (from El-Gomhouria, Egypt, and Sigma-Aldrich, St. Louis, MO, USA), while HPLC-grade acetonitrile and formic acid were also obtained from Sigma-Aldrich. Highly pure water was prepared using a Milli-Q system (Millipore, USA).
Plant material
Crassula tetragona L. (Family: Crassulaceae) unflowering aerial parts were collected in spring 2023 from Helal Cactus farm, Al Mansoureyah, Imbaba, Giza Governorate, Egypt. The plant was officially identified and authenticated by scientist Treiz Labib at the Orman Garden herbarium in Cairo, Egypt. A voucher specimen (M 192) has been permanently stored in the National Research Centre Herbarium. For experimental use, the collected plant material was then air-dried, ground into powder, and stored in a dry container.
Extraction
Five hundred grams of the unflowering aerial parts of C. tetragona L. unflowering aerial parts were subjected to a two-step extraction process. First, the plant material was soaked four times overnight in n-hexane until fully exhausted. The resulting n-hexane extract (CT1) was then evaporated under vacuum, yielding 9 g of crude extract. Next, the remaining plant material was air-dried for three days. This dried material was then soaked four times in 70% aqueous methanol until exhausted. The resulting combined methanolic extract (CT2) was also evaporated under vacuum, yielding a much larger quantity of crude extract, 65 g.
Untargeted high-performance liquid chromatography coupled with electrospray ionization mass spectrometry (HPLC–ESI–MS/MS) analysis
A one-milligram sample was initially dissolved in 1 mL of 100% MeOH. To prepare it for analysis, the solution was sonicated for two minutes, then centrifuged at 13,000 rpm for three minutes) to effectively remove all insoluble particles. The clean supernatant was then collected for the next steps. The separation and detection were performed using a sophisticated LC–MS/MS system (ExionLC AC coupled with a SCIEX Triple Quad 5500 +), employing chromatographic separation followed by mass spectrometry detection in the negative electrospray ionization ESI mode. The separation utilized an Ascentis® Express 90 Å C18 (2.1 × 150 mm, 2.7 µm), with a mobile phase consisting of A: 5 mM ammonium formate (pH 8); B: acetonitrile (LC grade). A gradient program was run over 30 min at a flow rate of 0.3 mL/min, with a 5 µL injection volume. Gradient: 5% B (0–1 min), 5–100% B (1–20 min), 100% B (20–25 min), 5% B (25.01–30 min). Key Mass Spectrometry parameters included a source temperature of 500 °C, an ion spray voltage of -4500 V, and a declustering potential of -80 V. Data was acquired using the EMS-IDA-EPI scan mode and subsequently processed using PeakView ® software (AB Sciex).
Quantitative determination of phenolics using LC–ESI–MS/MS multiple reactions monitoring mode (MRM)
Standard (1 mg/mL) solutions of the phenolic standards were prepared and diluted to 10 μg/mL for storage, with a 200-ppb mixture used for calibration. Plant extract (3–5 mg) was dissolved in 80% methanol, sonicated, and filtered before analysis. The samples were then analysed by LC–MS/MS using an ExionLC coupled to a SCIEX Triple Quadruple 5500 + . Chromatographic separation employed a ZORBAX Eclipse Plus C18 (4.6 × 100 mm, 1.8 μm) column, a formic acid in water (A)/acetonitrile (B) mobile phase gradient (0.8 mL/min), and 3 μL injection. Gradient elution:0–1 min: 2% B, 1–21 min: 2–60% B, 21–25 min: 60% B, 25.01–28 min: 100% B. Detection utilized Electrospray Ionization (ESI) in both positive and negative modes.
Isolation
Fifty-five grams of the CT2 extract were separated using a Diaion HP-20 column (1 kg) column chromatography (CC). The fractions were eluted using a gradient solvent system that progressed from pure water H2O to pure methanol MeOH. The collected fractions were monitored for content using both silica gel and cellulose plates via TLC. For the silica TLC plates, the following solvent systems CH2Cl2-MeOH (8:2) and EtOAc–MeOH (98:2) were used. BAW ( n -butanol: Acetic acid: H2O; 4:1:5; upper phase) and 15% Acetic acid were used to develop cellulose TLC plates. The silica plates were visualized by a two-step process: UV light inspection, followed by spraying with vanillin-H2SO4 reagent and subsequent heating to 100 °C. The cellulose plates were examined under UV lamb first and then exposed to ammonia vapours and re-visualized under UV lamb. Identical fractions were pooled to give 4 main fractions. Fractions A (15 g) and C (9 g) resulted from the main column with H2O-MeOH (75:25) and (25:75), respectively, were selected for further isolation. Using silica gel CC (300 g) and solvent system CH2Cl2-MeOH (1:0–0:1)., fraction A yielded 40 subfractions (50 mL). According to the visualization of cellulose TLC plates, the subfractions were grouped into 6 similar subfractions. Subfraction 2A, eluted with a 9:1 mixture of CH2Cl2 and MeOH, was separated by preparative paper chromatography on Whatman No. 3 MM cellulose sheets using 15% acetic acid in water as the mobile phase. The preparative paper chromatography of subfraction 2A yielded 5 bands. Band 2 was cut into pieces and extracted using 70% aqueous methanol three times. Band 2 yielded compound 42 (12 mg) using Sephadex LH-20 CC and EtOH-H2O (5:5) as eluent. Band 5 was cut into pieces and extracted using 70% aqueous methanol three times. Band 5 yielded compounds 41 (12 mg) and 44 (15 mg) using Sephadex LH-20 CC and EtOH-H2O (5:5) as eluent. Fraction C was applied on silica gel CC (300 g) and eluted with solvent system CH2Cl2-MeOH (1:0–0:1), yielding 30 subfractions (50 mL). After visualization of cellulose TLC plates, the subfractions were grouped into 12 identical subfractions. Subfraction 4C eluted with an 8:2 mixture of CH2Cl2 and MeOH, were applied to Sephadex LH-20 CC using MeOH-H2O (1:0–0:1) for elution. The fractions eluted at 20% MeOH in H2O were further refined using Sephadex LH-20 and EtOH-H2O (2:8) to yeild compound 46 (13 mg). While the fractions eluted at 15% MeOH in H2O were further refined using Sephadex LH-20 and EtOH-H2O (2:8) to afford compound 38 (15 mg).
Quercetin 3,7-dimethyl ether (3',4',5-trihydroxy-3,7-dimethoxyflavone) 42.
Yellow needles; C17H14O7; ESI–MS m/z [M-H]−; 1H-NMR (500 MHz, acetone-d6) δ: 12.73 (1H, s, 5-OH), 8.03 (1H, d, J = 2.1, H-2`), 7.13 (1H, dd, J = 7.7, 2.1, H-6`), 7.00 (1H, d, J = 7.7, H-5`), 6.84 (1H, d, J = 2.2, H-8), 6.24 (1H, d, J = 2.2, H-6), 3.79 (3H, s, 7-OMe), 3.69 (3H, s, 3-OMe). 13C-NMR (125 MHz, acetone-d6) δ: 183.4 (C-4), 165.8 (C-7), 161.1 (C-5), 156.9 (C-9), 156.2 (C-2), 148.3 (C-4`), 144.8 (C-3`), 137.6 (C-3), 122.1 (C-1`), 121.3 (C-6`), 115.8 (C-2`), 114.6 (C-5`), 97.9 (C-6), 91.7 (C-8), 59.3 (3-OMe), 55.5 (7-OMe) (Nantapap et al. 2017).
(2S)-Eriodictyol (3',4',5,7-tetrahydroxyflavanone) 41.
Colourless needles; C15H12O6; ESI–MS m/z 287 [M-H]−; 1H-NMR (500 MHz, acetone-d6) δ: 2.71 (1H, dd, J = 12.1, 3.1 Hz, H-3cis), 3.14 (1H, dd, J = 16.9, 12.4 Hz, H-3trans), 5.38 (1H, dd, J = 12.7, 3.1 Hz, H-2), 5.92 (1H, d, J = 2.0 Hz, H-6), 5.93 (1H, d, J = 2.0 Hz, H-8), 6.84 (2H, d, J = 1.5 Hz, H-5`, H-6`), 7.00 (1H, d, J = 1.5 Hz, H-2`), 12.14 (1H, s, HO-5); 13C-NMR (125 MHz, acetone-d6) δ: 42.8 (C-3), 79.2 (C-2), 95.1 (C-8), 96.0 (C-6), 102.3 (C-10), 113.9 (C-2`), 115.2 (C-5`), 118.3 (C-6`), 130.6 (C-1`), 145.3 (C-3`), 145.7 (C-4`), 164.2 (C-5), 164.5 (C-9), 166.7 (C-7), 196.4 (C-4) (Buranasudja et al. 2022).
Padmatin (Taxifolin 7-methyl ether) 44.
Colourless needles; C15H12O6; ESI–MS m/z 317 [M-H]−; 1H-NMR (500 MHz, acetone-d6) δ: 3.86 (1H, s, 7-OMe), 5.00 (1H, d, J = 12.7, H-3), 5.38 (1H, d, J = 12.7, H-2), 5.92 (1H, d, J = 2.0 Hz, H-6), 5.93 (1H, d, J = 2.0 Hz, H-8), 6.84 (2H, d, J = 1.5 Hz, H-5′, H-6′), 7.00 (1H, d, J = 1.5 Hz, H-2′), 12.14 (1H, s, HO-5); 13C-NMR (125 MHz, acetone-d6) δ: 55.6 (7-OMe), 74.9 (C-3), 82.4 (C-2), 93.2 (C-8), 94.8 (C-6), 100.0 (C-10), 112.9 (C-2`), 117.7 (C-5), 127.6 (C-1`), 151.3 (C-4`), 155.4 (C-3`), 164.9 (C-9), 165.2 (C-5), 168.4 (C-7), 194.8 (C-4) (Minh et al. 2022).
3,5,7,4`,3``,5``,7``-Heptahydroxy-3`-O-4```-biflavanone 46.
Yellowish amorphous solid; C30H22O12; ESI–MS m/z 573 [M-H]−; 1H-NMR (500 MHz, acetone-d6) δ: 4.62 (1H, d, J = 11.5 Hz, H-3``), 4.69 (1H, d, J = 11.5 Hz, H-3), 5.05 (1H, d, J = 11.5 Hz, H-2``), 5.14 (1H, d, J = 11.5 Hz, H-2), 6.01 (4H, d, J = 2.4 Hz, H-6, H-8, H6``, H-8``), 6.87 (2H, d, J = 8.4 Hz, H-3```, H-5```), 7.50 (1H, d, J = 6.5 Hz, H-5`), 7.66 (1H, dd, J = 8.5, 2.1 Hz, H-6`), 7.79 (1H, d, J = 2.2 Hz, H-2`), 8.12 (2H, d, J = 8.6 Hz, H2```, H-6```), 11.95 (2H, br s, OH-3,OH-3``), 12.14 (2H, s, OH-7), 13.05 (1H, s, OH-5); 13C-NMR (125 MHz, acetone-d6) δ: 72.3 (C-3, C-3`), 83.7 (C-2, C-2``), 95.2 (C-8, C-8``), 98.8 (C-6, C-6``), 100.6 (C-10, C-10`), 114.9 (C-3```, C-5```), 115.1 (C-5`), 120.6 (C-2`), 124.3 (C-6), 128.3 (C-2```, C-6```), 129.5 (C1`), 130.0 (C-2```, C-6```), 150.6 (C-4```), 159.4 (C-4`), 164.2 (C-9, C-9``), 165.0 (C-5, C-5``), 166.7 (C-7, C-7``), 197.6 (C-4, C-4``) (Sievers et al. 1992; Pegnyemb et al. 2005).
6```-hydroxylophirone B ([(2S,3R)-naringenin-(3β,3)-4,2`,4`-trihydroxychalcone] 38.
Yellow needles; C30H22O9; ESI–MS m/z 525 [M-H]−; 1H-NMR (500 MHz, acetone-d6) δ: 4.70 (1H, d, J = 12.0 Hz, H-α), 5.94 (1H, d, J = 12.0 Hz, H-β), 6.28 (1H, s, H-3`), 6.49 (1H, d, J = 8.7 Hz, H-5`), 6.87 (2H, d, J = 8.7 Hz, H-3``, H-5``), 6.96 (1H, d, J = 8.0 Hz, H-5), 7.27 (2H, d, J = 8.6 Hz, H-2``,H-6``), 7.52 (1H, br s, H-2), 8.07 (1H, d, J = 8.9 Hz, H-6`), 12.26 (1H, s, HO-6``), 13.03 (1H, s, OH-2`); 13C-NMR (125 MHz, acetone-d6) δ: 54.1(C-α`), 82.3 (C-β`), 95.0 (C-3```), 96.2 (C-5```), 102.1 (C1```), 105.1 (C-3`), 108.4 (C-5`), 114.8 (C-1`), 115.1 (C-3``, C-5``), 115.8 (C-5), 118.2 (C-α), 122.4 (C-3), 128.8 (C-1), 129.1 (C-1``), 129.7 (C-2``, C-6``, C-6), 131.2 (C-6`), 132.7 (C-2), 146.4 (C-β), 157.8 (C-4``), 159.4 (C-4), 164.4 (C-4`), 164.8 (C-6```), 166.4 (C-4``), 167.2 (C-2`), 191.9 (CO–c), 197.1 (CO–c) (Kaewamatawong et al. 2002).

Comments (0)