
Remember me
In total, eighteen metabolites were predicted using the web-based tool GLORYx. Of these, nine were first-generation metabolites (gidazepam, pM1 – pM6 and desalkylgidazepam, pM1 – pM3), and the remainder were second-generation metabolites (pMX-1 – pMX-n), each pMX corresponding to a first-generation metabolite and n ≤ 4. The probability threshold for these predictions was set at 20%. The main metabolic pathway predicted involved bromo-phenyl hydroxylation, followed by phase II conjugation reactions such as glucuronidation, sulfation, or methylation. Other predicted metabolites resulted from N-oxidation of the 1,4 diazepine, pyrrolidine ring oxidation, and hydroxylation of the pyrrolidine ring, and subsequent O-sulfation. N-Dealkylation at the diazepine ring, and a combination of N-dealkylation and carboxylation at the bromo-phenyl moiety were also forecasted. The structures, proposed biotransformations, and SMILES notations for in silico predicted metabolites of gidazepam and desalkylgidazepam are presented in Tables S3 and S4, respectively.
HRMS/MS fragmentation of gidazepam and desalkylgidazepamGidazepam was identified in hepatocyte incubates and blood specimen with precursor ion at m/z 387.0454 ([M + H]+, C17H16BrN4O2+, 0.7 ppm), and retention time at 12.20 min. Fragmentation of the precursor ion produced a fragment ion (FI) at m/z 355.0078 (C17H12BrN2O2+, 0.4 ppm) resulting from a cleavage of the hydrazine group. This fragment may undergo further transformation through the sequential loss of two carbon monoxide molecules, forming FI at m/z 327.0127 (C16H12BrN2O+, − 0.2 ppm) and m/z 299.0178 (base peak, C15H12BrN2+, − 0.1 ppm), respectively. From m/z 299.0178, a further loss of hydrogen bromide could generate yet another fragment at m/z 219.0918 (C15H11N2+, 0.6 ppm). Alternatively, the FI at m/z 355.0078 could follow a different pathway involving N-desalkylation, possibly resulting in a minor fragment at m/z 315.0126 (C15H12BrN2O+, − 0.5 ppm) and downstream fragments at m/z 299.0178 and 219.0918.
Desalkylgidazepam was likewise detected in both hepatocyte incubates, and the blood sample analyzed by HRMS. The precursor ion was observed at m/z 315.0128 ([M + H]+, C15H12BrN2O+, 0.2 ppm). FI at m/z 287.0176 (C14H12BrN2+, − 0.8 ppm) might correspond to a loss of carbon monoxide. From this fragment, several subsequent fragmentation pathways are possible. Firstly, the loss of a bromine radical might lead to m/z 208.0995 (C14H12N2+●, 0.1 ppm). A further loss of a CH3N● group may then produce FI at m/z 180.0808 (C13H10N+, 0.1 ppm). Secondly, an alternative pathway might involve the direct loss of the phenyl ring, resulting in a fragment at m/z 208.9709 (C8H6BrN2+, 0.1 ppm). A subsequent loss of a bromine radical from this species could lead to FI at m/z 130.0526 (C8H6N2+, 0.4 ppm).
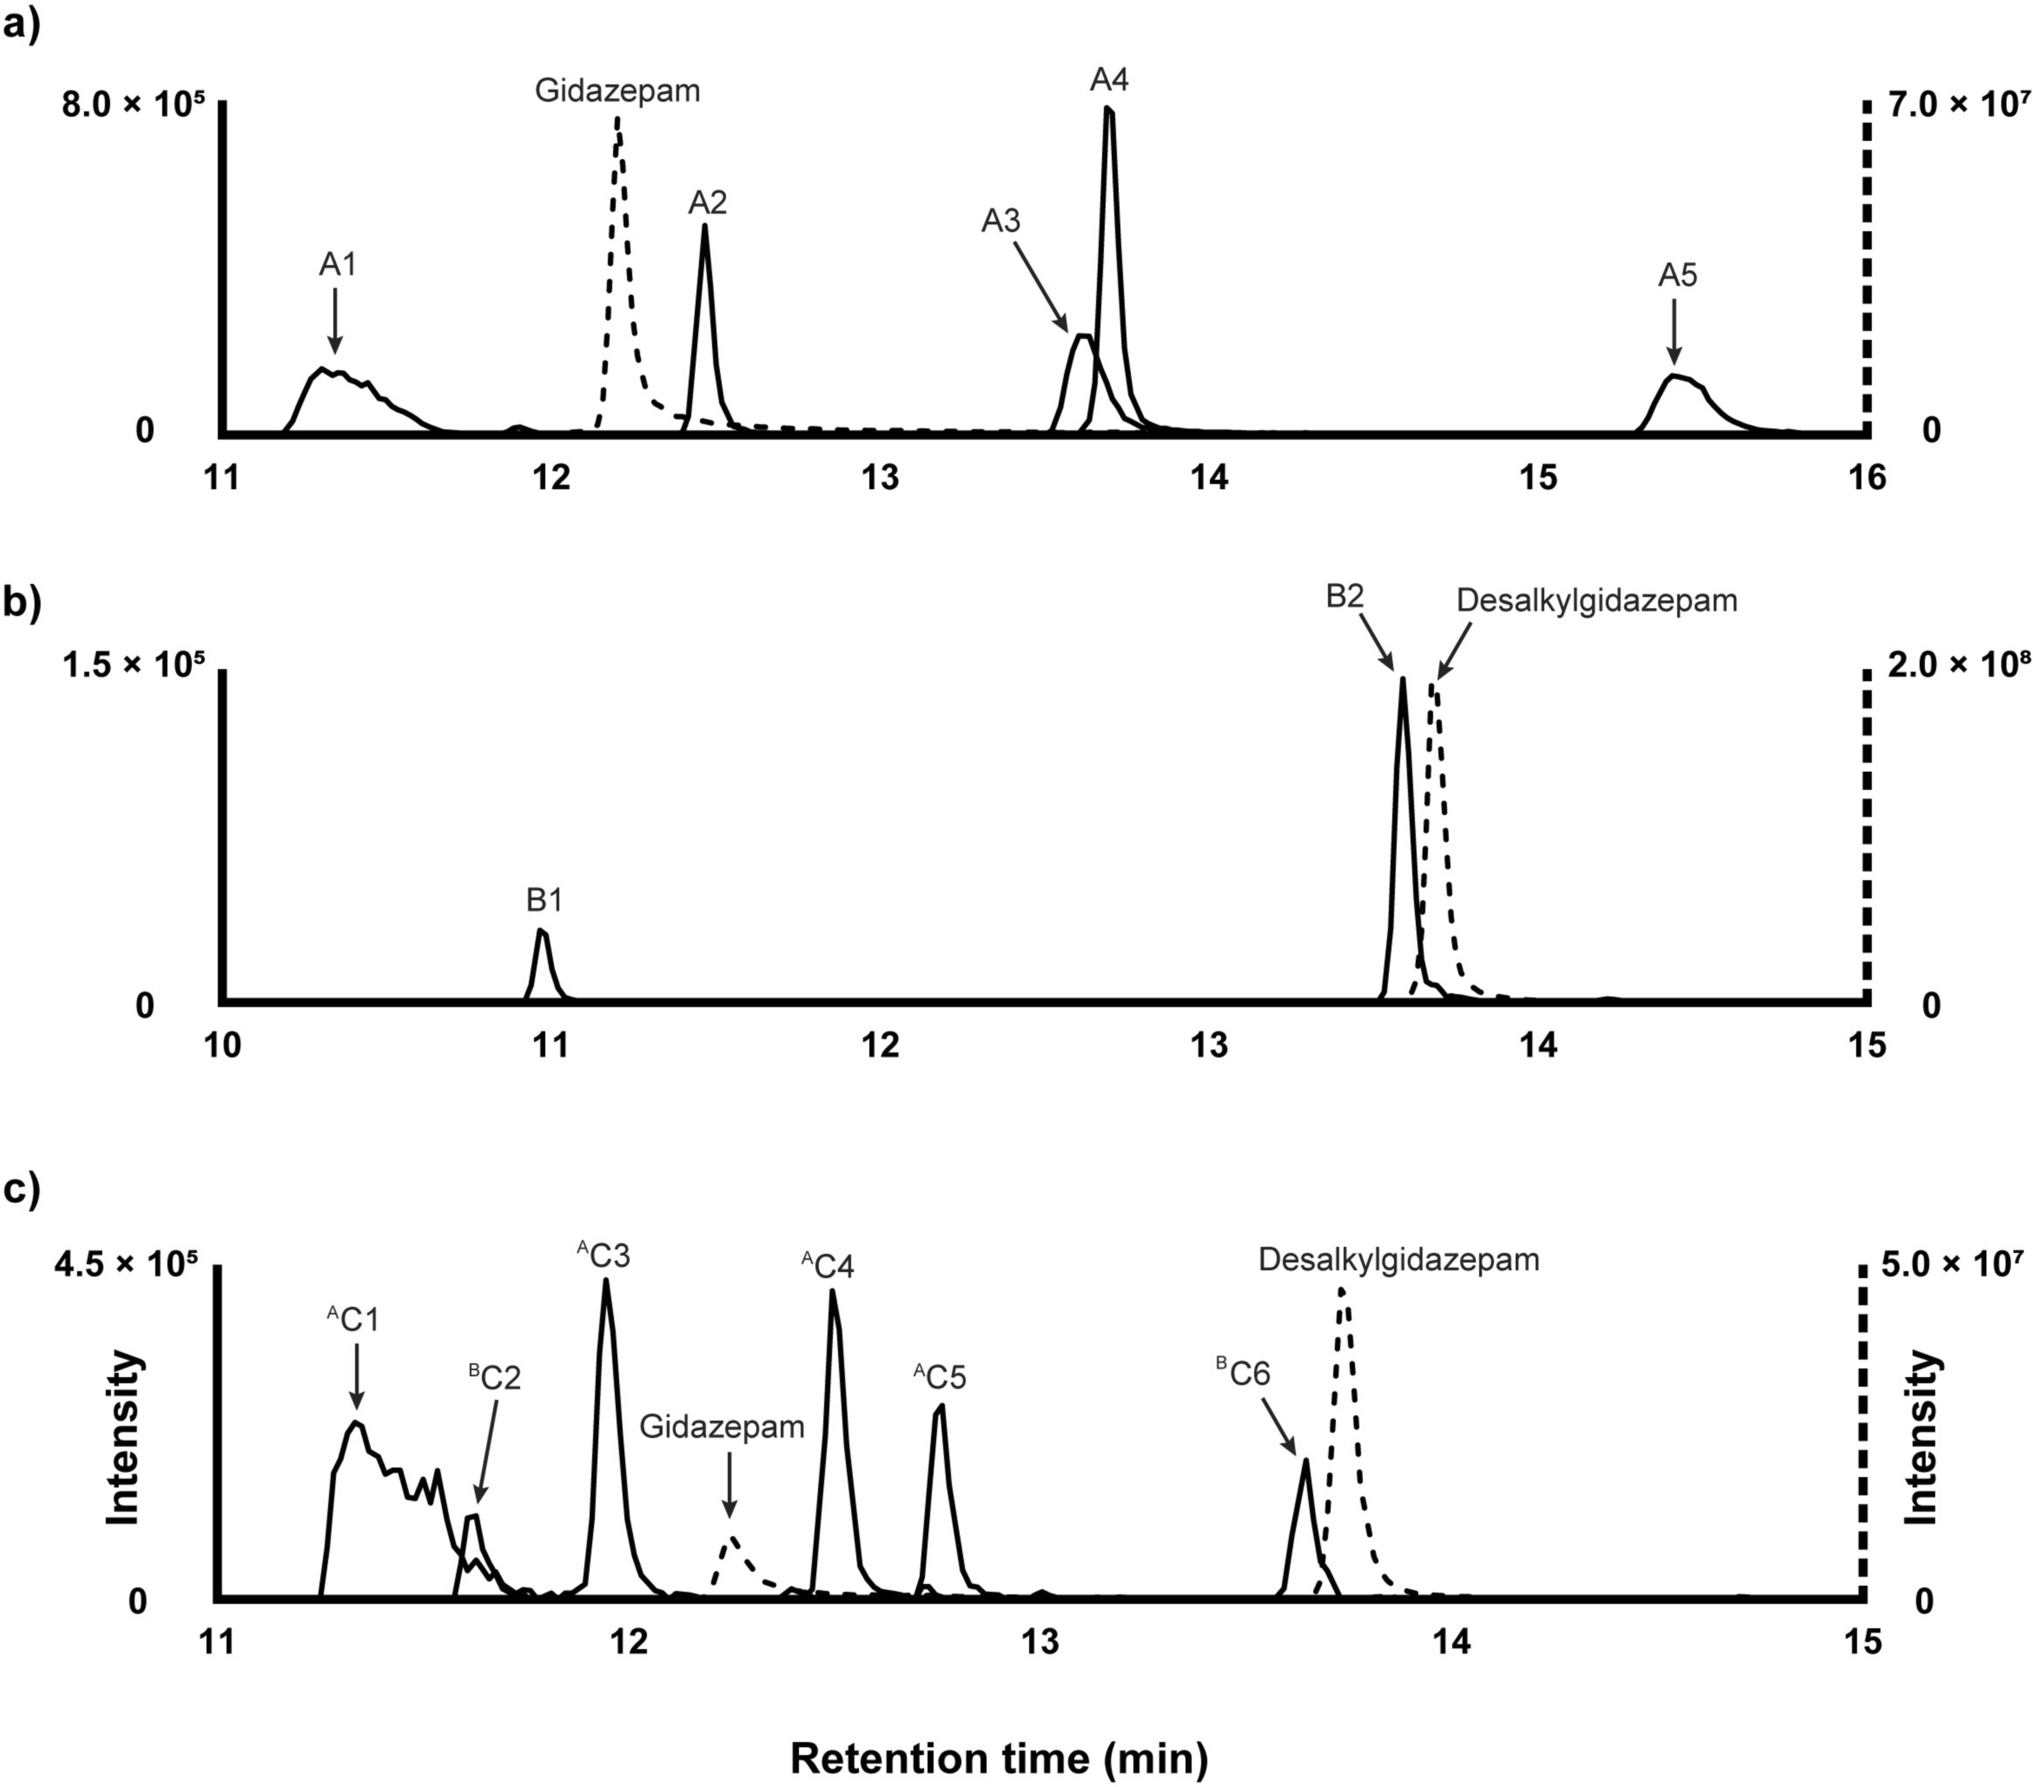
Gidazepam metabolites in human hepatocytesFigure 1a illustrates the chromatographic elution profiles of gidazepam and its metabolites identified after three hour incubation with human hepatocytes. The proposed biotransformations, chemical structures, chromatographic peak areas, and ∆ppm values for the identified metabolites are presented in Table 1.
Fig. 1
Extracted ion chromatographs of gidazepam (a) and desalkylgidazepam (b) and their metabolites in three hour human hepatocyte incubations and authentic human blood sample (c)
Table 1 Proposed metabolic biotransformations, and elucidated elemental compositions, retention times, accurate molecular masses, mass errors, and chromatographic peak areas of gidazepam, desalkylgidazepam, and their metabolites after three hour human hepatocyte incubations and analysis using high-resolution mass spectrometryThe earliest eluting metabolite, designated A1, was observed at 11.30 min with a precursor ion at m/z 563.0769, ([M + H]+, C23H24BrN2O8+, − 0.5 ppm), suggesting N-glucuronidation. The MS/MS spectrum had FI at m/z 387.0442 (C17H16BrN4O2+, − 2.4 ppm), which may correspond to the gidazepam core following the loss of the conjugate group (− 176.0327 u). Additional fragments of A1 resembled those of the parent compound. For instance, the potential loss of a hydrazine group could yield m/z 355.0059 (C17H12BrN2O2+, -5.0 ppm), while two consecutive carbon monoxide losses could produce fragments m/z 327.0128 (C16H12BrN2O+, 0.1 ppm) and m/z 299.0170 (C15H12BrN2+, − 2.8 ppm).
A2 eluted immediately after gidazepam at 12.47 min. The precursor ion at m/z 429.0555 ([M + H]+, C19H18BrN4O3+, − 0.4 ppm) indicates N-acetylation reaction. Acetyl group cleavage likely yields FI at m/z 387.0441 (C17H16BrN4O2+, − 2.6 ppm), consistent with protonated gidazepam. Moreover, the MS/MS spectrum of A2 closely mimicked that of the parent compound, with both displaying a base peak at m/z 299.0171 (C15H12BrN2+, -2.5 ppm), indicating analogous fragmentation pattern.
The next eluting metabolite, A3 likely had two acetyl groups and one carboxyl modifications, based on the precursor ion at m/z 515.0566 ([M + H]+, C22H20BrN4O6+, 1.0 ppm), and was detected at 13.60 min. A subsequent loss of carbon dioxide likely generates a fragment at m/z 471.0642 ([M + H]+, C21H20BrN4O4+, − 4.3 ppm). Stepwise fragmentation of the conjugated acetylated hydrazine chain could produce FI at m/z 355.0082 (C17H12BrN2O2+, 1.5 ppm), after which the fragmentation pattern appears to follow that of gidazepam.
A4 was also detected at 13.69 min, with a product ion at m/z 315.0127 ([M + H]+, C15H12BrN2O+, − 0.2 ppm), showed a fragmentation pattern closely resembling that of desalkylgidazepam, as described previously.
Finally, A5 eluted at 15.41 min and the observed product ion at m/z 471.0664 ([M + H]+, C21H20BrN4O4+, 0.5 ppm) is consistent with a two-fold acetylation. A combined carbon dioxide could produce FI at m/z 427.0773 (C20H20BrN4O2+, 2.1 ppm), followed by the loss of the remaining hydrazine chain, resulting in m/z 355.0064 (C17H12BrN2O2+, − 3.6 ppm). From this fragment onward, the fragmentation pattern of A5 aligns with those identified for A2 and gidazepam. Key fragments include m/z 327.0119 (C16H12BrN2O+, − 2.6 ppm), m/z 299.0171 (also base peak, C15H12BrN2+, − 2.5 ppm), and m/z 219.0912 (C15H11N2+, − 2.1 ppm).
Desalkylgidazepam metabolites in human hepatocytesTable 1 details the proposed metabolic transformations, tentative chemical structures, chromatographic peak areas, and ∆ppm values for desalkylgidazepam and its metabolites. Figure 1b depicts the chromatogram of desalkylgidazepam and its metabolites after three hours of incubation with human hepatocytes.
B1, detected at 10.96 min, with precursor mass at m/z 507.0402 ([M + H]+, C21H20BrN2O8+, 0.9 ppm), had a mass shift of + 192.0274 u compared to desalkylgidazepam. This shift could be explained by O-glucuronidation following hydroxylation. The fragmentation spectrum indicates loss of the conjugate, resulting in a base peak at m/z 331.0064 (C15H12BrN2O2+, − 3.8 ppm). Tentative interpretation of the mass data suggests a further loss of carbon monoxide yields FI at m/z 303.0127, although this fragment was not observed. Starting from this hypothetical fragment, three potential pathways might occur: firstly, a loss of a bromine radical could yield m/z 224.0929 (C14H12N2O+, − 6.8 ppm); secondly, FI at m/z 224.9645 (C8H6BrN2O+●, − 5.8 ppm) may be attributed to a loss of the phenyl ring; and thirdly, a loss of benzonitrile could potentially result in a fragment at m/z 199.9701 (C7H7BrNO+, − 2.3 ppm). The absence of a water loss may suggest aromatic hydroxylation rather than hydroxylation at the 3-position of the diazepine ring.
B2 was detected at 13.66 min. The precursor ion at m/z 331.0077 ([M + H]+, C15H12BrN2O2+, 0.1 ppm) featured a mass shift of + 15.995 u relative to desalkylgidazepam, which corresponds to hydroxylation. The MS/MS spectrum indicates a potential water loss, resulting in FI at m/z 312.9966 (C15H10BrN2O+, − 1.6 ppm). A subsequent carbon monoxide loss appeared to yield the base peak at m/z 285.0017 (C14H10BrN2+, − 1.7 ppm), followed by a further bromine radical loss, producing m/z 205.0760 (C14H9N2+●, − 0.1 ppm). Alternatively, the fragment at m/z 275.0177 (C13H12BrN2+, − 0.5 ppm) might result from a direct loss of two carbon monoxide molecules, with a further hydrogen bromide loss leading to m/z 195.0918 (C13H11N2+, 0.6 ppm). A minor fragment at m/z 224.9653 (C8H6BrN2O+, − 2.2 ppm) may indicate a loss of the phenyl ring, whereas an additional water loss may account for FI at m/z 206.9548 (C8H4BrN2+, − 2.1 ppm). Taken together, the varying fragmentation pathways of metabolites B1 and B2 may reflect hydroxylation occurring at different sites, with B2 likely hydroxylated at position 3 of the diazepine ring.
Metabolites detected in bloodAltogether, six metabolites of gidazepam and desalkylgidazepam were identified in blood; their details are summarized in Table 2. Figure 1c shows the elution profiles of gidazepam, desalkylgidazepam, and their metabolites in blood following UHPLC-HRMS analysis. Three of these metabolites, namely C1 (A1), C4 (A2), and desalkylgidazepam (A4), found in blood were also detected after three hour in vitro incubation with human hepatocytes and gidazepam. Additionally, C6 (corresponding to B2) was observed in both blood and desalkylgidazepam incubations with hepatocytes.
Table 2 Gidazepam, desalkylgidazepam, and their metabolites: predicted chemical structures, retention times, accurate molecular masses, mass errors, and peak areas identified in a human biosample analyzed with UHPLC-HRMS/MSC2 shared the same product ion as B1 (m/z 507.0402), suggesting a similar biotransformation to that proposed for B1. C2’s MS/MS spectrum was similar to that of B2, showing intense FIs at m/z 312.9978, m/z 285.0017 (base peak), m/z 238.0734, m/z 205.0763, and m/z 104.0495, pointing towards O-glucuronidation following hydroxylation in position 3 of the diazepine ring.
The MS/MS spectrum of C3, identified at 11.94 min and m/z 563.0779, closely matched that of C1 (A1), corresponding to N-glucuronidation reaction. C3 also showed a base peak at m/z 299.0175, with additional fragments at m/z 355.064, m/z 327.0133, m/z 219.0915, and m/z 203.0735 all consistent with the fragmentation pattern of C1 and gidazepam.
Lastly, C5, identified at 12.76 min and with product ion at m/z 416.0606, loses the hydrazine group at FI m/z 355.0067 (C17H12BrN2O2+, − 2.7 ppm), and subsequent loss of carbon monoxide producing m/z 327.0114 (C16H12BrN2O+, − 4.1 ppm). The most intense fragment was observed at m/z 299.0170 (C15H12BrN2+, − 2.8 ppm), with other fragments detected at m/z 281.9913 (C15H9BrN+, 0.1 ppm), m/z 219.0911 (C15H11N2+, − 2.6 ppm), and m/z 203.0728 (C15H9N+, − 0.7 ppm).
GABAAR and TSPO 18 kDa pharmacodynamic modelling in silicoThe main site for benzodiazepine activity on GABAAR is the α1γ2 interface, albeit other sites were found for gidazepam and desalkylgidazepam. TSPO, however, had a univocal binding spot for these compounds. Figure 2 depicts the binding sites identified for all benzodiazepines investigated including diazepam and 4-chlorodiazepam on GABAAR (a) and TSPO (b). Results from the in silico modelling of gidazepam, desalkylgidazepam, (3R)- and (3S)-hydroxy desalkylgidazepam, diazepam, and 4-chlorodiazepam are summarized in Table 3.
Fig. 2
Overview of binding sites for benzodiazepines investigated on γ-amino butyric acid A receptor (GABAAR) (a) following focused docking approach, and the univocal binding site of 18 kDa translocator protein (b) reported in cyan ribbons. The α, β, and γ subunits of GABAAR are reported in green, blue, and yellow ribbons, respectively
Table 3 Predicted binding energies (kcal/mol), inhibition constants and Ki (nM) values calculated following “targeted” molecular docking on GABAAR and TSPO 18 kDa for gidazepam, desalkylgidazepam, and (3R)-/(3S)-hydroxy desalkylgidazepamMolecular docking and dynamics simulations on GABAARGidazepam formed a hydrogen bond, via its carbonyl group, with the amine group of Ala281 backbone at the α1γ2 site and its hydrazine moiety was oriented towards a non-polar amino acid region. Similarly, desalkylgidazepam and its 3-hydroxy metabolites also established a hydrogen bond between their carbonyl group and the amine group of Ala281. Additionally, the (3R)-hydroxy desalkylgidazepam metabolite, through its hydroxyl group, interacted with the side chain of Arg232 via hydrogen bonding. In contrast, the (3S)-hydroxy counterpart formed one and two hydrogen bonds with Trp196 and Met141, respectively. Figure 3 depicts the binding modes of gidazepam, desalkylgidazepam, (3R)- and (3S)-hydroxy desalkylgidazepam, diazepam, and 4-chlorodiazepam at the α1γ2 interface. Diazepam, notably, shows similar RMSD values as gidazepam, albeit reaching stabilization faster than this compound. On the other hand, 4-chlorodiazepam exhibited very noticeable oscillations and did not converge to predefined values, indicating a significantly lower binding affinity than other compounds investigated.
Fig. 3
Binding mode of gidazepam (a, b), desalkylgidazepam (c, d), (3R)- hydroxy desalkylgidazepam (e, f), (3S)-hydroxy desalkylgidazepam (g, h), diazepam (i, j), and 4-chlorodiazepam (k, l) on α1γ2 subunit of γ-amino butyric acid A receptor (GABAAR). The starting pose and the final pose after MD are reported in coral and dark green sticks, respectively, the residues of GABAAR interacting are underlined in light blue ribbons, and the H-bonds are depicted with blue lines. The volume of the α1γ2 binding site is highlighted in surface with a color scale ranging from navy blue for highly hydrophilic amino acid regions, to goldenrod for extremely non-polar amino acids. The surfaces of the compounds are reported with transparency. The RMSD profiles (i) of gidazepam (black), desalkylgidazepam (red), (3R)- hydroxy desalkylgidazepam (green), (3S)-hydroxy desalkylgidazepam (blue), diazepam (purple), and 4-chlorodiazepam (orange), in the binding sites at α1γ2 interface, are also depicted
Additional binding sites for gidazepam were identified at two α1β2 interfaces. In the pose at the α1β2 site (A/B chains), gidazepam was located internally within the calyx formed by the pentameric structure of the GABAAR, in proximity to the transmembrane domains (TMD). Here, gidazepam interacted via hydrogen bonds with Ser52, Val53, and Gln190. At the α1β2 site involving the C/D subunits, hydrogen bonds with Val53 and Asn189 were observed. The RMSD profiles for gidazepam at these two binding sites were 1.046 ± 0.027 Å (A/B chains) and 1.643 ± 0.022 Å (C/D chains) after 150 ns. Furthermore, an additional binding pose for desalkylgidazepam was identified at the β2γ2 interface, where it formed hydrogen bonds with Gln204 and the side chain of Ser205. Desalkylgidazepam, however, exhibited slow stabilization within its binding site, with an average RMSD of 2.312 ± 0.018 Å, reaching a steady state after 160 ns. For diazepam, molecular modelling revealed a pose at α1β1 site, having two H-bonds with Asn189 and Lys274, and another pose at β2γ2 interface, stabilized via H-bonding with Glu52. No additional binding sites were observed for either (3R)- or (3S)-hydroxy desalkylgidazepam. Figure 4 presents the other binding modes identified for gidazepam, desalkylgidazepam, and diazepam through molecular modelling.
Fig. 4
Depiction of gidazepam binding at α1β2 subunits illustrating interactions at the A/B interface (a) and C/D interface (b), desalkylgidazepam’s interaction at γ2β2, E/D interface (c) and diazepam’s binding mode at α1β2 (d) and γ2β2 (e) subunits corresponding to A/B and E/D chains, respectively. The starting and final poses after MD are reported in coral and dark green sticks, respectively, and the interacting residues of GABAAR are underlined in light blue ribbons and H-bonds are depicted with blue lines. RMSD plots (f) of gidazepam (purple and deep brown), desalkylgidazepam (light brown), and diazepam (orange and green) are reported
Molecular docking and dynamics simulations on TSPO 18 kDa receptorGidazepam, (3R)-, and (3S)-hydroxy desalkylgidazepam anchored to the TSPO binding site with the POPC system and maintained the binding pose throughout MD simulations. Desalkylgidazepam, however, was completely solvated after 60 ns. Gidazepam showed two H-bonds with the receptor complex, three H-bonds with water molecules, and a salt bridge between the hydrazine and the POPC’s phosphate group. For the (3R)-hydroxy metabolite, Arg43 directly interacted through π-alkyl interaction with the compound and an H-bond with oxygen from the phosphate of the POPC residue were observed. Six H-bonds with water molecules were observed, compared to the three found for gidazepam. The (3S)-hydroxy enantiomer, on the other hand, demonstrated a lower affinity for the TSPO-POPC membrane after the MD simulation, with fewer interacting amino acids. In this case, Lys36 through π-alkyl interaction, in place of Arg43, oriented towards the protein was found. Gidazepam, (3R)-, and (3S)-hydroxy desalkylgidazepam’s RMSD values on the TSPO with POPC membrane were 0.64 ± 0.031 Å, 0.66 + 0.008 Å, and 0.64 ± 0.008 Å, respectively.
Desalkylgidazepam again was unable to maintain the binding site with the TSPO-PVCL2 membrane and was completely solvated after 70 ns. Gidazepam generated five H-bonds with water molecules and two H-bonds with Trp38 and Asn40. Additional H-bond with Arg43 of the proximal PVCL2 residue, was also observed. The (3R) enantiomer directly interacted with Arg43 through π-cation interaction, and with Asp32 through an H-bond. Bonding with four water molecules were also involved, and a Van der Waals interaction with a PVCL2 residue was found. For the (3S) enantiomer, π-cation interaction with Arg43, two H-bonds with Asp28 and Pro27, and Van der Waals interactions with two PVCL2 residues were prominent. Only one H-bond with water was observed, and π-anion interaction with Glu29 was also detected. The RMSD of the compounds in presence of PVCL2 were gidazepam, 0.62 ± 0.019 Å; (3R)-hydroxy desalkylgidazepam, 0.28 ± 0.004 Å; (3S)-hydroxy desalkylgidazepam, 0.77 ± 0.009 Å. Figure 5 depicts the binding modes of gidazepam, (3R)-, (3S)-hydroxy desalkylgidazepam, diazepam, and 4-chlorodiazepam on the TSPO with POPC and PVCL2 membranes.
Fig. 5
Illustration of the binding mode of gidazepam (a), (3R)-hydroxy desalkylgidazepam (b), (3S)-hydroxy desalkylgidazepam (c), diazepam (d), and 4-chlorodiazepam (e) on the 18 kDa translocator protein (TSPO) in the presence of 1-Palmitoyl-2-oleoyl-glycero-3-phosphocholine (POPC). The binding mode with TSPO in presence of 1,1’-Palmitoyl-2,2’-vacenoyl-cardiolipin (PVCL2) for gidazepam (f), (3R)-hydroxy desalkylgidazepam (g), (3S)-hydroxy desalkylgidazepam (h), diazepam (i), and 4-chlorodiazepam (j) are also depicted. RMSD values in presence of POPC (k) and PVCL2 (l) lipids are also shown for gidazepam (black), (3R)-hydroxy desalkylgidazepam (red), (3S)-hydroxy desalkylgidazepam (green), diazepam (blue), and 4-chlorodiazepam (orange)
Comments (0)