
Remember me
Both study algorithms performed well against the gold-standard case definition for IED (Table S3). The narrow algorithm presented a sensitivity of 94%, a specificity of 100%, a PPV of 61%, an F1 score of 0.74, and a Youden index of 0.93. For the broad algorithm, these validation statistics were 97%, 99%, 35%, 0.51, and 0.95, respectively.
Main AnalysesSource PopulationThe source population identified by each algorithm comprised 1,169,319 (narrow algorithm) and 1,169,224 (broad algorithm) adults. Table 2 shows the distribution of demographic characteristics in these populations. The median follow-up time was 4 years. Females accounted for 51.4% of the study population, the median age at the start of follow-up was 36.4 years, 12.2% of persons were aged ≥ 60 years, and 1.4% were aged ≥ 80 years. Most people (62.3%) were registered as white.
Table 2 Distribution of demographic characteristics in the source populationsIED Epidemiology—IRsThe IED IR in the total population is summarized in Table 3. Over the 21-year study period, 80.9 (95% CI: 78.8–83.0; 5,832 cases) and 145.8 (143.0–148.6; 10,490 cases) IED cases per 100,000 PY were reported as identified by the narrow and broad algorithms, respectively. The IR was 1.5 to 2.1 times higher in females compared to males (97.1 [females] versus 62.7 [males] per 100,000 PY—narrow algorithm; 193.8 [females] versus 92.1 [males] —broad algorithm). The IR was highest among those with ‘Other’ race/ethnicity and increased over time, from 45.6 (95% CI: 42.7–48.7; narrow algorithm) and 98.4 (94.0–102.8; broad algorithm) per 100,000 PY in 2002–2007 to 119.3 (113.1–125.8; narrow) and 190.4 (182.5–198.6; broad) per 100,000 PY in 2020–2022. Additionally, a major increase was observed with age, from 31.2 (29.7–32.8; narrow) and 62.6 (60.4–64.8; broad) per 100,000 PY in 18–59-year-olds to 450.0 (427.3–473.6; narrow) and 878.3 (846.3–911.3; broad) in ≥ 80-year-olds (Table 3).
Table 3 IED IR in the total study populationTo understand the incidence of IED specifically among populations with comorbidities, the IED IRs were estimated among patients with a history of UTIs (Table S4) and among patients with other comorbidities (main comorbidity categories: Fig. 1; detailed comorbidities, narrow algorithm: Table S5; detailed comorbidities, broad algorithm: Table S6). Among the population with a history of UTIs, the IR was at least 2.8-fold higher than in the total study population. More specifically, the IR of IED among ≥ 18-year-olds who were diagnosed with a UTI at least 14 days before the IED episode was 248 (95% CI: 239–256) per 100,000 PY and 467 (455–478) per 100,000 PY based on the narrow and broad algorithms, respectively (Table S4).
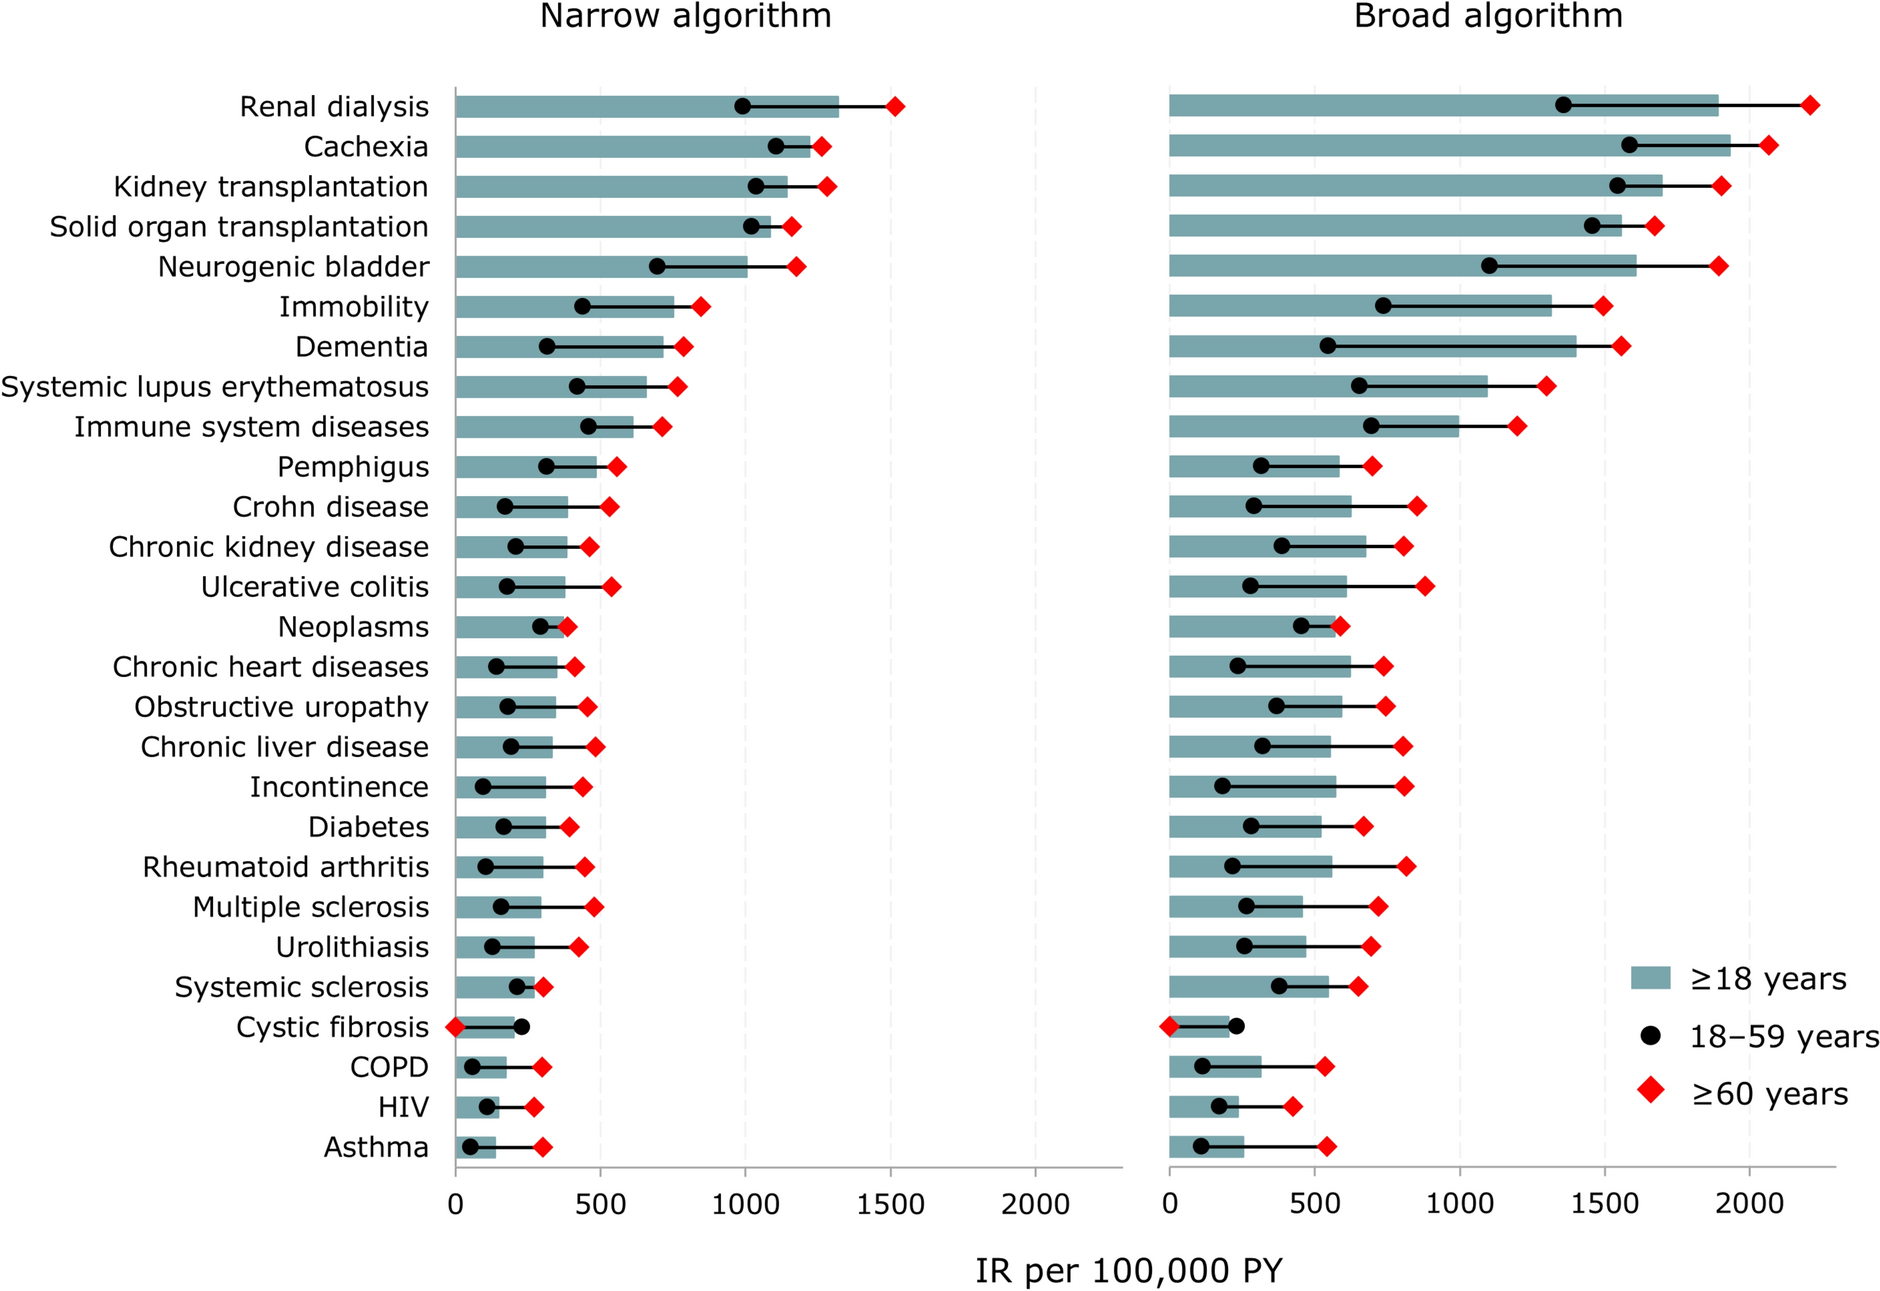
Fig. 1
IED IR for individuals with pre-specified comorbidities (excluding UTIs) by age. COPD chronic obstructive pulmonary disease, HIV human immunodeficiency virus, IED invasive E. coli disease, IR incidence rate, PY person-years, UTI urinary tract infection
Stratification of the data allowed for the assessment of the IED burden per UTI type. The IED IR was highest in individuals with recurrent UTIs, followed by those with complicated UTIs; females with uncomplicated UTIs had the lowest IED IR (Table S4). More specifically, among ≥ 18-year-olds who were diagnosed with a UTI at least 14 days before the IED episode, the IED IR was 482 (95% CI: 458–507; narrow algorithm) and 927 (893–962; broad algorithm) per 100,000 PY for those with recurrent UTIs; 440 (423–457; narrow algorithm) and 809 (786–833; broad algorithm) per 100,000 PY for individuals with complicated UTIs; and 162 (154–170; narrow algorithm) and 340 (328–352; broad algorithm) per 100,000 PY for women with uncomplicated UTIs. The IED IR was higher among males than females for individuals with any UTIs and recurrent UTIs, but higher for females than males for individuals with complicated UTIs.
Among populations (both sexes) with pre-specified comorbidities (excluding UTIs) diagnosed at least 14 days before the IED index date, the IED IR was 1.7- to 35.7-fold (narrow algorithm) and 1.4- to 22.7-fold (broad algorithm) higher than among the total study population (Fig. 1, Tables S5 and S6). Among the main comorbidity categories, the highest number of IED cases per 100,000 PY was recorded for individuals on renal dialysis (1320 [95% CI: 1127–1536] per the narrow algorithm and 1890 [1655–2149] per the broad algorithm) and individuals with cachexia (1220 [929–1574]—narrow; 1932 [1555–2372]—broad), kidney transplantation (1142 [920–1400]—narrow; 1697 [1421–2011]—broad), solid organ transplantation (1085 [897–1302]—narrow; 1555 [1325–1814]—broad), or neurogenic bladder (1003 [875–1145]—narrow; 1606 [1440–1786]—broad). Overall, IRs for individuals with pre-specified comorbidities were higher in individuals aged ≥ 60 years than in those aged 18–59 years (Fig. 1).
IED Epidemiology—CFRs and MRsThe IED CFRs and MRs in the total population are summarized in Table 4 (30 days), Table S7 (48 h and 7 days), Table S8 (365 days), Fig. S1 (CFRs stratified by age and sex), and Fig. S2 (MRs stratified by age and sex). The CFR increased with time since the IED diagnosis. Based on the narrow algorithm, the CFR across age groups was 1.3% (95% CI: 1.0–1.6%) at 48 h, 3.1% (2.7–3.6%) at 7 days, and 7.6% (6.9–8.3%) at 30 days after the IED index date. Based on the broad algorithm, these respective CFRs were 0.9% (95% CI: 0.7–1.1%), 2.7% (2.4–3.0%), and 7.2% (6.7–7.7%) (Table 4, Table S7). One year after the IED event, 19.3% (95% CI: 18.3–20.3%; narrow) and 19.8% (19.0–20.5%; broad) of patients had died (Table S8). The IED 30-day MRs across all age groups were 6.1 (95% CI: 5.6–6.7) and 10.4 (9.7–11.2) per 100,000 PY of follow-up using the narrow and broad algorithms, respectively (Table 4). At 365 days after the IED index date, the MR across all age groups was 15.6 (95% CI: 14.7–16.5; narrow) and 28.7 (27.4–29.9; broad) per 100,000 PY (Table S8). For both algorithms, a higher 30-day CFR was observed in the ≥ 60-year-old population than in the 18–59-year-old population (9.1% versus 3.6%—narrow; 9.3% versus 2.5%—broad) (Table 4, Fig. S1); similar trends were observed for the MRs (Table 4, Fig. S2).
Table 4 30-day IED MR and CFR for the total study populationTo understand all-cause mortality specifically among populations with comorbidities, we separately presented the CFRs among those with a history of UTIs (Table S9 [48 h], Table S10 [7 days], Table S11 [30 days], and Table S12 [365 days]) and those with other comorbidities (Fig. 2 [30 and 365 days; main comorbidity categories], Table S13 [30 days; detailed comorbidities; narrow algorithm], Table S14 [30 days; detailed comorbidities; broad algorithm], Table S15 [365 days; detailed comorbidities; narrow algorithm], and Table S16 [365 days; detailed comorbidities; narrow algorithm]). The CFRs among individuals with a history of UTIs were comparable to the general population at most time points since IED diagnosis; however, at 365 days after the IED index date, a slightly higher proportion of patients had died among those with a history of UTIs compared to the general population. Based on the narrow algorithm, the CFR across age groups in individuals with a UTI diagnosis at least 14 days before the IED index date was 1.2% (95% CI: 0.8–1.6%) at 48 h, 2.8% (2.3–3.5%) at 7 days, and 7.7% (6.9–8.7%) at 30 days after the IED index date. Based on the broad algorithm, the respective CFRs were 0.9% (95% CI: 0.7–1.1%), 2.8% (2.4–3.2%), and 7.8% (7.2–8.5%). One year after the IED event, 21.3% (95% CI: 19.9–22.7%; narrow) and 22.7% (21.7–23.8%; broad) of patients with a history of UTIs had died. CFRs were comparable among UTI subtypes (Tables S9–S12).
Fig. 2
IED CFR for individuals with pre-specified comorbidities (excluding UTIs) by age. CFR case fatality rate, COPD chronic obstructive pulmonary disease, HIV human immunodeficiency virus, IED invasive E. coli disease, UTI urinary tract infection
More all-cause deaths occurred among individuals with specific comorbidities than in the general population. At 30 days after the IED index date, CFRs among ≥ 18-year-olds were highest in patients with cachexia (22.0% [95% CI: 12.3–34.7%] and 17.6% [10.4–27.0%] per the narrow and broad algorithms, respectively), pemphigus (only six IED cases; 20.0% [0.5–71.6%]—narrow; 16.7% [0.4–64.1%]—broad), ulcerative colitis (14.5% [10.3–19.4%] – narrow; 13.8% [10.6–17.6%]—broad), and neoplasms (13.8% [11.4–16.4%]—narrow; 13.5% [11.6–15.6%]—broad) (Fig. 2, Tables S13–S16). For most comorbidities, 30-day CFRs were higher among ≥ 60-year-olds than 18–59-year-olds, except for neoplasms, human immunodeficiency virus (HIV), and systemic sclerosis (Fig. 2).
IED Risk FactorsThe risk of IED in the population with a history of UTIs and pre-defined comorbidities was estimated using unadjusted and adjusted IRRs. The unadjusted IRRs are presented in Table S17 for the population with a history of UTIs and in Fig. S3 for the populations with other comorbidities.
The adjusted, risk-factor-specific IRRs demonstrated that a history of UTIs increased the risk of IED the most (Table 5). Compared to patients without a history of UTIs, the risk of IED was at least five times higher. More specifically, the risk was 7.4 (narrow algorithm) and 12.6 (broad algorithm) times higher in patients with a complicated UTI and 5.2 (narrow) and 7.7 (broad) times higher in patients with any UTI (Table 5). Most of the pre-specified comorbidities at most doubled the risk of IED (Table 5).
Table 5 Adjusted IED IRRs in individuals aged ≥ 18 years with the specified comorbidity from ≥ 14 days after comorbidity diagnosis until the end of follow-up compared to those without the pre-specified comorbidity
Comments (0)