
Remember me
Optimization of the method started with the individual infusion of the available NAs standards at a concentration of 1 µg mL−1 into the mass spectrometer, being ionized in positive mode. During this process, the MRM transitions were optimized for each analyte, as well as the parameters DP and CE. For those analytes for which individual standards were not available, technical specifications provided by the instrument manufacturer and literature references were consulted to obtain the appropriate MRM transitions [37, 41, 44]. The DP and EC values were then evaluated by additional tests to determine the optimal values offering the best resolution and sensitivity for the analytes. Finally, DP values between 36 and 120 V and EC values between 8 and 64 V, depending on the NA, were selected.
The next step was to select the conditions to achieve correct separation of the 14 NAs studied. The chromatographic column, mobile phase flow rate, composition, and elution program were adopted on the basis of the conditions recommended in the technical data sheet of the instrument for the analysis of these compounds [41, 44]. Two different columns packed with the same stationary phase were tested: Phenomenex Luna Omega C18 (100 × 2.1 mm and 1.6 µm) and ACQUITY UPLC HSS T3 (100 × 2.1 mm and 1.8 µm). No significant differences in resolution efficiency were observed between both columns, so ACQUITY UPLC HSS T3 was selected as it provided lower system pressure, thus avoiding overpressure situations in the instrument.
Due to the higher number of NAs compared to those used in the technical data sheet, correct separation of all analytes was not achieved from the initial conditions tested for mobile phase composition (solvent A, 0.1% v/v formic acid aqueous; solvent B, methanol with 0.1% v/v formic acid), flow rate (0.5 mL min−1), and elution program. Special attention was paid to the separation of NDBA and NDiBA, as these compounds overlapped in these initial tests. It was therefore decided to carry out a test to see if changing the composition of the mobile phase would allow the separation of both compounds. Both solvents A and B of the mobile phase were modified by the addition of ammonium formate at 5 mM, resulting in excellent peak shape, but complete separation of NDBA and NDiBA was not achieved. Finally, after several experiences with different flow rates and elution programs, the best resolution among the 14 NAs was obtained with a mobile phase flow rate of 0.4 mL min−1, and the elution program was as follows: started at 5% B (held for 0.5 min), increased to 15% B at 1 min and held for 1 min, being then observed the elution of NDMA. It was then increased linearly to 65% B at 6 min, allowing the elution of NMOR, NEMA, NPYR, NDEA, and NPIP. This composition was maintained until 9 min, allowing the elution of NMPhA, NDPA, NEPhA, NDBA, and NDiBA with no overlap observed. This was then increased to 95% B until 10 min and maintained for 1 min, allowing the elution of NDPhA, NDBzA, and NDCHA. Finally, it was decreased to 5% B at 11.5 min and held for 3.5 min, giving a total analysis time of 15 min (Table 1).
Evaluation of sample treatmentIn order to optimize the sample treatment for efficient isolation of NAs, the UAE technique was selected. Initially, 5 mL of water was added to 0.5 g of sample (cooked ham or feces), and the mixture was sonicated for 5 min. For protein precipitation, 0.5 mL of 55% w/v TCA was then added, after which the mixture was centrifuged at 10 °C and 6000 rpm for 5 min. Finally, the supernatant was filtered, and the pH was adjusted to 3 with a NaOH solution to ensure compatibility with the chromatographic column.
To eliminate the need for this subsequent pH adjustment and simplify the process, a variant was evaluated in both matrices. In this variant, 5 mL of water was replaced with 5 mL of 5% v/v formic acid [45], and the use of TCA and the neutralization step with NaOH was omitted. No appreciable differences were observed when comparing both procedures (Fig. S1), so formic acid was selected as it offered a simpler alternative for sample preparation.
Different sample amounts were evaluated due to the complexity of both biological matrices. Three experiments were carried out with 0.1, 0.3, and 0.5 g of sample. For feces, 0.3 g of sample allowed to obtain higher sensitivities (Fig. S2). Increasing the amount of sample, the matrix effect became significant for most, resulting in a reduction of the analytical signal for several NAs. For cooked ham, the optimal sample amount was 0.1 g, as it allowed to obtain narrower and sharper chromatographic peaks. Additionally, filtering the extract from cooked ham samples larger than 0.1 g was difficult due to their content of insoluble compounds, so several filters had to be used.
Method validationThe regression coefficients (R2) obtained for all analytes, in the absence and presence of the two evaluated matrices (cooked ham and feces), were greater than 0.99, demonstrating excellent linearity in the range of concentrations studied. In all cases, significant differences (P-value < 0.05) were observed between the slopes of the curves corresponding to the matrices and the aqueous standards, confirming the presence of a matrix effect preventing quantification of the samples against aqueous standards. Then, the two concentration levels (25 and 200 ng g−1, except for NDMA which was performed at 200 and 500 ng g−1) of each NA were evaluated in different types of ham and fecal samples. The results showed an RSD of less than 13.3% in all cases. This indicates good homogeneity between the samples within each matrix. Therefore, it was unnecessary to create a curve for each study group, as no significant differences in the NA signal were observed between the groups.
Next, 14 calibration curves were constructed, one for each analyte. The excellent linearity in the ranges studied was demonstrated by R2 values higher than 0.99 (Table S1). The linear ranges obtained for the fourteen calibration curves are shown in Table 2.
Table 2 Method validation data for the determination of NAs in cooked ham and feces samplesIn addition, LODs ranging from 0.59 to 14 ng g−1 were found for the cooked ham matrix and from 0.13 to 5.6 ng g−1 for the feces matrix (Table 2). The most sensitive analyte was NDBA, and the least sensitive was NDMA in both types of samples.
In all cases, the results obtained in terms of RSD for the intraday and interday precision studies showed values of less than 8.8% and 12.4%, respectively. On the other hand, trueness, expressed as recovery, was calculated by dividing the measured concentration by the actual concentration and expressing the result as a percentage. The obtained values were found to be between 88 and 109%.
Stability studies of the standard solutions showed excellent results with RSD values between 1.2 and 4.3%, indicating that the solutions remain stable for at least 48 h. Regarding sample stability, on the other hand, it was observed that the signal varied considerably after 48 h for both matrices. Therefore, it was decided that the samples should be prepared on the same day of the analysis.
Finally, for carry-over studies, it was found that in no case did the signal of the blank vary with an RSD greater than 4.0%.
The chromatograms obtained for feces sample spiked with 100 ng g−1 of all NAs using the proposed method are shown in Fig. 1. Similarly, Fig. S3 shows the chromatograms obtained for a cooked ham sample enriched with 100 ng g−1.
Fig. 1
Chromatograms obtained for a fecal sample spiked with 100 ng g−1 NAs
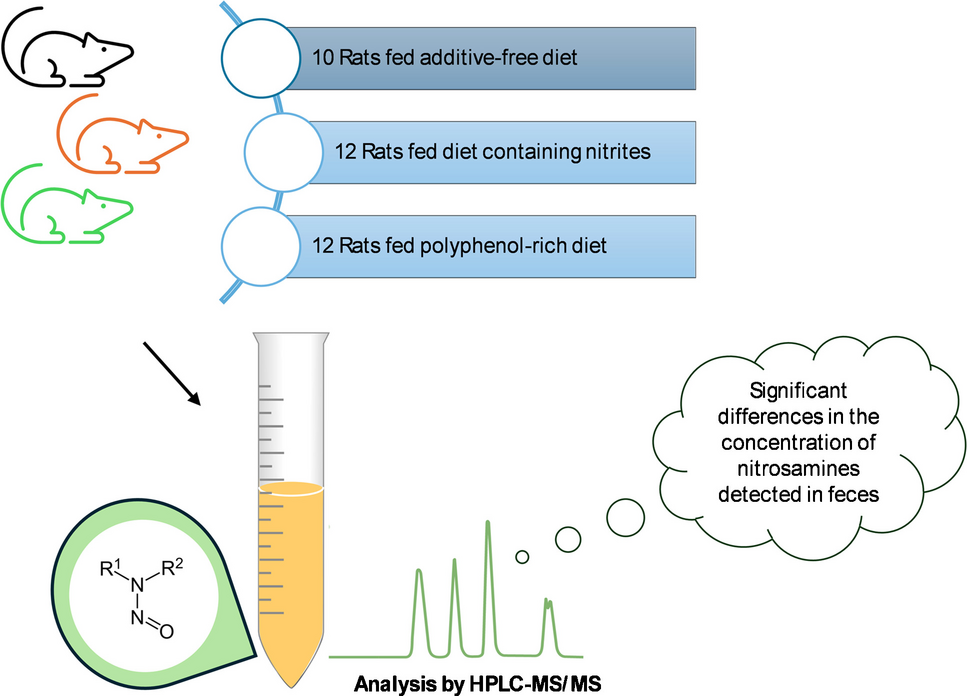
Analysis of samples and statistical studiesThe application of the proposed methodology allowed the evaluation of the NAs present in cooked ham and in fecal samples obtained from animals fed with different ham-based diets (without nitrites, with nitrites, and with polyphenols). The aim was to compare the concentrations detected in the different groups to see if there were any significant differences.
Table 3 summarizes the results obtained for the cooked ham samples. None of the samples contained detectable levels of NMOR, NEMA, NDEA, NDPA, NPIP, NEPhA, NDPhA, NDBzA, and NDCHA. The other five NAs, however, were sporadically detected across the sample set. NDMA was the most concentrated NA detected in both hams produced without nitrites and with nitrites. In contrast, the NA detected at the highest concentration in hams produced with polyphenols was NMPhA. Additionally, the total concentration of NAs detected in the cooked ham samples in this study aligns with previous studies on this product [21, 24].
Table 3 Concentration of NAs found in the cooked ham samples analyzedThe results for the fecal samples were summarized in Table 4. NDMA, NMOR, NEMA, NPYR, NPIP, NDBzA, and NDCHA were below LODs in all cases. However, the other seven NAs were present in a subset of the samples, indicating a variable distribution. The NA detected at the highest levels was NDPhA, highlighting that while feces from animals fed diets rich in nitrites or in the absence of nitrites reached concentrations above 50 ng g−1, this NA was not detected in any of the fecal samples from rats fed diets rich in polyphenols. It should also be noted that in the two groups not fed nitrites, NDEA, one of the NAs classified by IARC as the most dangerous, was not detected, whereas in the group of rats fed a diet containing nitrites, NDEA was detected in 33.3% of the samples.
Table 4 Concentration of NAsAQ found in the feces samples analyzedTo show the differences in total NA concentrations depending on the matrix type and preservative used, the mean values per group were plotted alongside their standard deviation (Fig. 2). At first glance, it can be seen that the fecal samples from rats fed a polyphenol diet showed a significantly lower total NA concentration compared to the other study groups. In contrast, no notable differences were observed among the three study groups in the cooked ham samples due to the large error bars, indicating high variability.
To evaluate the joint effect of preservative type (nitrite-free, nitrites or polyphenols) and matrix (ham or feces) on the NAs concentration profile, a two-way PERMANOVA analysis was performed. The model was estimated using 9999 permutations to ensure that the significance values were estimated robustly. The results indicated a statistically significant effect of matrix type (P-value = 0.0001), suggesting marked differences in NA profiles between ham and feces. In contrast, the main effect of the preservative was not significant (P-value = 0.0568). However, the P-value was very close to the conventional threshold of 0.05, suggesting a possible tendency to generate differences that deserves further exploration. Furthermore, a significant interaction was detected between preservative type and matrix (P-value = 0.006), indicating that the preservative’s effect varies according to the analyzed matrix. Taken together, these results show that NA profiles mainly vary according to the matrix (cooked ham or feces) and that the impact of the preservative used differs between the two matrices. These results suggest that biological processes occurring after ingestion of food can modify NA formation or elimination, which is important when evaluating NA risk to the organism. Therefore, independent analyses by sample type are required to study more precisely the effect of the preservative used.
Fig. 2
Total nitrosamine concentration (mean ± standard deviation) in ham (H) and feces (F), categorized by the type of preservative used: free of preservatives (N0), nitrite (N120), or polyphenols
To evaluate the effect of the type of preservative used on the concentration profile of NAs detected in each matrix independently, a one-way PERMANOVA was performed. For cooked ham, this analysis revealed no significant differences between the preservatives used (P-value = 0.3122). Pairwise comparisons between groups (free nitrite, nitrite, and polyphenols) also revealed no statistically significant differences (P-values > 0.13, Table S2), indicating that using different preservatives does not significantly alter the NA profile in the analyzed meat products. In contrast, the type of preservative did have a significant effect on the NA concentration profile in the fecal matrix (P-value = 0.008). Pairwise comparisons (Table S3) revealed significant differences between the nitrite-treated group and polyphenol-treated group (P-value = 0.0027), as well as between the no preservative group and the polyphenol-treated group (P-value = 0.0022). However, the difference between the no preservative group and nitrite-treated group was more subtle (P-value = 0.160).
These results suggest that preservatives do not significantly influence the NA profile on cooked ham. This finding can be attributed to the production process, as the formation of NAs in meat products is primarily associated with the use of nitrites at temperatures above 100 °C. Numerous studies confirm that processing meat products containing nitrites at high temperatures, such as during roasting or frying, produces large amounts of N-nitrosamines [4]. In our study, the manufacturing process for cooked hams involves cooking at a lower temperature (68 °C), which inhibits the formation of N-nitrosamines, even in the group treated with nitrites. This is the main reason for the absence of differences in NA levels between groups of cooked hams. However, they do influence the modulation of the NA profile after passage through the digestive system, as evidenced by the differences detected in fecal samples. This indicates a possible effect of preservatives on the formation, transformation, or availability of NAs at the intestinal level, which could have important toxicological implications.
Since differences were observed among the groups in the fecal matrix, a more in-depth analysis was conducted by performing individual comparisons for each NA in the feces. A Kruskal–Wallis test was applied to each NA since the data did not follow a normal distribution. Significant differences were found in the concentration of NDEA (P-value = 0.018), NDPA (P-value = 0.005), and for NDPhA (P-value = 0.014). A Kruskal–Wallis test was then performed again, this time on the total level of NAs per sample, and significant differences between the study groups were observed (P-value = 0.002). Dunn’s test was then performed, which showed that there were significant differences in the total concentration of NAs between the feces of animals fed the nitrite diet and those fed the polyphenol-rich diet. Correlating these results with the data presented in Table 4, it can be concluded that the presence of NAs is higher in nitrite diet-fed animals with a mean total NAs concentration of 37 ng g−1 and with all samples being positive for one or more of the 7 NAs detected in the fecal samples. In contrast, the total concentration of NAs is significantly lower in rats fed a polyphenol-rich diet, with a mean total concentration of 3.6 ng g−1 and two samples not testing positive for any NAs.
These findings confirm that, although the use of preservatives does not significantly alter the NA profile in ham, it does influence the presence of specific compounds, such as NDEA, NDPA, and NDPhA, after the digestive process. Notably, the use of nitrite as a preservative results in a greater difference compared to the use of polyphenols, suggesting a possible protective effect of the latter against the formation of NAs in the organism. Furthermore, previous research studying the same animal model where colon cancer lesions were induced with the diet indicates that a polyphenol diet also reduces the formation of genotoxic fecal aldehydes and preneoplastic lesions [20]. Therefore, both studies agree that the addition of polyphenols to the diet reduces the production of toxic fecal metabolites.
To illustrate the distribution of each NA under the different study conditions, a heatmap (Fig. 3) was created showing the presence or absence of each NA in each sample, according to the matrix and type of preservative used. This visualization enables the quick identification of compounds that appear in one matrix or both, and the experimental conditions under which they appear. Thus, cases such as NDMA (present only in cooked ham) and NEPhA and NDPhA (present only in feces) stand out.
Finally, the possible association between the presence of NAs in both the cooked ham and the animal’s feces was evaluated to determine whether these compounds are present in both or only in one or neither. This approach enabled compounds that may be associated with transformations occurring during the digestive process to be identified. For NAs detected in both matrices, 2 × 2 contingency tables were constructed to code cases where the compound was present in both, one or neither of the matrices. Fisher’s exact test was applied. The results are summarized in Table S4. Statistically significant differences were detected for NMPhA (P-value = 0.002) and NDiBA (P-value < 0.001), indicating that these compounds are not randomly distributed between the matrices but are associated with one another.
In the case of NMPhA, the detections in both matrices were frequent, whereas individual detections in only one matrix were less common. This pattern suggests that when NMPhA is present in cooked ham, it is more likely to be found in the animal feces that were fed that ham. This indicates a possible relationship between the presence of NMPhA in a diet and its subsequent appearance in the organism. NDBA was detected simultaneously in both matrices in 17 cases, making it the most frequent combination in the contingency matrix. While this coincidence was notable, Fisher’s exact test yielded a P-value of 0.116, indicating that the association was not statistically significant. Nevertheless, the observed trend may indicate a relationship worth exploring with a larger sample. In the case of NDiBA, the pattern was particularly clear: it was never detected in feces unless it was also present in ham. This unidirectional dependence suggests that presence in the meat matrix is a prerequisite for its appearance in feces. Fisher’s test confirmed this strong association, yielding a P-value of less than 0.001. Taken together, these results reinforce the hypothesis that some NAs remain stable throughout the digestive process, reflecting their presence in the fecal matrix after being ingested. Specifically, NMPhA exhibited significantly different levels in the nitrite group (P-value = 0.010), suggesting a potential interaction between this preservative and the bioavailability or stability of these molecules during digestion.
Fig. 3
Heatmap showing the distribution of the presence of nitrosamines according to the type of matrix (ham (H) and feces (F)) and the type of preservative (free of preservatives (N0), nitrite (N120) or polyphenols)
On the other hand, a Z-test for comparison of proportions was applied to NAs that were detected in only one of the matrices and generated empty cells in the Fisher matrix. The results are presented in Table S5. Significant differences were found overall for NDMA (P-value = 0.005), NDEA (P-value = 0.039), NEPhA (P-value = 0.005), and NDPhA (P-value = 0.003). This differential pattern could be related to specific transformation or formation processes during digestion, or to the stability of each NA depending on the chemical environment of each matrix. In the case of NDMA, which was detected exclusively in ham, it is possible that it forms during the thermal processing or curing of the product, but that it is unstable during digestion or rapidly degraded and not excreted in detectable amounts. Conversely, the exclusive presence of NDEA, NEPhA, and NDPhA in feces suggests that these NAs may be generated in situ during digestion. Taken together, these results support the idea that certain NAs are distributed non-randomly between matrices, depending on the type of preservative used.
Finally, comparison of the analytical method developed in this study with other previously published methods (Table 5) reveals several significant advantages. First, it enables the simultaneous determination of a greater number of NAs (14 in total). Additionally, it has been developed to analyze both cooked ham and fecal samples, offering the possibility of jointly evaluating daily exposure and the presence of these compounds in biological matrices. Furthermore, sample preparation is simpler than in most protocols, requiring less time (15 min) and a minimal amount of solvent (5 mL). Finally, this method offers a novel perspective on food safety by analyzing how different additives, such as polyphenols and nitrites, affect NA formation in meat products and feces. The latter has been a relatively unexplored area until now.
Table 5 Comparison of different methods for nitrosamines analysisEvaluation of the greenness and innovation of the proposed methodSeveral metric tools have recently been developed to assess environmental sustainability, efficiency, and the innovative nature of analytical procedures. AGREEprep is designed to analyze the sustainability of sample preparation stages using the ten principles of green sample preparation (GSP) as a reference. This tool uses a scale from 0, indicating no sustainability, to 1, indicating maximum sustainability (totally green) [46]. The method proposed in this study obtained a score of 0.51 in AGREEprep (Fig. 4A), reflecting an intermediate level of sustainability. Among the positive aspects of this procedure are the low quantity of samples used, moderate energy consumption, the reduced number of risks associated with the procedure, and the relatively low volume of acid used (0.25 mL in 4.75 mL of water). Negative aspects identified include the need to perform the procedure ex situ (in the laboratory), the use of a large number of non-reusable materials and reagents, and the lack of automation. Overall, these results demonstrate that, despite several areas for improvement, the procedure can be considered to have acceptable environmental performance.
Another tool used to evaluate the procedure was the Sample Preparation Metric Of Sustainability (SPMS), which evaluates the sample preparation stage exclusively and explicitly in terms of sustainability [47]. After evaluating the nine parameters considered, a final score of 7.68 out of 10 (Fig. 4B) was obtained, indicating favorable performance. The favorable evaluation was influenced by several factors, including the small sample amount used, the type of acid used for extraction, and the absence of evaporation, dilution, or derivatization stages. However, the need for cooling during centrifugation was identified as a negative aspect, as this slightly affected the evaluation. Other negative aspects were the use of an acid as extractant and the need for more than one manual step to carry out the described procedure. In summary, this score indicates that the procedure is sustainable and efficient, with scope for minor improvements.
The Red Analytical Performance Index (RAPI) and the Blue Applicability Grade Index (BAGI) were also evaluated. These are two complementary tools used to measure the practical applicability of the proposed analytical method [48]. Ten different parameters were evaluated in each tool to obtain the score for both indices. In both cases, a total score of 72.5 out of 100 was obtained, reflecting the high applicability of the method (Fig. 4C and D). When applying RAPI, it can be seen that the method provides excellent validation results in terms of accuracy, linearity, the width of the studied calibration range, and robustness. However, the lack of studies related to possible interferents slightly hinders it, despite the highly sensitive instrumental technique used, as does the low average concentration of the samples, which, in the case of some NAs, is close to the LOQ. Regarding BAGI, the proposed method is straightforward as it uses commonly available reagents and does not require complex preconcentration steps. However, it is hampered by the analytical instrumentation used, as this equipment is not commonly found in routine laboratories.
Fig. 4
Pictograms illustrating the results of the greenness assessment obtained using: A AGREEprep, B Sample Preparation Metric Of Sustainability (SPMS), C Red Analytical Performance Index (RAPI), D Blue Applicability Grade Index (BAGI), and E Violet Innovation Grade Index
Finally, the Violet Innovation Grade Index (VIGI), a metric designed to evaluate the degree of innovation of analytical methods, was studied [49]. In this research, a score of 50 out of 100 was obtained by evaluating ten innovation-related criteria (Fig. 4E). This score indicates an intermediate level of innovation, reflecting the fact that the method incorporates certain novel elements, such as the analytical instrumentation used, its applicability to various areas of knowledge, and the relevance of the issue addressed. However, the method’s degree of innovation is limited by the use of non-innovative reagents and materials, as well as the lack of miniaturization stages. In this sense, the procedure can be considered competitive in terms of innovation, although there is room for improvement to achieve higher values.
Overall, evaluation of the proposed method using different metrics showed that it achieves acceptable and efficient environmental performance and has a high degree of applicability and intermediate innovation.
Comments (0)