
Remember me
It is known that MPs often exist in the environment as mixtures of various plastics and are typically embedded within complex matrices [6]. These matrices can negatively impact the accuracy of thermal analytical results, as organic and inorganic compounds within the matrices are known to lead to over- or underestimation of quantifications [41]. In the current study, we demonstrate the use of MDSC as a feasible thermal analytical method for quantifying MPs in biosolid matrices. To enhance environmental relevance and analytical accuracy, the composition of MPs in complex matrices was mimicked by spiking the dBB matrices with mixtures of CMP-PE, CMP-PP, CMP-PA6, and CMP-PET. As shown in Fig. 1A, distinct melting peaks corresponding to the semicrystalline phases of PE, PP, PA6, and PET were identified, allowing clear differentiation in both MDSC and conventional DSC.
Closer analysis of the thermograms revealed that at low plastic concentrations (i.e., 0.05 mg), MDSC exhibited a flatter baseline and more distinct peak shapes than conventional DSC, particularly for PA6 and PET. This observation is likely due to MDSC’s enhanced ability to detect weak thermal transitions by separating overlapping transitions from matrix decomposition and plastic melting [33, 42, 43], which provides a basis for quantifying MPs in complex biosolid matrices.
The thermal behaviors of individual CMPs (i.e., CMP-PE, CMP-PP, CMP-PA6, and CMP-PET) were separately characterized using the MDSC. Distinct melting points were observed at approximately 110.5 ± 0.7 °C, 155.1 ± 0.6 °C, 220.2 ± 0.4 °C, and 239.5 ± 0.3 °C for CMP-PE, -PP, -PA6, and -PET, respectively (Figure S1). It is interesting to note that for a given polymer, differences in melting point were observed when the polymer was characterized as a polymer mixture vs. individually by MDSC. This was particularly pronounced for PA6 and PET, with melting points shifting up to 7 °C and 8 °C, respectively (Figures S1C–D). A similar Tm shift in PA was also observed in a previous study [29]. Additionally, it is consistent with a recent TG study on mixed thermoplastics; PA6 and PET pairs exhibit interfacial interactions that accelerate degradation and deviate from linear superposition, particularly when contact is high, indicating that phase interactions can alter thermal behavior in mixtures [44]. The shift in melting peaks, therefore, justifies the importance of using polymer mixtures — as opposed to individual polymers — in MPs studies to better understand polymer behavior and achieve more accurate analytical results.
It is noticeable that as the mass of polymers increased, the peak area observed in the MDSC thermograms increased proportionally. To achieve quantification, the reversed heat flow resulting from the plastics' melting behavior during the second heating ramp was utilized, as the melting of plastics is a reversible thermal behavior, to integrate the area under each peak. Additionally, the total heat flow from the second heating ramp was generated and used as a comparative measure, equivalent to conventional DSC.
Fig. 1
Identification and quantification of MPs by MDSC and conventional DSC. (A) MDSC and conventional DSC measurements of quadruple polymer mixtures spiked in biosolids. Melting peaks of polymer mixtures are shown for mixtures spiked in biosolid matrices with total masses of 0.05 ± 0.01, 0.26 ± 0.02, 0.51 ± 0.02, 0.80 ± 0.04, 1.01 ± 0.03 mg, at equal mass proportions of 25% each. Calibration curves for PE (B), PP (C), PA6 (D), and PET (E) in mixtures were obtained using MDSC and conventional DSC, with solid lines representing mixtures spiked into matrices and dashed lines representing mixtures without matrices, respectively. Calibration curves were derived from the melting peak areas (enthalpy). Fitting equations and R2 values are provided in each plot. Error bars indicate the standard deviation (SD) of enthalpy measurements (n = 3). Shaded confidence bands correspond to ± 2 SD, an approximate 95% confidence interval of measurement variability
Building on this proportional relationship, calibration curves were generated by integrating peak areas under the melting peaks and plotting them against the corresponding masses of each plastic, using CMP mixtures prepared with and without dBB matrices. Figure 1B–E present the calibration curves for PE, PP, PA6, and PET individually, obtained during the second heating ramp by both MDSC and conventional DSC. All curves showed coefficients of determination (R2) greater than 0.99, except for PA6 in matrices and for PET (with or without matrices), analyzed by conventional DSC, which exhibited lower R2 values in both MDSC and DSC analyses. This is most likely attributed to the secondary reaction involving PA6 in the presence of PET during co-heating, an observation well documented in previous studies [45]. Consistently, it has been reported that PET and PA6 show the highest deviations in recovery and the most significant relative standard deviations. Moreover, the calibration curve using PET alone spiked into dBB matrices yielded a good linear fit (R2 > 0.99; Figure S2) in the absence of PA6, further supporting the notion that such secondary reactions affect quantitative reliability when analyzing mixtures containing these polymers.
A closer analysis of the calibration curves reveals that the dBB matrices did not affect the results from either MDSC or conventional DSC when the second heating ramp of the heat–cool–heat cycle was used, as evidenced by the similar slopes of curves with and without dBB matrices. However, as the compositions of matrices from different sources vary, potential matrix effects must still be carefully considered. Thus, calibration curves generated with biosolid matrices were used for all subsequent quantification.
Higher sensitivity and lower LOQs of MDSCThe sensitivity of MDSC and conventional DSC for plastic quantification was compared using the slopes of calibration curves [46]. MDSC exhibited consistently steeper calibration slopes across all polymers (Fig. 1B–E), suggesting a sensitivity 1.4–2.5 times higher than that of the conventional DSC method for all polymer types investigated. This increased sensitivity arises primarily from MDSC’s ability to detect subtle enthalpy changes associated with metastable crystallites that can form due to previous thermal or mechanical processing or other pre-treatments of the plastics [47]. Such enhanced detection is particularly beneficial for low-mass samples or those with weak thermal responses that might otherwise go undetected by conventional DSC.
The limit of quantification (LOQ) for each polymer was determined from the calibration curves using the standard approach: \(LOQ=\frac\), where SD is the standard deviation of the peak area of the blank (dBB matrix) measured at the onset and offset of the MPs’ melting peaks (79, 120, 168, 226, and 265 °C for PE, PP, PA6, and PET), and S is the slope of the calibration curve [48]. Using this approach, MDSC achieved lower theoretical LOQs than conventional DSC for all polymers, reaching as low as 0.0001 mg per measurement, corresponding to ~ 7 μg/g in concentration for PA6 (Table S1), confirming its higher sensitivity.
For example, at a PET sample mass of 0.02 mg (Fig. 2A), the PET melting peak at 244 °C was clearly detectable in the MDSC thermogram. In contrast, no corresponding peak was observed in conventional DSC (Fig. 2A, ii) until the sample mass was increased to ≥ 0.05 mg (Fig. 2B, iv). It is noted that PA6 shows a higher melting enthalpy at the lower mass (Fig. 2A, i and B, i). This is because, with a fixed PA6:PET ratio (1:1), increased PET content enhances PET’s cold crystallization and the leading tail of its melt, which affects the baseline near the PA6 melting point. The lower detection threshold of MDSC is likely due to its slower underlying heating rate, which keeps the system closer to equilibrium and provides a more stable baseline for detecting weak thermal transitions [49]. In addition, MDSC can separate reversible polymer melting from non-reversible signals arising from matrix decomposition [33, 43], allowing more sensitive detection of small amounts of plastics in complex matrices such as biosolids, where incomplete decomposition of inorganic matter may otherwise obscure weak melting peaks in conventional DSC.
Fig. 2
MDSC and conventional DSC thermograms of polymer mixtures spiked in digested blank biosolid (dBB). PA6 and PET were added in equal amounts at two total masses: (A) 0.02 mg and (B) 0.05 mg. Insets (i–iv) show enlarged views of the PA6 and PET melting regions from the conventional DSC thermograms
It should be mentioned that although the LOQs of MDSC are higher than those achieved by mass spectrometry-based methods, the lowest theoretical LOQ for PA6 at 7 μg/g is comparable to that of the Py-GC/MS [50]. While MDSC measurements require larger sample sizes (generally > 0.1 mg of dried solids per measurement), the increased sample size reduces heterogeneity in sampling, thus lowering variability in results from heterogeneous samples such as MPs in biosolids.
By isolating plastic melting signals and performing matrix decomposition, MDSC improves sensitivity for plastic quantification. In the environmental-mimicked scenario with CMP mixtures in biosolid matrices, these low quantification limits enable the detection of MPs at trace levels. Compared to conventional DSC, MDSC provides more reliable measurements with smaller sample sizes, offering advantages for detecting increasingly pervasive MPs at minute concentrations.
Factors affecting sensitivity and accuracy in MDSC quantificationCrystallinity and aging historyQuantifying low-crystallinity or amorphous plastics by conventional DSC is challenging because their thermal responses are weak or diffuse, lacking the sharp melting transitions and large enthalpy changes typical of highly crystalline polymers [51]. For instance, polystyrene (PS) undertakes a glass transition rather than melting. As illustrated in Figure S3, MDSC can detect the presence of PS. Still, the signal-to-noise ratio is substantially reduced, particularly in multi-component mixtures with PE, where the melting of low-density PE (LDPE) overlaps with the PS glass transition [30]. Among the four micron-sized plastics analyzed, PE and PP displayed the highest thermal response (Fig. 1A), owing to their defined crystallinity [28, 52]. In contrast, PET exhibited the weakest signal, consistent with its lower crystallinity fraction [28, 53].
Natural aging processes, such as UV radiation, mechanical abrasion, and chemical oxidation, often result in reduced crystallinity [54, 55], thereby diminishing thermal signals [56]. Additionally, manufacturing conditions and the presence of additives can also modify polymer crystallinity structures and affect enthalpy, resulting in reduced accuracy and sensitivity [57].
To explore how different manufacturing and aging histories affect quantification sensitivity, calibration curves were generated using micron-sized mixtures of PE, PP, PA6, and PET from the two sources of microplastics introduced earlier, PMP and aged-CMP, each spiked separately into the dBB matrix. As shown in Figure S4, the PMP set yielded the lowest calibration slopes, with PMP-PP being 59% less sensitive than CMP-PP. This reduction likely originated from broader, weaker melting peaks arising from lower crystallinity after manufacturing [58, 59]. Although the heat-cool-heat cycle (in non-isothermal crystallization) can partially restore crystallinity through recrystallization during cooling, this effect depends on polymer-specific kinetics that are difficult to control uniformly in mixed-plastic samples [28, 60]. Despite these challenges, MDSC retained good sensitivity in quantifying trace micron-sized plastics with varying aging and manufacturing history, by capturing weak transitions more effectively.
To evaluate the accuracy of MDSC for microplastics quantification, the measured mass from MDSC (mmeasure) was compared with the actual weighed mass (mtrue). Three mixtures—CMP, PMP, and aged-CMP (Table 1)—are each spiked into the dBB matrix at concentrations ranging from 0.03 to 1.11 mg per plastic, with 10 replicates per mixture (n = 10). Specifically, the mtrue values are obtained gravimetrically, while mmeasure values are determined by MDSC from melting peak areas and converted to mass using calibration curves. Comparisons between MDSC and gravimetric values are shown in Figure S5, and the mean absolute errors (MAE) are summarized in Table 2. The analytical recovery of MDSC quantification for PE, PP, PA6, and PET is presented in Fig. 3.
Fig. 3
Validation of quantification accuracy using CMP, PMP, and aged-CMP. Spike recoveries (%) of PE, PP, PA6, and PET measured by MDSC. Bars show mean recovery and error bars denote standard deviation (SD) of 10 independent spiked samples (n = 10).
Table 2 Deviation of MDSC-measured microplastic mass from theoretical values for CMP, PMP, and aged-CMP. Values are mean ± standard deviation over n = 10 independent spiked samples per mixtureAmong the four plastics, PE exhibited the closest agreement across all sources (Figure S5A), with MAE consistently below 0.03 mg, and recovery averaged at 102% (Table 2, Fig. 3). This likely reflects its favorable crystallization kinetics, resulting from a higher molecular weight and fewer branching points, which support the formation of a stable lattice structure and a better-defined thermal transition [61, 62]. Conversely, PP showed underestimations at higher masses (Figure S5B)––when PP was spiked more than 0.4 mg in the matrices––particularly notable in PMP-PP, with an MAE of 0.18 mg, and recovery of 72%. A similar underestimation trend was observed in PA6 and PET (Fig. 3 and Figure S5 C-D), which consistently exhibited underestimations across the entire mass range in PMP, with recovery of 76% and 59%, respectively.
Regarding the aging effect, oxidative aging treatment induced chemical changes in the aged-CMP-PE, PP, and PA6 compared to CMP, as presented in the Fourier-transform infrared spectroscopy with attenuated total reflectance (FTIR-ATR) spectra in Figure S6. In aged CMP-PP and -PA6, a carbonyl peak around 1720 cm−1 emerged, corresponding to C = O stretching and serving as a typical indicator of MPs oxidative aging [63, 64]. The spectral changes in aged-CMP-PE were more pronounced, with a new peak around 1200 cm−1 suggesting the formation of new interchain interactions among PE chains due to thermal aging [65]. Although the chemical characteristics changes have been observed in PE, PP, and PA6 in aged-CMP, the measurement errors of aged-CMP did not parallel the error increment seen in PMP, especially for PP and PET. Slight overestimations were noted for PP (MAE of 0.05 mg, recovery of 110%) and PA6 (MAE of 0.03 mg, recovery of 116%), which may be due to increased crystallinity after oxidation. Since the calibration is based on the reversing melting enthalpy, which is proportional to crystallinity, the higher crystallinity of aged plastics could explain the overestimation of quantification. This observation also aligns with previous reports that oxidized PP exhibits higher crystallinity than the unoxidized ones because chemical crystallization occurs during oxidation [66, 67]. Similarly, for PA6, the oxidation enhances crystallinity, as low-molecular-weight oxidation products promote crystallization at elevated temperatures [68].
Overall, CMP mixtures consistently achieved the highest accuracy, as determined by both MAE and recovery, followed by aged-CMP, with PMP showing the largest deviations. These discrepancies may arise from additives or contaminants introduced during manufacturing, which interfere with chain mobility and disrupt crystallization [69,70,71,72]. This trend suggests that both manufacturing and post-consumer modifications can complicate crystallinity and, in turn, the precision of MDSC quantification. While PMP was consistently underestimated, variations introduced by additives and contaminants are inevitable factors that could be present during the manufacturing process. Despite these challenges, this study establishes a foundation for applying MDSC in quantifying MPs and successfully demonstrates its efficacy and potential for more precise quantification across diverse types of plastics and sources.
Matrix interference in environmental samplesAlthough the second heating ramp is commonly used to minimize matrix interference [28, 29], this approach is not always suitable for measuring plastic mixtures within complex matrices. In some cases, matrix–polymer interactions prevent recrystallization, leading to inaccurate quantification or missing signals of plastics during the second heating. For example, PA6 in a CMP mixture spiked into artificial soil (AS) failed to show a melting peak during the second heating. In contrast, the same polymer in digested biosolid did (Figure S7), suggesting that the AS matrix suppresses recrystallization. A possible cause is interfacial interactions between kaolinite and PA6 (e.g., hydrogen bonding between kaolinite surface -OH groups and PA6 amide groups), which restrict chain mobility and thereby inhibit second-heat recrystallization of PA6 [73]. Such cases highlight the importance of evaluating the first heating profile. Considering matrix variability, understanding the matrix and incorporating it as a background when establishing calibration curves is essential.
Because matrix effects can influence thermal behavior during the second heating, ensuring a flat baseline during the first heating ramp is critical. To assess the impact of the matrix on MDSC quantification, CMP mixtures of PE, PP, PA6, and PET were spiked into raw biosolid and AS, and the samples were analyzed using both MDSC and conventional DSC. As shown in Fig. 4, the MDSC thermograms of the first heating ramp displayed smooth baselines and clearly identifiable peaks, compared with those of conventional DSC. This improvement stems from MDSC’s ability to distinguish between reversible polymer melting and irreversible matrix degradation, thereby minimizing matrix effects. With this capability, extensive sample pre-treatment can be reduced, streamlining processing while maintaining analytical accuracy.
Fig. 4
Comparison of DSC and MDSC thermograms for microplastic mixtures in matrices. Thermograms from the first heating ramp are shown for mixtures spiked into (A) artificial soil (AS) and (B) raw biosolids. Dashed lines indicate the baseline levels in MDSC, highlighting improved resolution and separation of polymer melting transitions compared with conventional DSC
Taken together, these findings underscore MDSC's capacity to address two persistent obstacles in the thermal analysis of MPs: weak transitions in low-crystallinity plastics and matrix interference in environmental samples. The technique provides a streamlined, robust approach for quantifying microplastics with diverse thermal properties across diverse matrices.
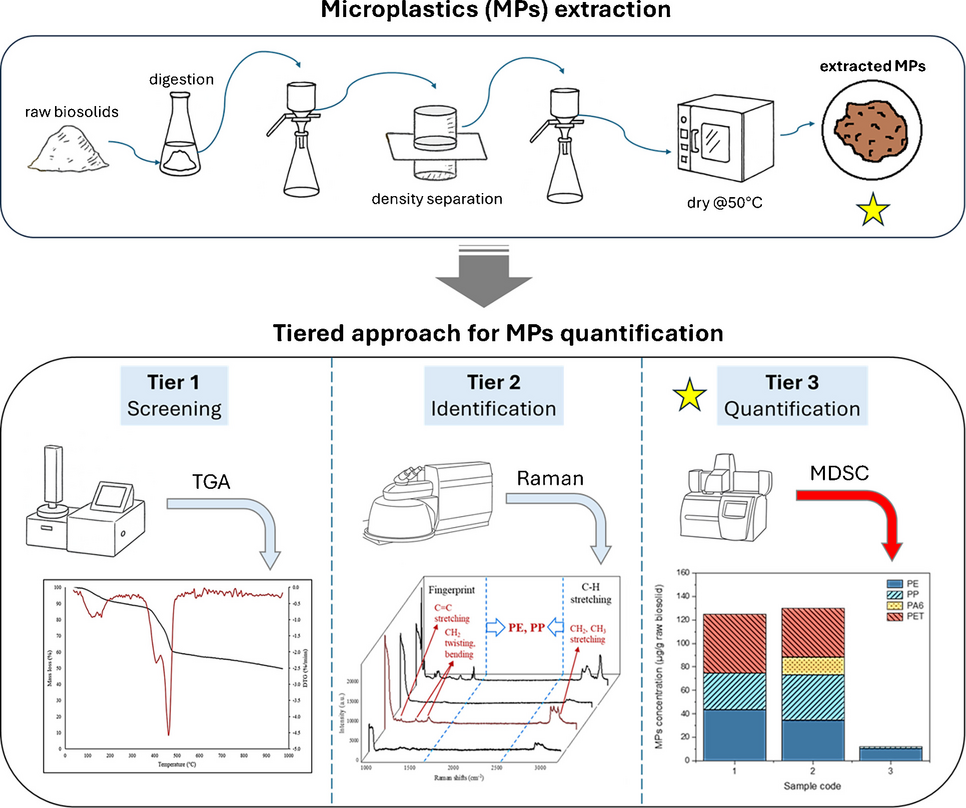
Practical strategy for MP identification and quantification: a tiered approachWhen analyzing environmental samples, the diverse and complex nature of MPs necessitates combining multiple analytical techniques for accurate characterization. Due to their varying sizes, shapes, and chemical compositions, relying on a single method often falls short of providing a comprehensive assessment [4, 74]. Recognizing these challenges, we propose a tiered approach to analyze MPs in environmental samples, integrating Raman and TGA as complementary techniques for MDSC identification and quantification.
Fig. 5
Tiered analytical workflow for microplastic (MP) analysis in biosolids. Samples are screened for polymer presence using TGA, followed by polymer type identification with Raman spectroscopy. Crystalline MPs are quantified by MDSC, while TGA provides total polymer content, enabling complementary and comprehensive characterization
Figure 5 illustrates the proposed workflow for MPs analysis in biosolids or soils. This approach begins with sample collection and separation of MPs. Initially, the presence of plastics in the samples is determined by TGA, which analyzes the degradation behavior within the typical polymer degradation temperature range (380–500 °C). Once the presence of polymers is confirmed, Raman spectroscopy is used to identify polymer types via characteristic vibrational modes that thermal methods alone cannot provide.
To determine which polymers are suitable for MDSC quantification, crystalline identity is assessed either through crystallinity-sensitive peaks in Raman spectra [75, 76], where applicable, or inferred from established material properties, since many common MPs such as PE, PP, and PET are semicrystalline under ambient conditions. Crystalline plastics can then be quantified individually using MDSC, which provides polymer-specific measurements even in the presence of complex matrix residues.
It is important to note that MDSC cannot reliably quantify amorphous plastics, such as polystyrene (PS), due to the overlap of glass transition signals with other thermal events and the lack of a sharp melting peak. In such cases, TGA and Raman are particularly valuable: TGA provides total polymer mass, including amorphous MPs [24, 30, 77], while Raman confirms their identity. This combination of MDSC and TGA could enhance understanding of MP analysis and address challenges in using MDSC to quantify non-crystalline plastics, particularly in multi-component MPs embedded in complex environmental matrices. Thus, the tiered approach leverages the strengths of each technique: MDSC resolves trace amounts of crystalline MPs with high sensitivity, Raman provides molecular specificity, and TGA complements the workflow by detecting amorphous or otherwise indistinguishable plastics.
Correlation experiments were conducted to assess the consistency and complementarity of TGA and MDSC in quantifying crystalline plastics. The CMP-dBB mixtures with PE, PP, PA6, and PET, in equal proportions of 4%, 10%, and 20% per polymer (16%, 40%, and 80% total CMP), demonstrated the complementarity of MDSC and TGA across the low–high concentration range. A 1:1 reference line was used as a benchmark to evaluate the correlation between the methods (Figure S8). At a higher mass ratio, MDSC and TGA agreed within 7% relative error. In contrast, at lower masses, the relative error increased to − 31% to − 55%, due to a broader thermal degradation range captured by TGA, which accounts for all types of polymer decompositions within 380–500 °C. At the same time, MDSC primarily resolves well-defined thermal transitions. Additionally, matrix interference could contribute to the overestimation of TGA, potentially amplifying the discrepancy between MDSC and TGA results. Overall, this validates the use of TGA as a complementary technique to MDSC for comprehensive analysis of MPs.
By explicitly combining MDSC, Raman, and TGA, this tiered approach accounts for both crystalline and amorphous plastics, compensates for matrix and aging effects, and provides a more robust and reliable workflow for quantifying MPs in complex environmental matrices [78, 79].
Application of MDSC quantifying microplastics in biosolidsTo advance the quantification of MPs in real-world biosolids, a tiered approach incorporated with MDSC was applied to analyze MPs extracted from three raw biosolids collected from different WWTPs. While MDSC is inherently less sensitive to matrix interferences than spectroscopic methods, extraction by digestion (to remove large amounts of cellulose that can hinder polymer identification) and density separation (to eliminate higher-density matter) further simplify the sample and provide a more consistent basis for accurate quantification.
Thermal decomposition profiles of the extracted biosolid, as determined by TGA measurements (Figure S9), revealed contributions from organic matter (200–400 °C), cellulose (300–400 °C), polymer decomposition (380–500 °C), and inorganics (> 500 °C). In Sample 1, a broad degradation peak spanning 250 °C to 550 °C, including a strong feature at 455 °C, suggested plastic degradation but overlapped with other components (Table S2), mak
Comments (0)