
Remember me
The research performed in this study complied with all relevant ethical regulations. All mouse experiments were approved by the Memorial Sloan Kettering Cancer Center (MSKCC) Institutional Animal Care and Use Committee (IACUC) (protocol 11-06-018). Archival human specimens were procured under a biospecimen research protocol approved by the MSKCC Institutional Review Board (protocol 22-159). All participants provided preprocedure written informed consent.
Animals and in vivo proceduresAnimal careMice were maintained under pathogen-free conditions, housed on a 12-h light–dark cycle under ambient temperature of 18–24 °C and 40–60% humidity. Food and water were provided ad libitum. GEMMs were generated in house. Foxn1nu (athymic nude) mice used for transplants were purchased from Envigo or The Jackson Laboratory. In all experiments, tumors did not exceed a maximum volume corresponding to 10% of the mouse’s body weight (typically 1 cm3), as per IACUC guidelines.
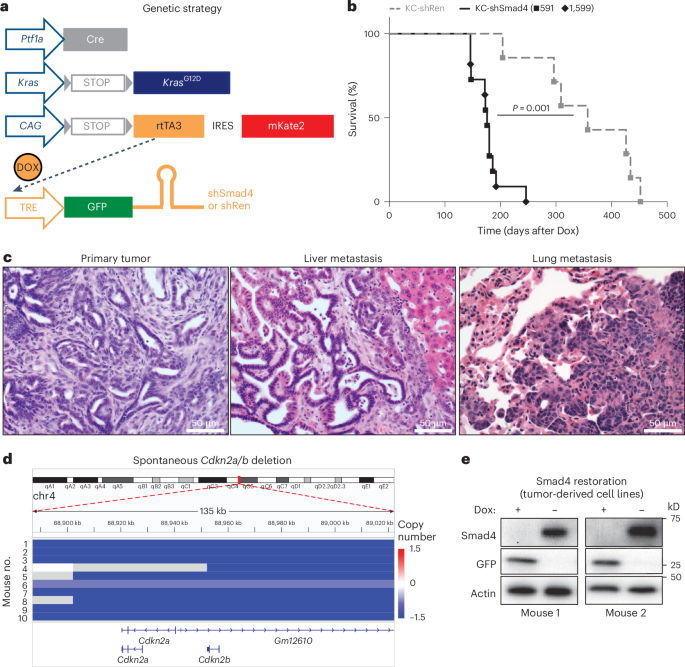
GEMMsPtf1aCre/+;LSL-KrasG12D/+;Rosa26LSL-rtTA3-IRES-mKate2/+(RIK);Col1a1shRNA-Homing-Cassette/+(CHC) male embryonic stem cells (ES cells (C57BL/6J;129 mixed background) were targeted with two independent GFP-linked Smad4 shRNAs (shSmad4.591, CAAAGATGAATTGGATTCTTT; shSmad4.1599, ACAGTTGGAATGTAAAGGTGA) cloned into miR30-based targeting constructs, as previously described61. The KC-shRen control ES cell clone was previously reported61. Mice were generated by eight-cell or blastocyst injection of ES cells and shRNAs were induced by treatment of the resulting mice with Dox (625 mg kg−1; Envigo) in the chow starting at 5–6 weeks of age. To examine the effects of tissue injury and Smad4 depletion on the premalignant pancreas, 8-week-old KC-shRen and KC-shSmad4 mice were treated with cerulein (80 μg kg−1, intraperitoneally; Bachem) or phosphate-buffered saline (PBS) by 8 hourly injections on two consecutive days. The identity of the ES cells and corresponding mice was authenticated by genomic PCR using a common Col1a1 primer paired with an shRNA-specific primer (Supplementary Table 5), all yielding ~250-bp products.
Orthotopic transplantation assaysMouse hosts were placed on Dox chow 5–7 days before transplantation. Mice were anesthetized and a survival surgery was performed to expose the pancreas. A total of 1 × 10⁵ tumor-derived cells were resuspended in 25 μl of 1:1 DMEM (Gibco) and Matrigel (Corning) and injected in the tail of the pancreas of each mouse. Tumor engraftment and progression were monitored by palpation and ultrasound imaging. Where applicable, Dox withdrawal was performed 4 weeks after injection (corresponding to a 3–5-mm tumor diameter) by switching the food source to regular chow. At the experimental endpoint, primary tumors, livers and lungs were dissected and imaged under a dissection microscope for brightfield, mKate and GFP fluorescence (Nikon SMZ1500 with NIS-Element version 3.0 software). Liver and lung metastasis burden was measured by calculating the percentage tumor area (mKate+) as a fraction of overall organ area. Mice were killed upon reaching experimental or humane endpoints according to IACUC guidelines. All mice used were 6–8-week-old Foxn1nu females.
Experimental metastasis assaysFor liver metastasis assays, mice were anesthetized and a survival surgery was performed to expose the spleen. A total of 4 × 10⁵ tumor-derived cells resuspended in 20 μl of PBS were injected in the splenic parenchyma of each mouse, followed by removal of the spleen and cauterization (splenectomy). Tumor engraftment and progression were monitored by palpation and ultrasound imaging. At experimental endpoint, livers were dissected and imaged under a dissection microscope for brightfield, mKate and GFP fluorescence (Nikon SMZ1500 with NIS-Element version 3.0 software). Liver metastasis burden was measured by calculating the percentage tumor area (mKate+) as a fraction of overall organ area. For lung metastasis assays, mice were temporarily restrained and 2.5 × 10⁵ tumor-derived cells resuspended in 250 μl of PBS were injected in the tail vein of each mouse. Bioluminescence imaging was used to monitor tumor engraftment and progression and measure tumor burden. Where applicable, Dox withdrawal was performed 5 weeks (intrasplenic) or 6 weeks (tail vein) after injection (unless noted otherwise) by switching the food source to regular chow. Mice that developed tumors outside of the respective target organs were excluded from the analysis. Mice were killed upon reaching experimental or humane endpoints according to IACUC guidelines. All mice used were 6–8-week-old Foxn1nu females.
Animal imagingFor ultrasound, mice were anesthetized and high-contrast ultrasound imaging was performed on a Vevo 2100 System with a MS250 13–24-MHz scanhead (VisualSonics). Images were acquired and tumor volume was measured using the Vevo LAB software (version 3.2; VisualSonics). For bioluminescence, mice were injected with luciferin (5 mg per mouse, intraperitoneally or retro-orbitally; Gold Technologies), anesthetized for 10 min and then imaged on a IVIS Spectrum imager (Perkin Elmer). Images were acquired and bioluminescence signal was measured using the Living Image software (version 4.5; Perkin Elmer).
Analysis of early metastatic colonizationA total of 1 × 10⁵ cells were resuspended in 100 μl of PBS and injected into the right cardiac ventricle of anesthetized mice with a 26G-needle syringe. Successful inoculation of luciferase-transduced cells was verified by bioluminescence imaging immediately after injection. After 7 days, mice were injected with luciferin (5 mg per mouse, retro-orbitally; Gold Technologies) and killed; their livers and lungs were isolated in PBS and immediately imaged ex vivo using the IVIS Spectrum imager and Living Image software (version 4.5; Perkin Elmer).
Histological, IHC and immunofluorescence (IF) analysesTissues were fixed in 10% neutral buffered formalin overnight (Fisher Scientific, 22-050-105), paraffin-embedded and sectioned at 5-μm thickness. Hematoxylin and eosin (H&E) staining was performed using standard protocols. For immunostaining, slides were incubated at 55 °C for 30 min, deparaffinized and rehydrated. Antigen retrieval was performed using citrate buffer (Vector Laboratories, H-3300) in a pressure cooker for 25 min. Sections were treated with 3% H2O2 for 10 min and washed in deionized water (for IHC only), then washed in PBS and blocked in 5% BSA in PBS with 0.1% Triton X-100. Primary antibody incubation was performed at 4 °C overnight in blocking buffer. Primary antibodies were to SMAD4 (clone EP618Y, Millipore, 04-1033; 1:200, IHC), pSMAD2 (clone 138D4, Cell Signaling, 3108; 1:100, IHC), p57 (Atlas Antibodies, HPA002924; 1:500, IHC), KLF4 (Abcepta, AM2725A; 1:100, IHC), KLF5 (Abcam, ab137676; 1:500, IHC), KLF6 (Abcam, ab241385; 1:1,000, IHC), RUNX1 (clone D4A6, Cell Signaling, 8529; 1:500, IHC), RUNX2 (clone D1L7F, Cell Signaling, 12556; 1:500, IHC), RUNX3 (clone 2B3, Life Technologies, MA5-17169; 1:500, IHC), mKate2 (Evrogen, AB233; 1:1,000, IF), Ki67 (clone B56, BD Pharmingen, 550609; 1:200, IF) and α-SMA (clone 1A4, Sigma, A2547; 1:1,000, IF).
For IHC, horseradish peroxidase (HRP)-conjugated secondary antibodies (ImmPRESS kits, Vector Laboratories, MP7401 and #MP2400) were applied for 30–60 min at room temperature, followed by incubation with DAB substrate (ImmPACT kit, Vector Laboratories, SK-4105). Tissues were then stained with hematoxylin, dehydrated and mounted using Permount (Fisher Scientific, SP15-100). For IF, secondary Alexa Fluor 488 (A-21202) or 594 (A-21207) dye-conjugated antibodies (Life Technologies, 1:500) were applied for 60 min at room temperature. Tissues were then stained with DAPI and mounted using Prolong Gold (Invitrogen, P36930).
Image acquisition was performed on a Zeiss AxioImager microscope equipped with an ORCA/ER charge-coupled device camera (Hamamatsu Photonics) and ZEN software (version 3.3; Zeiss). For pSMAD2 and p57 quantifications, the number of pSMAD2+ or p57+ cells per randomly chosen IHC-stained ×40 fields of view in a tumor region was manually counted. For Ki67 and α-SMA quantification, random ×20 fields of view costained for mKate2 were analyzed. mKate2+ areas were selected and then (1) the corresponding Ki67+ cells were counted and calculated as a percentage of DAPI+ cells or (2) the corresponding α-SMA+ area was measured and calculated as a percentage of the mKate2+ area. Image analyses were performed using ImageJ/FIJI (National Institutes of Health (NIH)).
CloningES cell-targeting plasmids were generated as described above. The firefly luciferase reporter plasmid (pMSCV-Luc2-Blast) was generated by subcloning Luc2 from the pCDH-EF1-Luc2-P2A-tdTomato plasmid into the pMSCV-Blasticidin retroviral vector at the BglII–HpaI restriction sites with the inclusion of a Kozak sequence (GCCACC) upstream of the ATG start codon, using standard protocols. Constitutive Renilla, Cdkn1c (p57), Klf4 and Runx1 shRNAs were cloned in the pMSCV-mirE-SV40-Neomycin-BFP retroviral vector62 at the XhoI–EcoRI restriction sites, using standard protocols. pCDH-EF1-Luc2-P2A-tdTomato was a gift from K. Oka (Addgene, 72486). pMSCV-Blasticidin was a gift from D. Mu (Addgene, 75085)63. All plasmids were authenticated by test digestion and Sanger sequencing. The following shRNA sequences were used:
Ren, 5′-GCAGGAATTATAATGCTTATC-3′
p57 (Cdkn1c), 5′-TGGTAATAATCAATAACCCAG-3′
Klf4, 5′-TATAAAAATAGACAATCAGCA-3′
Runx1, 5′-AAATCAGAAGCATTCACAGTT-3′
Cell cultureAll cells were maintained in a humidified incubator at 37 °C with 5% CO2.
Primary cell line derivationCell lines were generated from tumor-bearing pancreata, livers or lungs of KC-shSmad4 or KC-shRen mice. Tumors were dissected, chopped with razor blades and digested with 1 mg ml−1 collagenase V (Sigma-Aldrich) diluted in HBSS for 30–60 min, followed by 0.25% trypsin for 5–10 min. Digested tissues were washed with complete DMEM (DMEM, 10% FBS (Gibco) and 1× penicillin–streptomycin), passed through a 100-μm filter and cultured in complete DMEM on collagen-coated plates (0.1 mg ml−1 PureCol, Advanced Biomatrix) supplemented with 1 μg ml−1 Dox at 37 °C. Cells were passaged at least five times to eliminate any nontumor cells before using them in experiments. Primary cultures were authenticated by flow cytometry of engineered fluorescence alleles. All cultures were tested negative for Mycoplasma.
Virus generation and transductionFor stable transduction of firefly luciferase and constitutive shRNA constructs, VSV-G pseudotyped retroviral supernatants were generated from transduced Phoenix-GP packaging cells and infections were performed as described elsewhere21. Infected cells were selected with 10 μg ml−1 Blasticidin for 5 days or 800 μg ml−1 G418 for 7 days, depending on the selection marker. Luciferase expression was confirmed by in vitro and in vivo bioluminescence. Knockdowns were confirmed by western blot using standard procedures and antibodies to SMAD4 (clone B-8, Santa Cruz, sc-7966; 1:500), GFP (clone D5.1, Cell Signaling, 2956; 1:1,000), p57 (Atlas, HPA002924; 1:1,000), KLF4 (Abcepta, AM2725A; 1:1,000), RUNX1 (Cell Signaling, 8529; 1:1,000) and actin–HRP (clone AC-15, Sigma, A3854; 1:20,000).
Proliferation assaysFor ‘+Dox’ conditions, cells were cultured under continuous Dox treatment (1 μg ml−1). For ‘−Dox’ conditions, cells were cultured in the absence of Dox for 5 days before the start of the experiment (day 0). On day 0, 12.5 × 10³ cells were plated on collagen-coated 24-well plates, in the presence or absence of 100 pM recombinant mouse TGFβ1 (R&D Systems, 7666-MB-005). Cells were counted every 3 days (that is, on days 3, 6 and 9) using a Guava easyCyte instrument (EMD Millipore) and replated at a 1:25 ratio to enable continuous culture.
Samples for RNA-seq analysisThe +Dox (Smad4 off) and −Dox (Smad4 on) cells were prepared as described immediately above. Then, 24 h after plating, cells were treated with either recombinant mouse TGFβ1 (100 pM; R&D Systems, 7666-MB-005) or TGFβ inhibitor SB505124 (2.5 µM; Sigma, S4696). Cells were harvested after 24 h of treatment.
Tumor cell isolationFor in vivo RNA-seq, ATAC-seq and scMultiomics, tumor cells were freshly isolated from pancreata, livers or lungs of KC-shSmad4 mice by FACS. For in vitro RNA-seq and ATAC-seq, cells were harvested by trypsinization. For scRNA-seq of premalignant tissue, cells were freshly isolated from non-tumor-bearing KC-shRen and KC-shSmad4 pancreata by FACS after 48 h of cerulein or PBS treatment. Specifically, dissected tumors or premalignant pancreata were chopped and incubated in the following digestion buffer: 1 mg ml−1 collagenase V (Sigma, C9263), 2 U per ml Dispase II (Gibco, 17105041), 0.1 mg ml−1 DNase I (Sigma, DN25) and 0.1 mg ml−1 soybean trypsin inhibitor (STI; Sigma, T9003) in Mg2+/Ca2+-containing HBSS (Gibco, 14025076). Digestion was performed using the gentleMACS Octo dissociator (Miltenyi) for 42 min at 37 °C, followed by a PBS wash and an additional digestion with 0.05% trypsin–EDTA (Gibco, 15400) for 5 min at 37 °C. Samples were then treated with FACS buffer (2% FBS, 10 mM EGTA, 0.1 mg ml−1 DNase I and 0.1 mg ml−1 STI in PBS) to neutralize trypsin and then RBC lysis buffer (Invitrogen #00-4333-57) for 5 min at 20–25 °C, washed with FACS buffer (+DNase I/STI) and passed through a 100-μm strainer. Finally, these cells were resuspended in FACS buffer (+DNase I, STI and 300 nM DAPI) and filtered through a 40-μm strainer. Cells sorting was performed on MA900 (Sony), BD FACSAria I or BD FACSAria III (Becton Dickinson) instruments (gating scheme in Supplementary Fig. 1). For RNA-seq, cells were collected directly into TRIzol LS (Invitrogen, 10296028); for ATAC-seq, cells were collected in 2% FBS in PBS. For in vitro ATAC-seq, cell lines were harvested by trypsinization and sorted to yield identical number of cells for analysis as for the in vivo ATAC-seq.
sWGSGenomic DNA was freshly isolated and sWGS was performed essentially as previously described64. Libraries were sequenced on an Illumina HiSeq 4000 instrument. After mapping to the mouse genome and removal of duplicates, ~2.5 million reads were analyzed using the Varbin algorithm65.
Bulk RNA-seqRNA isolation, library preparation and sequencingRNA was isolated using TRIzol LS (Invitrogen, 10296028) and column cleanup with an RNeasy kit (Qiagen, 74106). Following quantification (Nanodrop) and quality assessment (Agilent 2100 BioAnalyzer), 100–500 ng of RNA was selected using poly(A) and used for library preparation according to the manufacturer’s protocol (Illumina, 20020595), with 15 cycles of PCR. Samples were barcoded and subjected to a 75-bp single-end run on a HiSeq 4000 (Illumina) instrument, averaging ~50 million reads per sample.
RNA-seq read mapping, differential expression analysis and data visualizationAdaptor sequences were removed using Trimmomatic66. Reads were then aligned to GRCm38.91 (mm10) with STAR67 and transcripts were quantified with featureCounts68 to generate the raw count matrix. Differential gene expression and principal component analysis (PCA) were performed using the DESeq2 package69. DEGs were defined by a fold change > 2 with Benjamini–Hochberg-adjusted P value < 0.05. For heat map visualization, samples were normalized by z score and plotted with the ‘pheatmap’ package. For in vitro RNA-seq, DEGs were defined by intersecting upregulated genes after 24 h for −Dox versus +Dox in cells treated with TGFβ1 or SB505124 and removing overlapping genes to define SMAD4-dependent DEGs11.
Functional annotations of gene setsPathway enrichment analysis was performed using enrichR70. Significance was assessed using combined score, described as c = log(P) × z, where P is Fisher’s exact test P value and z is the z score for deviation from the expected rank, and adjusted P values. Combined scores of top enriched pathways from the ‘Kyoto Encyclopedia of Genes and Genomes (KEGG) 2019 Mouse’ database were compared between our in vitro (24 h) and in vivo (7 + 14 days combined) samples and Pearson correlation was used to assess significance.
Intersection of RNA-seq and ChIP-seq dataTwo publicly available ChIP-seq datasets were used11,24. First, SMAD4-dependent SMAD2/3 ChIP-seq peaks that were significantly enriched in both studies (P < 10−8 and >8-fold enrichment of ChIP signal) were extracted. These peaks were then associated with genes on the basis of UCSC.mm10.knownGene using ChIPseeker71; they were analyzed for genic location (annotatePeaks) and the nearest transcription start site (TSS) was used to annotate the peak to that gene. The resulting gene list was intersected with SMAD4-dependent DEGs in the present study. The log2 fold change between Smad4 on and off in each organ was plotted and the type of genomic binding region was color-annotated.
Bulk ATAC-seqCell preparation, transposition, library construction and sequencingA total of 60,000 mKate2+ cells were FACS-isolated, washed with 50 μl of cold PBS, resuspended in 50 μl of cold lysis buffer72 and centrifuged for 10 min at 500g at 4 °C. The nuclear pellet was treated with Nextera Tn5 transposase for 30 min at 37 °C with shaking at 1,000 rpm according to the manufacturer’s protocol (Illumina, FC-121–1030). Transposed DNA was isolated using the DNA clean and concentrator kit (Zymo Research, D4013). Libraries were prepared with the NEBNext high-fidelity 2× PCR master mix (New England Biolabs, M0541). Library quality was assessed with the Bioanalyzer high-sensitivity DNA analysis kit (Agilent). Samples were subjected to a 150-bp paired-end run on a HiSeq 4000 (Illumina) instrument, averaging ~50 million reads per sample.
Mapping, peak calling and dynamic peak callingFASTQ files were trimmed with trimGalore and cutadapt73, the filtered reads were aligned to mm10 with Bowtie2 (ref. 74) and peaks were called using MACS2 (ref. 75) and only kept for analysis if their P value was ≤0.001 and they were not on the ENCODE blacklist. To build a peak atlas, all peaks within 500 bp were combined, the mapped reads for each sample were quantified using featureCounts68 and normalization was performed using DESeq2 (ref. 69). Samples were normalized to 10 × 106 mapped reads for comparison to DepthNorm. The normalization factors from DESeq2 (ref. 76) and BEDTools genomeCoverageBed77 were used to create normalized bigWig files. Dynamic ATAC peaks were called if they had an absolute log2 fold change ≥ 0.58 and false discovery rate (FDR) ≤ 0.1.
ATAC-seq heat map clusteringThe dynamic peaks determined by comparing pancreas, liver and lung ± Dox (Smad4 off and on) were clustered using z scores and k-means clustering (k = 4 or 5) and plotted with ComplexHeatmap78.
TF motif enrichment analysesMotif enrichment analysis was performed on differentially expressed ATAC peaks between liver and lung with the HOMER de novo motif discovery tool79 using the findMotifsGenome command with the parameters ‘size = given’ and ‘length = 8–12’. Motif enrichment scores were calculated for ATAC gain or loss regions between liver and lung ± Dox (Smad4 off and on) by applying the findMotifsGenome command with ‘size = given’ and ‘length = 8–12’ in each peak set.
Integration of ATAC-seq and RNA-seq dataFor each organ, differential gene expression analysis between −Dox and +Dox was first performed individually (pancreas, liver or lungs). Next, the resulting gene lists were intersected to identify organ-specific Smad4-responsive targets. EnrichR70 was used to calculate enrichment scores for annotated TF targets using the ChEA_2016 database. RNA score was defined as the −log10(adjusted P value). Separately, HOMER was used to compare ATAC-seq data between Liver (+Dox) and Lung (+Dox) samples to identify differentially expressed peaks (DEPs). Custom TF motifs were curated by combining all the pairwise +Dox comparisons between any two organs and these motifs were then used to reannotate the DEPs to get consistent enrichment scores across known TFs. ATAC-score was defined as the −log10(P value). Finally, combined scores were calculated by multiplying the respective RNA and ATAC scores. To determine the net change in ATAC and RNA combined scores for KLF and RUNX in the pancreas, each TF’s combined score was calculated for each Dox condition, followed by subtraction of the +Dox from the −Dox score.
Single-cell sequencingATAC-seq cell preparation, transposition, library construction and sequencingThe 10x Genomics Chromium Next GEM single-cell multiome reagent kit A (1000282) and ATAC kit A (1000280) were used according to the manufacturer’s protocol ‘nuclei isolation for single-cell multiome ATAC + gene expression sequencing’. In brief, cells (95% viability) were lysed for 4 min and resuspended in nuclei buffer (PN-2000207). Lysis efficiency and nucleus concentration were evaluated by trypan blue and DAPI staining (Countess II, Life Technologies). A total of 11,000 nuclei per transposition reaction were loaded, targeting the recovery of 7,000 nuclei after sequencing. Nuclei were encapsulated and barcoded; libraries were constructed following the manufacturer’s instructions and sequenced on an Illumina NovaSeq 6000 instrument.
Quality control and cell filteringFor scMultiomics (ATAC-seq + RNA-seq), nucleosome signal and TSS enrichment scores were computed. Retention criteria for individual cells were as follows: TSS enrichment score > 0.3, nucleosome signal score < 1.5, total ATAC-seq counts = 1,000–200,000 (based on the 10x Cell Ranger ATAC-seq count matrix) and total RNA counts = 1,000–50,000.
RNA-seq cell preparation, library construction and sequencingThe 10x Genomics Chromium instrument was used according to the manufacturer’s scRNA-seq protocol for 3′ v2. In brief, cells (>80% viability by trypan blue) were captured in droplets and subjected to reverse transcription and cell barcoding. Emulsions were broken and complementary DNA was purified with Dynabeads MyOne SILANE (Life Technologies) and PCR-amplified per the manufacturer’s instructions. The target cell number was ~5,000 per sample. Libraries were sequenced on Illumina NovaSeq 6000 S4 (R1, 28 cycles; i7, 8 cycles; R2, 90 cycles).
scRNA-seq data preprocessing and cell annotationFor both scMultiomics and scRNA-seq, gene expression UMI count data were normalized using SCTransform, percentage mitochondrial RNA content was regressed out and PCA was performed on the SCTransform Pearson residual matrix using the RunPCA function in Seurat80,81. Nearest neighbors were identified using FindNeighbors with dims = 1:30. The R package BBKNN was used to remove batch effects between samples and cell types were annotated using R packages celldex, SingleR and Azimuth with custom gene sets80,81. Only cells annotated as ductal or acinar were retained for downstream analysis.
scATAC-seq data preprocessingscATAC-seq peaks were identified using MACS2 (ref. 75) with default parameters. Peak calling was performed using the CallPeaks function in Signac. Peaks overlapping annotated genomic blacklist regions for the mm10 genome were removed. Counts for the resulting peak set were quantified for each cell using the FeatureMatrix function in Signac. For scATAC-seq analysis, data were normalized using the RunTFIDF function and the top features were identified using FindTopFeatures with min.cutoff = ‘10’. The RunSVD function was used to create the linear selection index (LSI) space and the resulting visualization was generated with uniform manifold approximation and projection (UMAP) using dims = 2:30. Clusters were identified using the ‘algorithm = 3’ option.
Mapping of bulk ATAC-seq signaturesDEPs from bulk ATAC-seq were used to overlap with accessible peaks from scATAC-seq using intersectbed from BEDTools77. Peaks with at least 1-bp overlaps were kept and the top 5,000 scATAC-seq peaks sorted on the basis of significance were used to calculate ATAC signature scores using AddChromatinModule from Signac. LiverOPEN and LungOPEN cells were identified on the basis of the signature score and mutual exclusivity was calculated using the chi-squared test.
Differential gene expression of scRNA-seq dataFindMarkers function from Seurat80,81 with ‘min.pct = 0.1’ was used to identify DEGs in scRNA-seq data between LiverOPEN and LungOPEN cells defined on the basis of their matching scATAC-seq data. These DEGs were used for calculating gene signature scores for human PDAC scRNA-seq data using the AddModuleScore function from Seurat. Pathway enrichment analysis was also performed using these DEGs in enrichR70 with annotated pathways in the ‘KEGG 2019 Mouse’ database. Significance was assessed using combined scores and a lollipop plot was used to represent liver-enriched and lung-enriched pathways. To annotate premalignant cell types (gastric-like, progenitor-like, ADM, tuft and neuroendocrine), gene signatures were derived as follows. First, diffxpy (version 0.7.4, https://github.com/theislab/diffxpy) was used to conduct pairwise differential gene expression between established premalignant subpopulations36, using the Wald test with total counts per cell as a numeric covariate. Upregulated genes in each pairwise comparison were defined as those with q < 0.05 and log2 fold change > 1, excluding genes with mean expression < 0.05. A gene signature for a given subpopulation was defined as the set of genes that was upregulated in such subpopulation in every pairwise comparison against all other subpopulations.
Milo analysis of scRNA-seq dataA k-nearest-neighbor graph (k = 30) was constructed on the basis of the first 30 principal components using the buildGraph function in Milo82. Neighborhoods were identified with the makeNhoods function (prop = 0.1, refined = TRUE). Default parameters were applied for countCells, testNhoods and calcNhoodDistance to calculate statistical significance and apply spatial FDR correction. Visualization was performed using plotNhoodGraphDA (α = 0.1).
Public scATAC-seq analysisscATAC-seq data35 were retrieved from the Gene Expression Omnibus (GEO; GSE137069). Cells were kept using filters ‘min.cells > 10, min.features < 200’. Peaks that overlap with annotated genomic blacklist regions for the mm10 genome were identified. Cells were then retained using filters ‘peak_region_fragments > 3,000, peak_region_fragments < 20,000, pct_reads_in_peaks > 15, blacklist_ratio < 0.05, nucleosome_signal < 4, TSS.enrichment > 2’. Data were normalized using the RunTFIDF function and the top features were identified using FindTopFeatures. We used the RunSVD function to create the LSI space and the resulting visualization was generated with UMAP using dims = 2:30. Clusters were identified using the following options: ‘algorithm = 3’ and ‘resolution = 0.5’. GeneActivity from Signac was used to derive an approximate gene activity matrix and custom gene signatures were used to annotate cell types. Ductal and acinar cells were retained for downstream analysis. Differentially accessible peaks from bulk ATAC-seq were used to intersect with accessible peaks from scATAC-seq using intersectbed from BEDTools77. Peaks with at least 1-bp overlap were kept and the top 5,000 scATAC-seq peaks sorted on the basis of significance were used to calculate ATAC signature scores using AddChromatinModule from Signac.
Human PDAC analysisMetastasis recurrence analysisPreviously reported data25,26 were reanalyzed by site of recurrence (liver or lungs) and annotation of SMAD4 IHC status (positive or negative).
MSK-IMPACT analysisHuman datasets were obtained through the MSK Clinical Sequencing Cohort (MSK-IMPACT) using cBioPortal83,84. Samples were selected as follows: cancer type, pancreatic cancer; cancer type detailed, PDAC; genotype, SMAD4: MUT HOMDEL. Comparison of genomic annotations between SMAD4-altered and unaltered samples, along with corresponding statistical analyses, were generated and visualized using the cBioPortal.
Bulk transcriptomic analysisMicroarray data40 were retrieved from the GEO (GSE71729). First, we compared liver or lung metastasis samples to primary tumor samples to derive liver or lung metastasis-specific DEGs. Second, we performed analogous comparison of normal liver or lung versus normal pancreas samples. The tumor and normal gene sets were then intersected to identify liver and lung tumor-specific signatures by filtering out DEGs in the normal organs. Pathway enrichment analysis was performed on the resulting organ-specific or tumor-specific gene sets using enrichR70 and the top enriched TFs were plotted using combined scores in bar plot format.
scRNA-seq analysisscRNA-seq data37 were retrieved from the GEO (GSE155698). Cells were retained using filters ‘min.cells > 100, nFeature_RNA > 500, nCount_RNA > 2,500, percent.mt < 25’. SCTransform was used to regress out the percentage of mitochondrial RNA and nearest neighbors were found using FindNeighbors with dims = 1:30. Clusters were identified using resolution = 0.8 and cell types were annotated using R packages celldex, SingleR and Azimuth with custom gene sets80,81. Only ductal and acinar cells were retained for calculating gene signature scores from our mouse multiomic data using AddModuleScore from Seurat80,81. FeaturePlot was used to visualize the differential peak openings from our mouse LiverOPEN and LungOPEN ATAC signatures, as well as gene signatures for gastric-like and progenitor-like cells from previously published datasets36. The Pearson correlation coefficient was used to quantify the relationship between these signature scores.
IHC analysisBiopsied or surgically resected primary tumors, liver and lung metastases from 17 PDAC patients were obtained under a biospecimen research protocol approved by the MSKCC Institutional Review Board (protocol 22-159). All participants provided preprocedure informed consent. Participants were not compensated. Participants were both male and female, with an age range of 55–82 years at recruitment. Archival formalin-fixed, paraffin-embedded clinical tissue blocks were identified by database search and chart review and procurement was overseen by an expert pathologist (U.B.). IHC staining was performed as described above and signal intensity was estimated on a scale of 0 to 5 (none to strongest signal).
Statistics and reproducibilityStatistical analyses were performed with GraphPad Prism (version 9), R (version 4.3.1) and Python (version 3.6.4). Sample size, error bars, statistical methods and exact P values are reported in each figure and/or associated legend. No statistical methods were used to predetermine sample sizes but our sample sizes are similar to those reported in previous publications21,35,36. No data were excluded from the analysis, unless specifically noted. For Smad4 restoration experiments, mice were randomized into +Dox versus −Dox groups. For IHC and IF experiments, random fields of view were used for quantification as described above. The other experiments were not randomized. The investigators were not blinded to allocation during experiments and outcome assessment, unless specifically noted. For pairwise comparisons, the Kolmogorov–Smirnov test was used to compare distributions and determine the appropriate test for comparison of means or medians (t-test or Mann–Whitney U-test). For other analyses, data distribution was assumed to be normal but this was not formally tested.
Reporting summaryFurther information on research design is available in the Nature Portfolio Reporting Summary linked to this article.
Comments (0)