
Remember me
The research complied with all relevant ethical regulations. Primary samples were collected at Skåne University Hospital after written informed consent from participants and in accordance with the Declaration of Helsinki. Experiments with primary leukemia samples were approved by the Swedish Ethical Review Authority (DNR 2023-01550). Aspects of the study involving research animals were conducted in accordance with local ethical regulations and approved by the regional Animal Ethics Committee of Malmö/Lund (7071/2020).
Primary cells and cell linesBone marrow aspirates and peripheral blood samples were collected from healthy controls and participants with AML or myelodysplastic syndrome. Sample sizes were not predetermined by statistical methods but chosen on the basis of sample availability. Healthy bone marrow donors received modest financial compensation. No other compensation was awarded for study participation. Mononuclear cells were isolated by gradient separation using Lymphoprep (GE Healthcare) and viably frozen. Genetic profiling was performed by whole-exome sequencing and RNA-seq as previously described45. Cases were genetically classified according to the European LeukemiaNet (ELN) 2022 (ref. 65), International Consensus Classification (ICC) 2022 (ref. 66) and World Health Organization 2022 (ref. 67) guidelines as part of standard clinical practice, based on targeted sequencing. Participants included in the study and their clinical characteristics are shown in Supplementary Table 1. Primary leukemia samples were collected from both male and female participants to allow for equitable implementation of clinically relevant findings. The CMK, KG-1, HNT-34, K562, MonoMac6, NB4, OCI-AML3, TF-1 and THP-1 cell lines (Leibniz Institute German Collection of Microorganisms and Cell Cultures (DSMZ)) were cultured in RPMI medium (Thermo Fisher) with penicillin–streptomycin (Cytiva) and varying concentrations of FBS (Cytiva) and granulocyte-macrophage colony-stimulating factor (GM-CSF; Peprotech) according to the provider’s recommendations. T cells transduced with NY-ESO were cultured in AIM V medium (Thermo Fisher) with 10% FBS (Cytiva), 10 mM HEPES (Thermo Fisher), 1 mM sodium pyruvate (Thermo Fisher), penicillin–streptomycin (Cytiva) and 30 U per ml recombinant human interleukin 2 (hIL-2; R&D Systems). All cell lines were authenticated by genotyping, last performed in July 2024 (Eurofins Scientific).
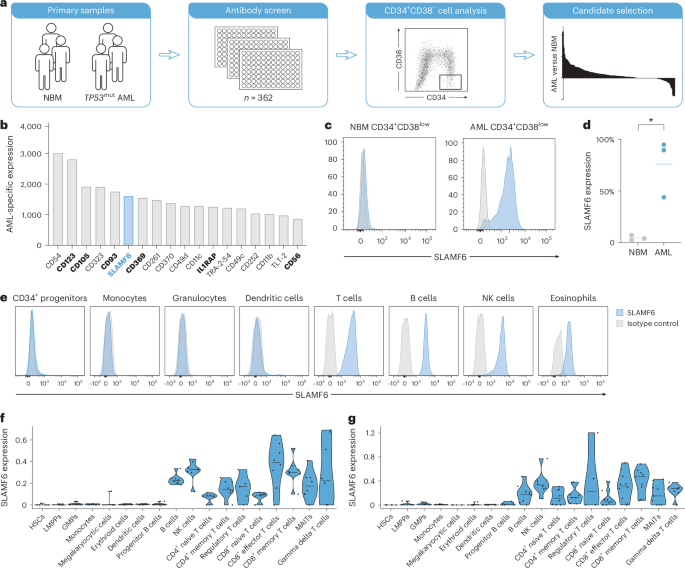
Cell surface marker screenAn arrayed antibody screen with 362 PE-conjugated antibodies (Supplementary Table 2) was performed using the LEGENDScreen platform (BioLegend, 700011). The screen was supplemented by antibodies to CD3, CD19, CD34 and CD38, as well as the viability marker 7-AAD (BD Biosciences). Antibodies and reagents are listed in Supplementary Table 3. Bone marrow mononuclear cells from participants with AML with TP53 mutations (n = 3) and healthy controls (n = 3) were stained at 4 °C for 20 min, followed by washing and resuspension for flow cytometry analysis on an LSR Fortessa II (BD Biosciences). The gating strategy for SLAMF6 detection is described in Supplementary Fig. 1. The MFI and percentage of positive cells based on isotype controls for each marker within the 7-AAD−CD3−CD19−CD34+CD38low fractions were used to compare the expression in AML and NBM. Highly expressed markers in the 7-AAD−CD3−CD19−CD34+CD38low NBM population (MFI > 10,000 or >10% positive cells) were excluded. Analyzed cell surface markers were scored according to the differential expression in AML and NBM based on fold change (AMLMFI/NBMMFI) and absolute shift (AMLMFI − NBMMFI). Candidates were then ranked on the basis of the average of their ranks in the two analyses and presented with the difference in MFI between AML and NBM (AMLMFI − NBMMFI).
SLAMF6 expression on AML samples and healthy cellsLeukocyte concentrates from peripheral blood from healthy donors were lysed with ammonium chloride (StemCell Technologies), viably frozen and thawed before staining with 7-AAD and combinations of the following antibodies: CD3–PE/Cy7 (BioLegend, 344816), CD7–BV711 (BioLegend, 564018), CD11c–BV711 (BioLegend, 301630), CD14–BV421 (BioLegend, 301830), CD16–APC (BioLegend, 302012), CD19–APC/Cy7 (BioLegend, 302218), CD56–AF488 (BioLegend, 318312), CD123–AF488 (BioLegend, 306036), HLA-DR–APC (BioLegend, 307610) and either SLAMF6–PE (BioLegend, 317208) or PE-conjugated mIgG1 isotype control (BioLegend, 400114). Monocytes were defined as FSC-AhighSSC-AintCD3−CD19−CD7−CD14+. Granulocytes were defined as FSC-AhighSSC-AhighSSC-HintCD16high. Eosinophils were defined as FSC-AhighSSC-AhighSSC-HhighCD16low. Dendritic cells were defined as SSC-Alow/intCD3−CD19−CD14−HLA-DR+. B cells were defined as FSC-AlowSSC-AlowCD3−CD19+. T cells were defined as FSC-AlowSSC-AlowCD19−CD3+. NK cells were defined as FSC-AlowSSC-AlowCD19−CD3−CD14−CD7+. Mononuclear cells from AML samples were thawed and stained with 7-AAD (BD Biosciences) and the following antibodies: CD3–PE/Cy7 (BioLegend, 344816), CD19–APC/Cy7 (BioLegend, 302218), CD34–AF488 (BioLegend, 343518), CD38–BV711 (BioLegend, 303528) and either SLAMF6–PE (BioLegend, 317208) or PE-conjugated mIgG1 isotype control (BioLegend, 400114). Flow cytometry was performed using an LSR Fortessa II (BD Biosciences). SLAMF6 expression was defined on the basis of the extent of the flow cytometric shift between signals with the SLAMF6 antibody and the isotype control antibody. Shifts with >50% of the cells outside the isotype peak were defined as ‘high’, 10–50% was defined as ‘intermediate’ and <10% was defined as ‘negative’.
T cells and immunomodulatory markers in AML samplesMononuclear cells from AML samples were thawed and stained with 7-AAD (BD Biosciences) and combinations of the following antibodies: CD96–BV421 (BioLegend, 338418), IL1RAP–BV421 (BD, 748107), CD38–BV711 (BioLegend, 303528), CD34–AF488 (BioLegend, 343518), CD34–APC/Cy7 (BioLegend, 343514), SLAMF6–PE (BioLegend, 317208), PE-conjugated mIgG1 isotype control (BioLegend, 400114), CD200–PE/Cy7 (BioLegend, 399806), CD47–AF647 (BioLegend, 127510), CD84–APC (BioLegend, 326009), CD274–APC/R700 (BD Biosciences, 565188), CD244–AF700 (BioLegend, 329525), CD45–APC/H7 (BD Biosciences, 641417), CD279–BV421 (BioLegend, 329920), TIGIT–BV421 (BioLegend, 372709), CD127–BV421 (BioLegend, 351309), CD45RA–BV510 (BioLegend, 740186), CD4–BV711 (BD Biosciences, 563028), LAG3–BV785 (BioLegend, 369321), CTLA4–BV785 (BioLegend, 369623), CD45–FITC (BioLegend, 304006), CD25–PE (BioLegend, 302606), CCR7–PE/Cy7 (BioLegend, 567314), CD357–PE/Cy7 (BioLegend, 371224), TIM3–APC (BioLegend, 345011), CD45RO–APC (BD Biosciences, 560899), SLAMF6–AF647 (BD Biosciences, 566093) and CD8–APC-R700 (BD Biosciences, 566857). Within the CD4+ and CD8+ T cell populations, naive cells were defined as CCR7+CD45RA+, TEMRA cells were defined as CCR7−CD45RA+, effector memory cells were defined as CCR7−CD45RA− and central memory cells were defined as CCR7+CD45RA−.
Analysis of in-house scRNA-seq dataRaw sequencing data were demultiplexed and converted to FASTQ format using bcl2fastq software (Illumina). Single-cell read count matrices were generated using the Cell Ranger (version 3.1.0) count pipeline (10X Genomics), which aligned, filtered and quantified barcodes against the hg19/GRCh37 reference genome. Further downstream analysis was performed using Seurat (version 4.0.0)68. Two datasets were generated by merging individual samples: one consisting exclusively of NBM samples and another combining AML and NBM samples. Low-quality cells with fewer than 200 detected genes and apoptotic cells with ≥15% of transcripts derived from mitochondrial genes were excluded. Data normalization and variance stabilization were performed using sctransform (version 0.3.2) on the 2,000 most highly variable genes, with mitochondrial gene expression regressed out69. Dimensionality reduction was performed using principal component analysis (PCA), retaining 80 principal components for further analyses. Cells from NBM samples were annotated using an external multimodal single-cell dataset comprising 30,672 NBM cells analyzed alongside 25 antibodies70. Annotations were transferred to the local dataset using Seurat’s TransferData function49,70. The annotated local NBM dataset was then used as a basis to project the PCA structure onto the larger cohort, which included all samples. Average gene expression levels for all cell types within each sample were calculated using Seurat’s AverageExpression function. SLAMF6 classification for each sample was determined on the basis of prior fluorescence-activated cell sorting (FACS) analysis. T cells were analyzed separately. After removing all other cell types from the dataset, a new PCA was performed using 30 principal components, followed by dimensionality reduction with uniform manifold approximation and projection (UMAP)71. This T cell dataset was reclassified using the same procedure described above and cells not reclassified as T cells were excluded. Gene signatures for T cell states based on previous studies14,29,46,47 were computed for each T cell using Seurat’s AddModuleScore function. SLAMF6 expression was also analyzed in an in-house scRNA-seq dataset with mononuclear cells from five NBM donors and CD34+ cells enriched by magnetic separation from three of the same donors45.
Analysis of SLAMF6 expression in external datasetsSLAMF6 expression was characterized in the publicly available scRNA-seq dataset GSE185381, containing data on mononuclear cells from ten healthy donors29. This dataset was processed using the same procedure as the in-house dataset, with minor exceptions. Specifically, Seurat (version 5.1.0) was used instead of Seurat (version 4.0.0) and the exclusion of low-quality cells was slightly more stringent, removing cells with fewer than 500 informative genes and adding an additional parameter to exclude cells with fewer than 1,000 total molecules detected. This dataset was also normalized using log2 normalization instead of sctransform normalization. Annotation was performed directly using the same external dataset70. Average gene expression levels for all cell types within each sample were calculated using Seurat’s AggregateExpression function. Furthermore, SLAMF6 expression was analyzed in the MS dataset from the Human Proteome Map72 and in the following datasets from the Human Protein Atlas: ‘immune cells’ (RNA-seq)73, ‘single cell type’ (scRNA-seq)74 and ‘the Human Protein Atlas’ (RNA-seq and immunohistochemistry)75.
Survival analysis in local and external datasetsOverall survival in the local Lund cohort (n = 37), based on SLAMF6 expression determined by flow cytometry, was visualized using survminer (version 0.4.9)76. The overall survival analysis in TCGA77 and Beat-AML78 cohorts was based on SLAMF6 RNA expression. RNA-seq and survival data for 179 AML cases from the TCGA project (https://gdc.cancer.gov/about-data/publications/laml_2012) and 575 cases from the Beat-AML project (https://biodev.github.io/BeatAML2/) were analyzed. To minimize the impact of SLAMF6 expression from lymphoid cells, the sample composition was first determined by deconvolution using LinDeconSeq79. Samples estimated to contain more than 15% lymphocytes were removed from further analysis, leaving 164 of 179 cases from TCGA and 455 of 575 cases from Beat-AML. Remaining samples from each dataset were divided into three groups of equal size on the basis of SLAMF6 expression and survival was visualized using survminer (version 0.4.9).
Knockout of SLAMF6 by CRISPR–Cas9SLAMF6-knockout cells were generated using the Alt-R CRISPR–Cas9 System (Integrated DNA Technologies), in which Cas9 protein, SLAMF6-specific CRISPR RNA (crRNA) and fluorochrome-conjugated trans-activating crRNA were electroporated into the SLAMF6-positive human AML cell lines HNT-34 and KG-1 (DSMZ), followed by FACS and expansion of SLAMF6-knockout cells. Verification of SLAMF6 knockout was performed by flow cytometry (BioLegend, 317208).
RNA-seq of SLAMF6-knockout cellsRNA-seq libraries for SLAMF6-knockout and wild-type HNT-34 cells were produced using the stranded mRNA prep kit (Illumina) and sequenced on a Novaseq 6000 system (Illumina). The transcriptome reads were aligned to human reference genome GRCh38.109 using STAR (version 2.7.9a)80 and gene expression was determined as transcripts per kilobase million using salmon (version 1.10.1)81. Variance filtering, hierarchical clustering and t-test between SLAMF6-knockout and wild-type samples were performed using Qlucore Omics Explorer (version 3.9) (Qlucore). The t-test results were visualized as a volcano plot using EnhancedVolcano (version 1.24.0)82. GSEA83 was performed using fgsea (version 1.31.6)84 and clusterprofiler (version 4.13.4)85 with the Reactome86 gene set collection from MSigDB (version 2024.1.Hs)83.
Antibody generation and binding to SLAMF6The TNC-1 antibody was generated by phage-display scFv library screening (SciLifeLab DDD Platform) with biotinylated SLAMF6 (Innovagen). Upon conversion to full-length LALA-mutant hIgG1, binding to SLAMF6 was determined by ELISA with SLAMF6-ECD (Innovagen) and by flow cytometry in which wild-type and SLAMF6-knockout KG-1 cells were incubated with the antibody or an isotype control at 10 μg ml−1, followed by incubation with a secondary anti-human antibody (Invitrogen, H10120). For competitive binding studies, primary human T cells were preincubated with 1 mg ml−1 SLAMF6-ECD for 20 min at 4 °C before repeated washing and incubation with 1 μg ml−1 FLAG-tagged scFv fragment of the TNC-1 antibody, followed by detection with a secondary anti-FLAG antibody (Sigma-Aldrich, F4049). Requests for the TNC-1 antibody can be made to Lead Biologics International.
Epitope mapping by HDX-MSEpitope mapping was performed by HDX-MS using a Fab fragment of the TNC-1 antibody and automated sample preparation on a LEAP H/D-X PAL platform (Trajan) interfaced to a liquid chromatography (LC)–MS system, comprising an Ultimate 3000 micro-LC coupled to an Orbitrap Q Exactive Plus MS (Thermo Fisher). PEAKS Studio X (Bioinformatics Solutions) was used for peptide identification after pepsin digestion of undeuterated samples. Peptides identified by PEAKS with a peptide score value of logP > 25 and no modifications were used to generate a peptide list containing peptide sequence, charge state and retention time used for HDX data analysis and visualization with HDExaminer (version 3.1.1; Sierra Analytics). Observed epitopes were mapped on AlphaFold model AF-Q96DU3-F1 (DeepMind).
NY-ESO vector designThe coding sequence of a single-chain peptide–HLA-A0201 (pMHC) construct (Addgene) carrying the NY-ESO peptide 157-165 (SLLMWITQC) was cloned into a modified pHR′SIN:CSW vector containing an SFFV promoter. To follow transgene expression, a T2A self-cleaving peptide followed by mTagBFP2 reporter was attached downstream to the pMHC sequence. The transgenic NY-ESO IG4 TCR (Addgene) was cloned into a modified pHR’SIN:CSW vector containing an SFFV promoter. A T2A self-cleaving peptide followed by eGFP was attached to the TCR sequence to determine transgene expression. Cloning was performed by In-Fusion Snap Assembly (Takara Bio). Constructs are available by request.
T cell activation and killingPrimary T cells were isolated from peripheral blood from healthy donors (Miltenyi Biotec, 130-050-101; Biolegend, 480131) and in indicated cases CD4+ and CD8+ T cells were isolated by microbead separation (Miltenyi Biotec, 130-045-101 and 130-045-201). Cocultures with T cells and wild-type or SLAMF6-knockout HNT-34, KG-1 or THP-1 AML cells were performed in RPMI medium with 10% FBS at a 4:1, 9:1 or 19:1 ratio. SLAMF6 antibodies and isotype-matched control antibodies (LALA-mutant hIgG1) were added to indicated concentrations directly upon seeding. After 72 h, T cell activation and killing were analyzed by flow cytometry. T cell activation was determined by surface expression of CD25 and CD69 on viable CD3+CD33−CD4+CD8− and CD3+CD33−CD4−CD8+ cells (BioLegend, 344816, 303416, 302606, 310910, 300518 and 301044). T cell killing was determined by the number of remaining viable AML cells (CD3−CD33+) using CountBright absolute counting beads (Invitrogen, C36950; BioLegend, 303416). Viability was determined by 7-AAD (BD Biosciences). T cell subpopulations based on CD45RA and CCR7 expression (BioLegend, 304142 and 353226) and surface marker expression of PDL1, PD1, LAG3, TIM3, CTLA4 and TIGIT (BioLegend, 393606, 317308, 344648, 344714, 329919, 345021, 369211, 369605 and 372705) after coculture were analyzed concurrently. For controls without T cells, AML cells were seeded at 0.1 × 10⁶ cells per ml under identical conditions. For experiments with the NY-ESO system, T cells were stimulated with CD3/CD28 beads (Thermo Fisher, 11132D) for 24 h before lentiviral transduction with a construct encoding the NY-ESO TCR and eGFP. Then 72 h after transduction, GFP+ cells were sorted and cultured without CD3/CD28 stimulation for 7–14 days. HNT-34 cells were lentivirally transduced with a construct encoding the corresponding pMHC complex and the blue fluorescent protein (BFP) marker protein, before sorting and expansion of BFP+ cells. Cocultures with T cells with and without NY-ESO and HNT-34 cells with and without pMHC were performed as described above but with a 1:9 ratio of T cells to AML cells.
scRNA-seqscRNA-seq was performed after coculture of HNT-34 AML cells and primary T cells with TNC-1 or an isotype-matched control antibody, as described above. After 72 h of coculture, cells were stained with 7-AAD (BD Biosciences) and the following antibodies for FACS and cite-seq analysis: CD3–PE/Cy7 (BioLegend, 344816), CD33–BV421 (BioLegend, 303416), CTLA4–totalseq-C (BioLegend, 369621), LAG3–totalseq-C (BioLegend, 369335), PD1–totalseq-C (BioLegend, 329963), TIGIT–totalseq-C (BioLegend, 372729) and TIM3–totalseq-C (BioLegend, 345049). Viable T cells and AML cells were sorted on an FACSAria Fusion (BD Biosciences) and libraries were prepared with Chromium GEM-X single-cell 5ʹ reagent kits v3 (10X Genomics) before sequencing on a Novaseq 6000 system (Illumina). Single-cell gene count matrices were determined using Cell Ranger (version 8.0.1; 10X Genomics) with reference genome GRCh38-2024-A. Further analyses were performed using Seurat (version 4.2.0). In brief, cells with fewer than 200 detected genes or more than 10% of transcripts having mitochondrial origin were excluded. Data normalization and variance stabilization were performed using sctransform (version 0.4.1) on the 3,000 most highly variable genes, with mitochondrial gene expression regressed out. Cell type prediction was performed with Seurat’s MapQuery function using a well-characterized NBM dataset as the ref.49. A distinct cluster containing cells predicted to be myeloid cells was assumed to contain HNT-34 cells. The remaining cells were predicted to constitute T cell and NK cell subsets. Differentially expressed genes between HNT-34 cells and the T cell subsets of each donor treated with TNC-1 and isotype were determined by Wilcoxon rank-sum test using Seurat’s FindMarker function. The differentially expressed genes between HNT-34 cells treated with TNC-1 and isotype were visualized in a volcano plot using EnhancedVolcano (version 1.24.0)82. GSEA was performed using fgsea (version 1.31.6)84 and clusterprofiler (version 4.13.4)85 with the Reactome86 and the Gene Ontology biological process87 gene set collections from MSigDB (version 2024.1.Hs)83.
Antibody treatment of AML cells in vivoTreatment experiments with AML cells were performed in 9–11-week-old male mice of the NOD.Cg-PrkdcscidIl2rgtm1Wjl/SzJ-SGM3 (NSG-S) mouse strain, a substrain of the NSG mouse overexpressing hGM-CSF, hIL-3 and hSCF (Jackson laboratory). Mice were sublethally irradiated (200 cGy) and transplanted with 5 × 10⁶ wild-type or SLAMF6-knockout HNT-34 cells by tail-vein injection. After 21 and 28 days, mice were transplanted with 1 × 10⁶ PBMCs from healthy donors, which were isolated by Lymphoprep separation (GE Healthcare). Antibody treatment with either TNC-1 (n = 7) or an isotype control antibody (n = 6) was administered by intraperitoneal injection 1 h and 72 h after each PBMC transplantation, at a dose of 2.0 mg kg−1 body weight. After 14 days of treatment, mice were killed and the isolated bone marrow and spleen cells were stained with a panel of 7-AAD (BD Biosciences) and the following antibodies: CD3–PE/Cy7 (BioLegend, 344816), CD33–BV421 (BioLegend, 303416), CD34–AF488 (BioLegend, 343518), CD45–APC (BD Biosciences, 555485) and SLAMF6–PE (BioLegend, 317208). Leukemic engraftment was determined by flow cytometry and defined as the percentage of hCD45+CD3−CD33+CD34+SLAMF6+ cells among the viable cells in each compartment. The experiment with SLAMF6-knockout HNT-34 cells was performed identically in 10–17-week-old male NSG-S mice (n = 6 for both treatment groups) and the treatment experiment without PBMCs was otherwise identically performed in 6-week-old male NSG-S mice (n = 5 for TNC-1 and n = 4 for the isotype control). All in vivo experiments were sex-matched, with sex selection based solely on animal availability as the applicability of the results is independent of sex. Mice were randomly assigned across ages to the TNC-1 or the isotype control treatment arms. Data collection and analysis were not performed blind to the conditions of the experiments. No animals or data points were excluded from the experiment.
Antibody treatment of healthy HSPCs in vivoTreatment experiments with CD34+ cells from healthy donors were performed in 8–12-week-old female mice of the NSG mouse strain (Jackson Laboratory) transplanted with CD34+ cord blood cells isolated by Lymphoprep separation (GE Healthcare) and subsequent CD34 positive selection using magnetic beads (Miltenyi Biotec). Mice were sublethally irradiated (200 cGy) and transplanted pairwise with CD34+ cord blood cells from five different donors. Treatment with TNC-1 (n = 5) or isotype control antibody (n = 5) was started when >10% human engraftment was detected in peripheral blood. Antibody treatment was administered by intraperitoneal injection twice weekly for 2 weeks at a dose of 2.0 mg kg−1 body weight. After 14 days of treatment, mice were killed and isolated bone marrow cells were stained with a panel of 7-AAD (BD Biosciences) and the following antibodies: CD3–APC/Cy7 (BioLegend, 300318), CD19–APC/Cy7 (BioLegend, 302218), CD33–BV421 (BioLegend, 303416), CD34–AF488 (BioLegend, 343518), CD38–BV711 (BD Biosciences, 563965) and CD45–APC (BD Biosciences, 555485). Human engraftment was determined by flow cytometry and the CD34+ and CD34+CD38low cell populations were defined as the percentages of hCD45+CD3−CD19−CD33−CD34+CD38+/low cells among the viable cells. Randomization, data collection and analysis were performed as for the AML treatment experiments. No animals or data points were excluded from the experiment.
Statistics and reproducibilitySample sizes were not predetermined by statistical methods but chosen on the basis of sample availability. Statistical tests were performed using Prism 10 (GraphPad Software). The Student’s t-test was used for two-group comparisons with normally distributed data. The Wilcoxon signed-rank test and the Mann–Whitney U-test were used for two-group comparisons of paired and unpaired non-normally distributed data, respectively. The Kruskal–Wallis test with Dunn’s post hoc test was used for multigroup comparisons with non-normally distributed data. All data met the assumptions of the statistical tests used. Research animals were randomly assigned to treatment arms across ages. Data collection and analysis were not performed blind to the conditions of the experiments. No data points were excluded from any experiments.
Reporting summaryFurther information on research design is available in the Nature Portfolio Reporting Summary linked to this article.
Comments (0)