
Remember me

The baseline characteristics of the 403 participants in INTEGRATE and INTEGRATE IIa are summarized in Table 1. Approximately half the participants were recruited in Asia. The median age was 63 years, 77% were male, and the primary site was stomach in 69%. The median overall survival time was 6 months, with a range from 2 to 30 months.
Table 1 Baseline characteristics of the participantsBaseline PROs indicated a significant symptom burden, with appetite loss reported in 61%, constipation in 42%, fatigue in 66%, and pain in 46%.
Univariable and multivariable modelIn the development dataset, 9 of 15 clinicopathological variables collected at baseline met the pre-specified threshold in univariable analysis (p ≤ 0.1) for potential inclusion in the multivariable model. These factors included ECOG performance status (1 vs 0) (p = 0.02), BMI (p = 0.08), number of metastatic sites (p < 0.001), liver involvement (p = 0.04), treatment with regorafenib vs placebo (p = 0.005), NLR (p < 0.001), LDH (p < 0.001), albumin (p < 0.001), and CA 19–9 (p < 0.001). Univariable and multivariable analyses are summarized in Table 2.
Table 2 Univariable and multivariable analyses of associations between baseline characteristics and overall survival timeBaseline PROs that met the univariable analysis threshold for inclusion in the multivariable model included appetite loss (p < 0.001), constipation (p < 0.001), fatigue (p < 0.001), and pain (p < 0.001) from the QLQ-C30, and stomach pain (p < 0.001) from the QLQ-STO22.
Three multivariable models were constructed from the multivariable analysis, all stratified by gastrectomy status. The first model (M1) included clinicopathological factors such as region, ECOG status, number of metastatic sites (extent of cancer), BMI, treatment, NLR, LDH, albumin, and CA 19–9. The second model (M2) expanded on M1 by adding PROs from EORTC QLQ-C30, specifically fatigue, pain, appetite loss, and constipation. The third model (M3) used the item on stomach pain from the QLQ-STO22, along with the subscales for fatigue and appetite loss from the QLQ-C30, to model M1. Liver involvement was excluded from multivariable models based on the LASSO.
These multivariable analyses (M2) demonstrated several clinicopathological and PRO factors that were prognostic for overall survival in models accounting for the effects of other variables. Survival times were shorter for participants from the rest of the world than from Asia (HR 1.68, 95% CI 1.20–2.35, p = 0.0026). Shorter survival times were also associated with number of metastatic sites (HR = 2.20, 95% CI 1.39–3.48, p = 0.001), higher NLR (HR = 1.21, 95% CI 1.02–1.43, p = 0.03), higher LDH (HR = 1.51, 95% CI 1.26–1.82, p < 0.0001), and higher CA 19–9 (HR = 1.01, 95% CI 1–1.01, p = 0.0006). Longer survival times were associated with higher BMI (HR 0.57, 95% CI 0.39–0.84, p = 0.004), and higher serum albumin (HR = 0.80, 95% CI 0.65–1.00, p = 0.05). Performance status, liver metastasis, and lines of previous therapy were not significant in multivariable models.
Among the PRO, appetite loss was associated with shorter survival in both univariable and multivariable analysis (HR = 1.21, 95% CI 1.01–1.45, p = 0.03), whereas constipation, fatigue, and pain were significant in univariable models (p < 0.001), but not in the multivariable model (p > 0.10). The subscale for pain from the QLQ-STO22 had slightly increased prognostic significance than the pain scale from the QLQ-C30.
Overall, factors such as region, number of metastatic sites, treatment, NLR, LDH, albumin, and appetite loss consistently showed significant associations with survival, while other factors like age, sex, and primary site show little to no impact.
Model performanceThe performance of these multivariable models was assessed using the C-statistic (see Table 3). M2 and M3 exhibited higher C-statistics than M1, indicating improved prediction by including PROs. M2, which incorporated the PRO indicators from EORTC QLQ-C30, but not the QLQ-STO22, was chosen as the final model on the basis of its higher C-statistics in both the gastrectomy and non-gastrectomy strata and the benefit of using PRO domains from one, rather than two, separate PRO measures.
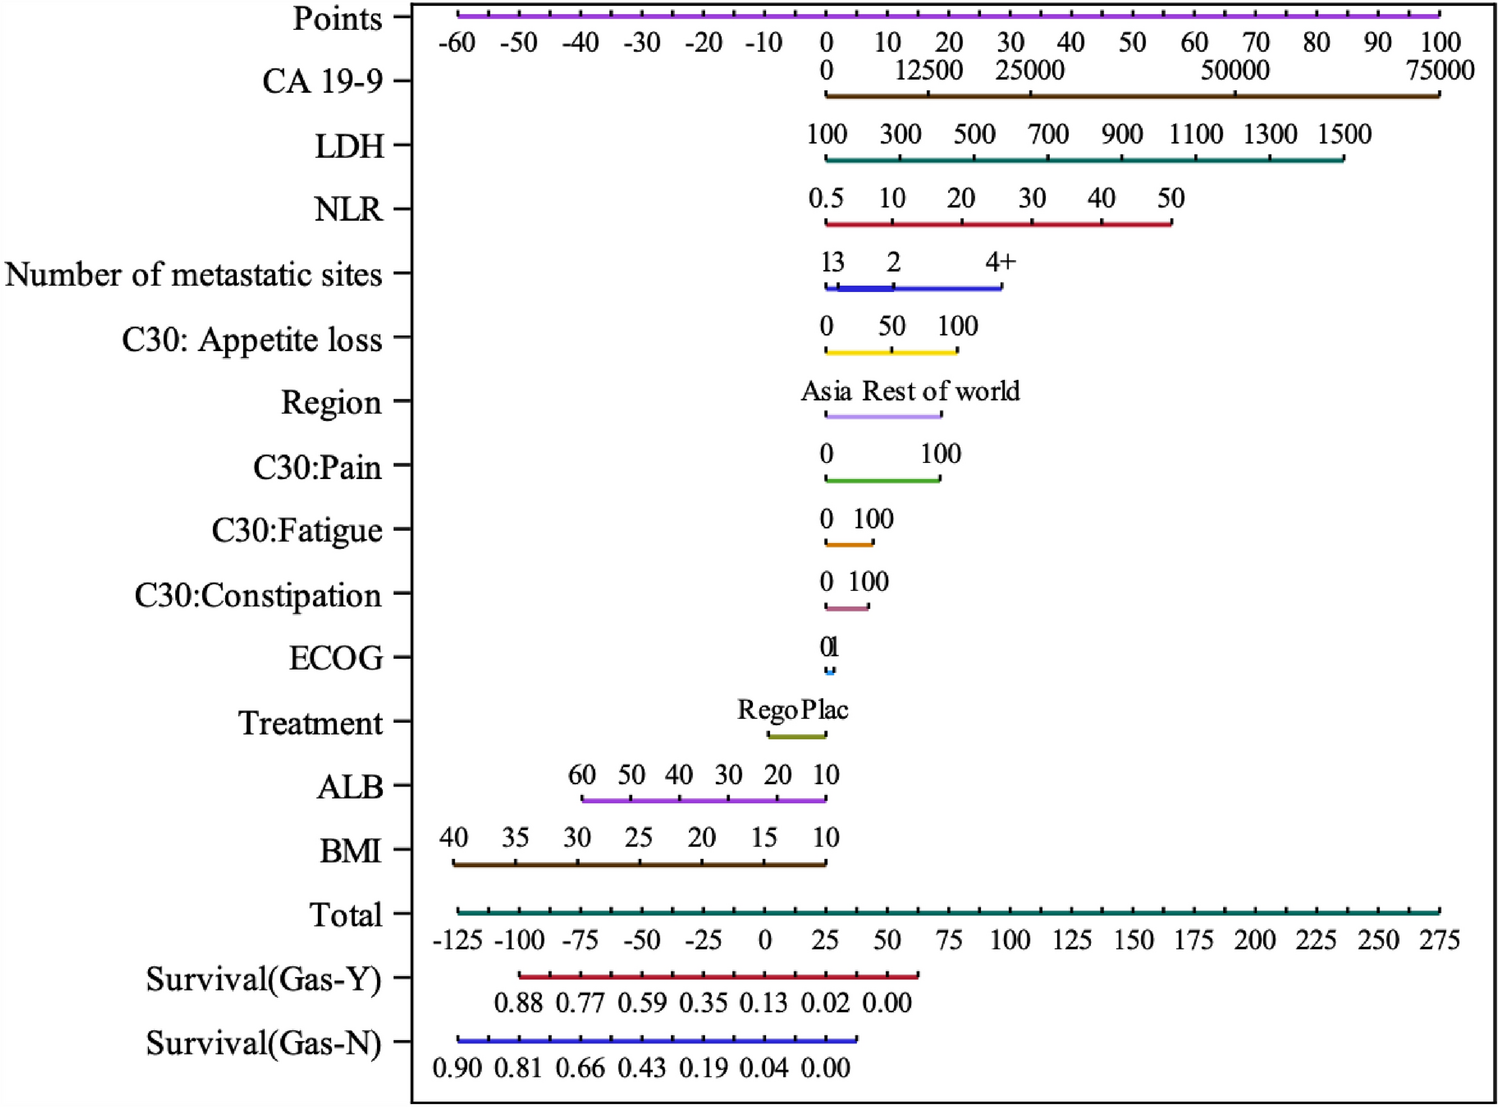
Table 3 Model’s C-Statistic + Bootstrap 95% CIsThe nomogram (Fig. 1) based on Model-2 illustrates the extent to which the various predictor variables affect the probability of overall survival at 6 months. For example, in this dataset, the 4 or more metastatic sites were associated with a much lower probability of survival at 6 months than 3 or fewer metastatic sites, whereas having an ECOG performance status 0 versus 1 had relatively little effect. Appetite loss and pain had larger effects on the probability of survival than fatigue and constipation.
Fig. 1
Nomogram for predicted probability of survival at 6 months. CA carbohydrate antigen, LDH lactate dehydrogenase, NLR neutrophil to lymphocyte ratio, C30 EORTC QLQ-C30, ECOG eastern cooperative oncology group, Rego regorafenib, Plac placebo, ALB albumin, BMI body mass index, Gas gastrectomy, Y yes, N no. *The more points the lower the estimated probability of survival at 6 months
Validation of the modelCalibrationThe model’s predictions of 6-month survival were well-calibrated for participants with and without prior gastrectomy, as indicated by the calibration curves being close to the 45-degree reference line reflecting perfect calibration (Fig. 2). Panel B, showing the calibration of M2, indicates the improvement resulting from the inclusion of the PRO for fatigue, pain, and constipation to M1 shown in Panel A. Use of the QLQ-STO22 items for stomach pain in M3 did not improve calibration compared with the use of the generic items for pain in M2 from the QLQ-C30. There was a tendency for the lowest predicted survival probabilities to underestimate the observed survival probability in all the models.
Fig. 2
Calibration plot for observed vs predicted 6 months survival in INTEGRATE I trial population
Comments (0)