2.1 General Approach
We investigated the impact of pharmacokinetically guided dose optimization of durvalumab, assuming that a plasma concentration of 53.3 µg/mL is the threshold for efficacy. This concentration, defined by the license holder, represents a hundred-fold of the Michaelis–Menten (Km) estimate of 0.533 µg/mL (95% CI 0.072–1.58) derived from their population pharmacokinetic model. Their simulations indicated that with a treatment regimen of 10 mg/kg Q2W, 95.4% of patients are expected to maintain a trough concentration (Ctrough) above this efficacy threshold [5].
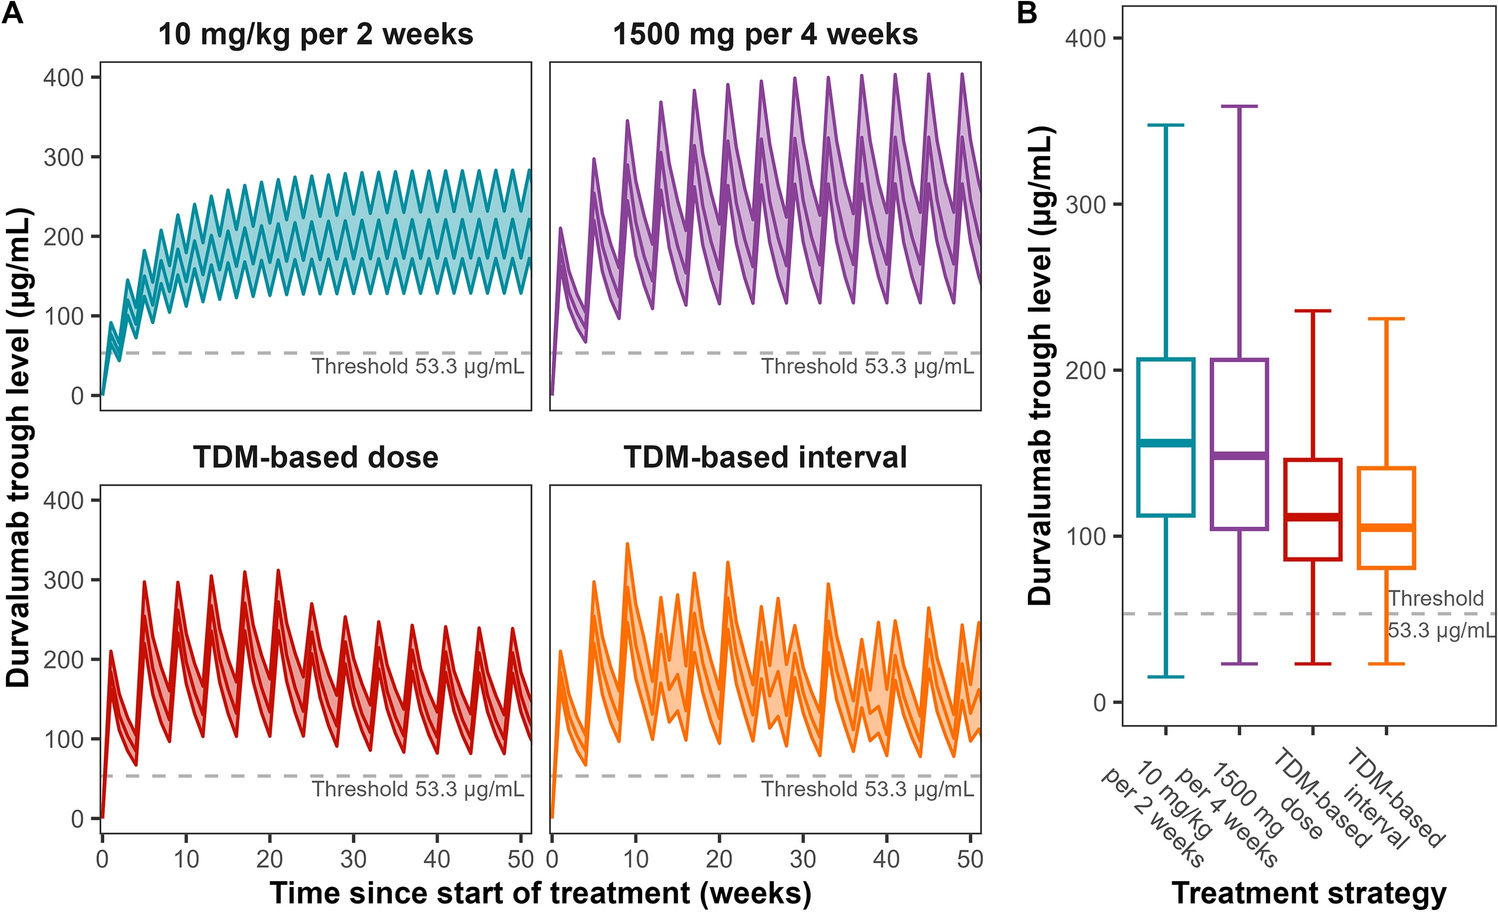
We evaluated four strategies in a representative population (Table S1, see electronic supplementary material [ESM]). The first strategy, hereafter referred to as TDM-based dose, involved tailoring the individual dose based on therapeutic drug monitoring (TDM) while maintaining a fixed interval. The second strategy, hereafter referred to as TDM-based interval, was focused on individualizing the dosing interval based on TDM. These TDM-based strategies aimed to reduce the cumulative dose while maintaining the individual exposure above the proposed efficacy target throughout the dosing interval. The two currently approved durvalumab dosing regimens of 10 mg/kg Q2W and 1500 mg Q4W were also simulated as reference strategies. For all four strategies, we calculated the fraction of patients above the efficacy target just before administering a subsequent dose during the maintenance phase, as well as the associated costs. These analyses are detailed comprehensively in the following sections.
2.2 Population Pharmacokinetic Modeling and Simulation
All population pharmacokinetic simulations were performed using the software package NONMEM® version 7.5.1 (ICON, Ireland) assisted by the modeling toolkit Perl speaks NONMEM (PsN) version 5.3.0, and with Pirana version 2.9.9 (Certara, NJ, USA) as an interface and modeling environment. The pharmacokinetic model used was the semi-mechanistic time-varying clearance model described by Baverel et al. (2018) [9] (Supplemental Model Code, see ESM). Statistical data analysis and summarization were executed with R version 4.1.3 (R Foundation for Statistical Computing, Vienna, Austria) via the RStudio version 2022.02.1 interface (PBC, Boston, MA, USA).
For the TDM-based dose and interval strategies, the starting dose was 1500 mg on the first day, followed by dose or interval adjustments based on the Ctrough measured, 4 weeks after the first dose (Table 1A). Subsequent doses and intervals were tailored based on individual exposure, whereby we aimed to reach a steady-state Ctrough above the target of 53.3 µg/mL, ensuring adequate drug exposure while minimizing unnecessary durvalumab use. The cut-off values for dose adjustments (40, 90, and 130 µg/mL) were selected accordingly, with the 40-µg/mL threshold intended to align with this 53.3-µg/mL steady-state target, considering accumulation of durvalumab between the initial dose and steady-state conditions. These adjustments were re-evaluated on the Ctrough following the fifth dose. Thereby, for both TDM-based strategies, only pre-defined dose adjustments were implemented, as this approach allowed for more precise tailoring of the treatment while minimizing the risk of sub-target trough levels. Due to susceptibility differences to dosing adjustments, a distinction was made between patients with personalized dosing, based on Ctrough after the first dose, and those still treated by the initial strategy of 1500 mg every 4 weeks (Table 1B). The treatment timeline of the TDM strategies is depicted in Fig. S1 (see ESM).
Table 1 Dosing strategies over timeDoses were rounded to the nearest achievable dose using 120-mg or 500-mg vials to minimize waste. For the 10-mg/kg dosing strategy, the per-cycle dose was calculated as ten times the patient's weight, with the used amount of drug rounded up to the nearest amount that could be prepared from whole vials. The difference between these rounded and calculated doses was considered wastage.
The Ctrough was predicted for each dosing strategy for each virtual patient throughout 1 year of treatment and at steady-state conditions (≥ 4 doses after the latest dose adjustment). The percentage of patients achieving a steady-state Ctrough > 53.3 µg/mL was calculated and compared with the 95.4% reference percentage. Furthermore, the median total durvalumab dose per patient per year and over a mean treatment duration of 8 months [10], along with the predicted amount of drug wastage in the same period, was calculated under the assumption of wastage of partially used vials. Additionally, the median number of administrations and the median dosing interval were calculated for the 1-year and the 8-month treatment duration.
2.3 Pharmacoeconomic Evaluation
The pharmacoeconomic analysis was conducted from a Dutch medical perspective, focusing solely on direct costs associated with durvalumab treatment. Cost components included the expenses for the drug itself, which were calculated based on reimbursement rates set by Dutch insurers at €5.075 per milligram, with consideration for potential drug wastage [11]. The analysis incorporated all relevant cost components to evaluate the pharmacoeconomic impact of dosing interval adjustments, with drug administration costs estimated at €379.45 per infusion, according to assessments provided by the Dutch National Health Care Institute (Zorginstituut Nederland, ZIN) [12]. Routine check-ups with a clinician incurred costs of €128.30 per visit, also based on ZIN evaluations. Routine laboratory testing expenses were estimated at €42.15 per test, based on the mean cost derived from prices at three Dutch hospital laboratories (OLVG Lab BV in Amsterdam, Reinier Haga Medisch Diagnostisch Centrum in The Hague, and Radboudumc Laboratorium voor Diagnostiek in Nijmegen) [12,13,14]. The costs of TDM testing were determined based on the average expense of an ELISA kit and the related labor costs [15,16,17,18,19,20,21,22]. These labor costs included the salaries of laboratory personnel conducting the tests and the clinicians interpreting the results, which were calculated using the average wages specified in the Dutch Collective Labor Agreement (CLA) and included the social security contributions [20, 22, 23]. In total, the cost of TDM testing per patient amounted to €57.50 per test. All cost data were adjusted to June 2024 using the consumer price index (CPI) published by Statistics Netherlands (Centraal Bureau voor de Statistiek, CBS) [24]. Additional methodological details are available in Method S1 and Table S2 in the ESM.
To assess the potential cost savings of TDM-based strategies compared with the standard dosing regimens, the mean cost differences and percentage reductions for overall per-patient costs and each cost component, including drug acquisition, administration, monitoring, and TDM testing, were calculated.

Comments (0)