
Remember me
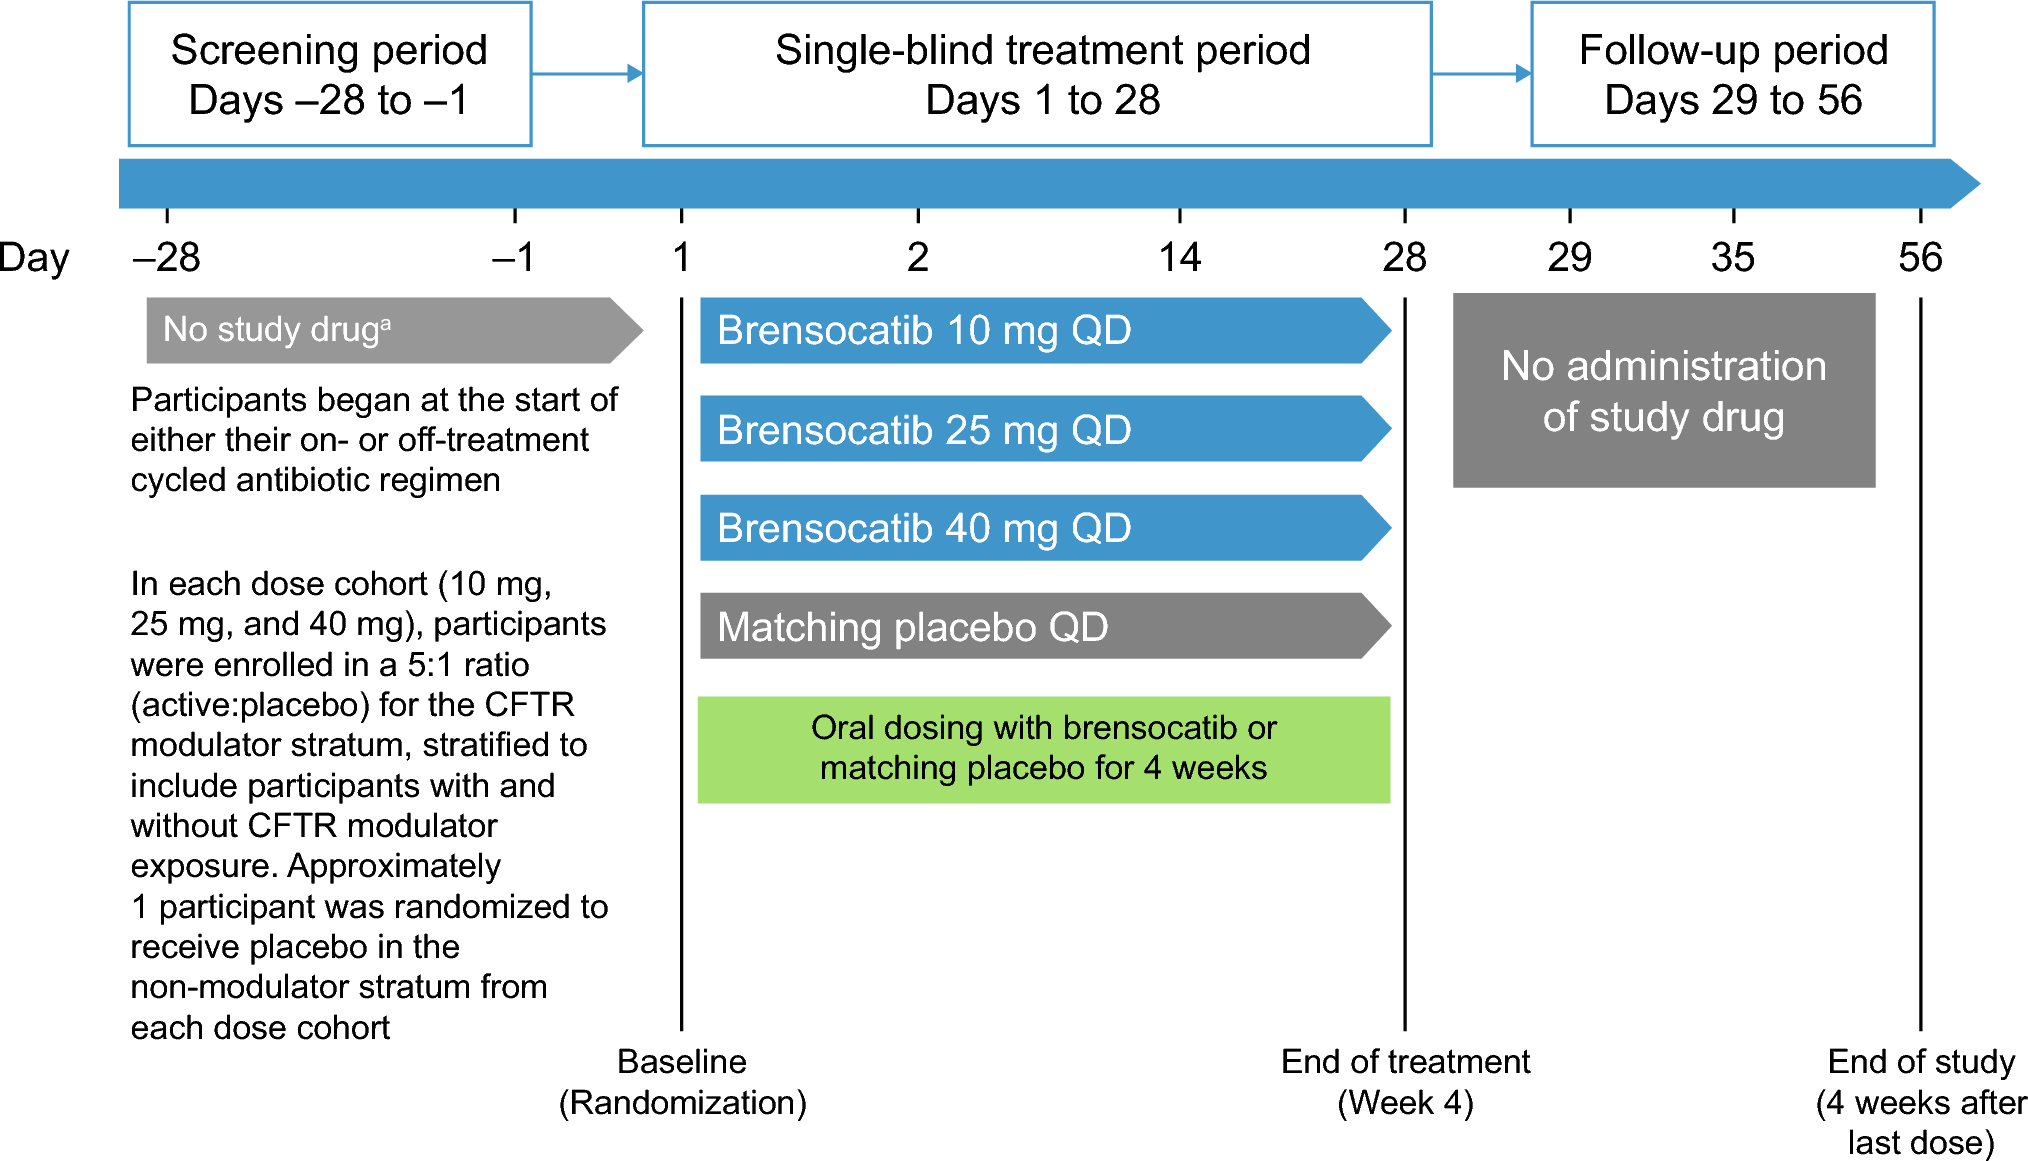
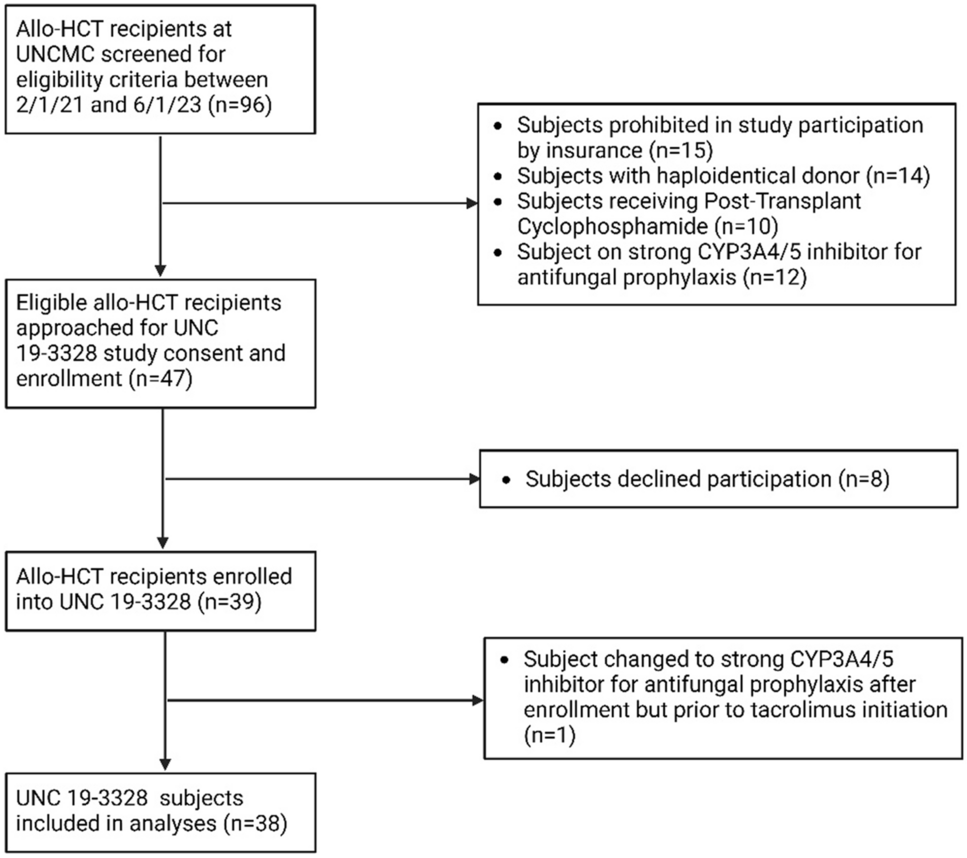
Among 35 participants screened, 29 met eligibility criteria and were randomized to treatment. Eight participants were allocated to each of the three brensocatib dose groups and five participants to the placebo group. No participants discontinued treatment or discontinued from the study (Fig. 2). All participants were stratified by CFTR use, with 21 in the CFTR modulator stratum and 8 in the no CFTR modulator stratum (Table 1).
Fig. 2
Summary of participant disposition. CFTR cystic fibrosis transmembrane conductance regulator, QD once daily
Table 1 Demographics and baseline characteristics3.1 Baseline CharacteristicsDemographic and clinical characteristics of all participants at baseline were similar across cohorts, except for a larger proportion of male participants. Mean (SD) age was 37.9 (14.6) years, with 21 (72.4%) participants aged ≥ 30 years. A total of 18 (62.1%) participants were male, and the mean (SD) BMI was 25.3 (4.7) kg/m2 (Table 1).
A total of 17 (58.6%) participants were receiving a chronic antibiotics regimen for stable CF treatment, and 22 (75.9%) were receiving pancreatic enzyme replacement therapy (Table 1). Most participants had mild-to-moderate lung disease, as shown by ppFEV1.Those receiving CFTR modulators versus not had lower lung function (ppFEV1, mean [SD]: 61.6 [9.0] versus 73.1 [7.4], respectively), a higher use of pancreatic enzymes (n [%]: 17 [81.0] versus 5 [62.5], respectively), and higher use of chronic antibiotics (61.9% versus 50.0%, respectively) (Table 1).
3.2 PharmacokineticsThe PK analysis set included 24 (82.8%) participants (8 in each of the brensocatib treatment groups). Among these, 17 participants were concomitantly treated with CFTR modulators.
Mean plasma concentrations following a single oral administration and daily administration of brensocatib for 28 days were dose-dependent, and the inter-participant variability was low (Fig. 3a and b, respectively).
Fig. 3
Mean (+SD) brensocatib plasma concentration profile on a day 1 and b day 28 following brensocatib once-daily oral administration with or without concomitant use of CFTR modulators. CFTR cystic fibrosis transmembrane conductance regulator, QD once daily, SD standard deviation
All geometric mean ratio (GMR) values for dose-normalized Cmax, AUC0–24, and AUClast ranged from 1.08 to 1.21 (≤ 30%), with the 90% confidence intervals (CIs) containing 1.0, indicating that brensocatib exposure was not significantly different, regardless of concomitant use of CFTR modulators (Table 2).
Table 2 Dose-normalized brensocatib exposure, with/without concomitant use of CFTR modulatorsPK analyses showed that brensocatib was rapidly absorbed. Median Tmax postdose on day 1 (after the first dose) and day 28 (at steady state) was 1.5–2.0 h (Table 3).
Table 3 Mean (CV%)a of brensocatib pharmacokinetic parameters on days 1 and 28 with/without use of CFTR modulatorsAcross brensocatib dose groups, mean Cmax on days 1 and 28 was 60.9–365 ng/mL and 92.0–538 ng/mL, respectively, in the CFTR modulator stratum, and 86.4–274 ng/mL and 84.3–348 ng/mL, respectively, in the non-CFTR modulator stratum. Mean AUC0–24 on days 1 and 28 was 798–4120 h × ng/mL and 1080–7360 h × ng/mL, respectively, for the CFTR modulator stratum, and 1120–2400 h × ng/mL and 1190–3740 h × ng/mL, respectively, for the non-CFTR modulator stratum. Mean AUClast on days 1 and 28 was 798–4120 h × ng/mL and 2440–17,700 h × ng/mL, respectively, for the CFTR modulator stratum, and 1120–2400 h × ng/mL and 2210–9540 h × ng/mL, respectively, for the non-CFTR modulator stratum. The GMRs of dose-normalized Cmax and AUC (AUC0–24 and AUClast) on days 1 and 28 were 1.08 and 1.16 for Cmax and 1.21 and 1.09 for AUC (Table 2). The elimination t1/2 was comparable between participants in the CFTR modulator stratum and the non-CFTR modulator stratum, ranging from 24.7 to 49.5 h. These data indicate that brensocatib PK in adults with CF is not affected by the concomitant use of CFTR modulators. On the basis of the PK comparability between the CFTR strata, combined PK parameters (CFTR and non-CFTR modulator groups, presented in Table 3) were used as the primary PK outcomes for the data presentation, discussion, and conclusions.
Brensocatib systemic exposure was dose-dependent. The least squares geometric mean ratio (LSGMR) in Cmax (90% CI) comparing the 40-mg dose to the lower doses on day 28 was 1.36 (1.02–1.82) for 10 mg and 1.25 (0.92–1.69) for 25 mg. The LSGMR in AUC0–24 (90% CI) comparing the 40-mg dose to the lower doses on day 28 was 1.42 (1.04–1.92) for 10 mg and 1.02 (0.74–1.41) for 25 mg.
Exposure to brensocatib showed moderate accumulation at steady state at 10, 25, and 40 mg (1.5- to 2-fold accumulation on Cmax and AUC; Table 3).
The disposition parameters, such as CL/F (apparent total clearance of drug from plasma after extravascular administration), Vd/F (apparent volume of distribution), and elimination t1/2 were consistent over the dose range. On day 28, the t1/2 of brensocatib progressively increased with each higher dose administered across the treatment groups (Table 3).
The inter-participant variability (coefficient of variation expressed as a percentage) in Cmax, AUC0–24, and t1/2 was low to moderate, generally within 15–50%. Overall, brensocatib PK in participants was linear and predictable based on dose-dependent exposure and consistent disposition parameters across doses and low-to-moderate interindividual variability.
The plasma concentration profiles in adults with CF from this study were compared with those in healthy adults following once-daily dosing at 10, 25, and 40 mg [18] and in those with NCFBE following once-daily dosing at 10 and 25 mg [15]. Plasma concentration–time profiles of brensocatib (10 mg, 25 mg, or 40 mg) in the 24 h postdose on day 1 (after a single dose) and on day 28 (at steady state, after 4 weeks of daily dosing) in participants with CF compared with healthy adults and those with NCFBE are shown in Fig. 4. The superimposable PK concentration profiles, especially on day 28, indicate that brensocatib PK in adults with CF is highly comparable to that in non-CF populations.
Fig. 4
Plasma concentration of brensocatib once daily at day 1 compared with day 28 in participants with CF compared with healthy adultsa and those with NCFBEb,c. aData were included from healthy adults from a phase I study of the safety, tolerability, and PK of brensocatib 10, 25, and 40 mg [18]. bData were included from adults with NCFBE treated with brensocatib 10 mg or 25 mg in the phase II WILLOW study [15]. cData for the 40-mg arm were not available for adults with NCFBE. CF cystic fibrosis, NCFBE non-cystic fibrosis bronchiectasis, PK pharmacokinetics
3.3 PharmacodynamicsOn the basis of the comparability of PK between participants with and without concomitant use of CFTR modulators, NSP activity (NE, CatG, PR3) in blood and sputum was analyzed using the combined data sets without the CFTR modulator stratum. Analysis of NE activity in blood demonstrated that, compared with placebo, there was a dose-dependent increase in the median percent reduction of NE activity with brensocatib, from 35.3% to 74.0% over the dose range of 10–40 mg QD. For NE activity in sputum, a similar trend was seen for median percent reduction, ranging from 40.7% to 77.8% across brensocatib doses, with the greatest reduction seen with the 25-mg dose (Fig. 5).
Fig. 5
Median % reduction of NE activity in blood and sputum relative to baseline on day 29. Data are for the pharmacodynamic analysis set. Values below the limit of quantitation are included in the analysis using lower limit of quantification / 2. Percent reduction is defined as \(100 \times \left(1 - \left(\frac\right)\right)\). NE neutrophil elastase
Similar findings were also reported from studies in healthy adults and in adults with NCFBE (Table 4) [15, 30]. Healthy adults exhibited a median percent reduction of NE activity ranging from 34.8 to 55.1% across brensocatib doses. In adults with NCFBE, the median percent reduction in NE activity was 30.9% and 66.5% in the brensocatib 10 mg and 25 mg groups, respectively (Table 4).
Table 4 Median % reduction of NE activity in the blood of healthy adultsa and in adults with CF or NCFBEb,cThe median percent reduction of CatG activity in blood displayed a consistent trend with increasing doses of brensocatib, especially in the 25 mg and 40 mg groups, and ranged from 75.1% to 91.3% in all doses of brensocatib (Table 5). For PR3, the median percent reduction of activity in blood with brensocatib ranged from 17.3% to 55.0% over the dose range of 10–40 mg QD. Despite the absence of a dose-related effect on sputum CatG and PR3 activities, reductions were observed: CatG activity decreased in the 10-mg dose group, and PR3 activity decreased in both the 10-mg and 25-mg dose groups (Table 5).
Table 5 Median % reduction of NSP activity in blood and sputum relative to baseline on day 29The relationships between brensocatib systemic exposure (area under the plasma concentration–time curve from 0 to 24 h (AUC0–24) during a dosage interval (AUCtau), Cmax, and concentration immediately prior to dosing (Ctrough)) and the maximum reduction of NSP activity (ECmax, % inhibition) or the NSP reduction on day 29 (% inhibition) were explored using locally estimated scatterplot smoothing (LOESS) regression (Fig. 6). All three NSP enzymes showed exposure- and dose-dependent reduction. The NSP activity reduction reached a saturation point at approximately 25 mg, as indicated by the plateau of the associated PK measures. The sensitivity of reduction for brensocatib was greatest for CatG, followed by NE, and PR3 (Fig. 6).
Fig. 6
Reduction of NSP activity with increasing brensocatib exposure. AUCtau area under the plasma concentration–time curve during a dosage interval, CatG cathepsin G, Cmax maximum plasma concentration, Ctrough concentration immediately prior to dosing, ECmax maximum inhibition, NE neutrophil elastase, NSP neutrophil serine proteinase, PR3 proteinase 3
3.4 SafetyThe incidence of TEAEs is presented in Table 6. Reported TEAEs were mostly mild to moderate in intensity. Only one participant experienced a serious TEAE, in the brensocatib 40-mg treatment group, which was an infective pulmonary exacerbation of CF. No new safety signals were identified, and there were no reported discontinuations due to adverse events, adverse events of special interest, or deaths (Table 6).
Table 6 Safety summary of treatment-emergent adverse events
Comments (0)