
Remember me
This study was approved by the institutional review board of the National Cancer Center Hospital East (approval number: 2019–048), and the requirement for informed consent was waived according to Japanese clinical research guidelines and regulations.
MammogramsA total of 63 institutions, including hospitals and clinics in Japan participated in this study. Mammograms taken for breast cancer screening and diagnosis from January 2010 to August 2019 were collected retrospectively. All mammograms were either de-identified digital radiography mammograms or computed radiography mammograms. A mammogram included MLO (mediolateral oblique) and CC (craniocaudal) views. If not available, only one pair of MLO views was collected.
Mammograms were acquired using mammography equipment from several manufacturers. The most commonly used devices and manufacturers were Selenia-Dimensions (Hologic, USA) with 39.8%, AMULET-Innovality, AMULET-f (FUJIFILM, Japan) with 29.3%, MAMMOMAT-Inspiration, MAMMOMAT-Revelation (Siemens Healthineers, Germany) with 18.4%, and Senographe-CrystalNova, Senographe-Pristina, Senographe-Essential (GE HealthCare Technologies, USA) with 9.1%.
Mammograms were retrieved from the devices in uncompressed DICOM format and converted to PNG format for anonymization and data handling. The matrix size was consistent with the DICOM data retrieved from the device, and the grayscale was converted to 8 bits.
Inclusion criteriaAll mammograms were from Japanese women over 20 years of age, with no previous history of chemotherapy, endocrine therapy, or radiotherapy, and no history of surgery, including partial resection, breast reconstruction, incisional or vacuum-assisted biopsy, and mammoplasty. Eligible mammograms showed either only benign, only breast cancer lesions, or normal findings. Even if there are multiple lesions within the same mammogram, it is eligible if all of them can be detected and meet the following criteria;
-All breast cancer lesions were histologically confirmed. Atypical epithelial lesions, e.g., atypical ductal hyperplasia, and malignant mesenchymal tumors, e.g., malignant phyllodes tumor, were excluded.
-Lesions were classified as benign if one of the following criteria was met: (i) histologically proven as benign, (ii) no progression on separate mammograms performed at least 2 years apart, (iii) clear evidence of a simple cyst on mammography or other modalities.
-Normal breast mammograms meet one of the following criteria: (i) no lesions detected by mammography, ultrasound, and/or magnetic resonance imaging, (ii) no new appearance of lesions on separate mammograms taken at least 2 years apart.
Exclusion criteriaThe following cases were excluded from this study: (i) tomosynthesis, spot compression, synthetic 2-dimensional mammography, and poor quality images, (ii) images showing axillary lymph node metastases. (iii) cases of breast cancer or benign disease with no mammography findings when assessed by the investigating physicians. (iv) cases where breast cancer and benign lesions coexist in the same mammogram. (v) mammograms with quality degradation when converted to an irreversible image, i.e., JPEG format.
DatasetBased on the design of previous studies [22], we set the target number of mammograms to be collected at 20,000 mammograms. The expected number of breast cancer, benign, and normal mammograms was 5000, 5000, and 10,000, respectively.
Local investigators (a total of 72 readers ranked graded A (indicating breast cancer detection sensitivity and specificity greater than 90%), or equivalent to grade A, according to the Japan Central Organization on Quality Assurance of Breast Cancer Screening [https://www.qabcs.or.jp/]) manually marked all benign and breast cancer lesions based on pathology reports using Fiji (Image-J) software (https://fiji.sc/) (Supplementary Fig. 1). Benign cases without pathology reports were marked with reference to other modalities, e.g., ultrasound, and/or magnetic resonance imaging. The accuracy of the marking was finally verified by the authors (KI, KB, KH, YK, YO, NS, HT, TU).
After collecting eligible images, we randomly divided into a training, validation, and test datasets in a balanced ratio of 8:1:1 on a case-level basis. No adjustment was made for this randomization. The training and validation datasets were used to build and refine the AI-CADx system. The test dataset was used to evaluate the final AI-CADx system.
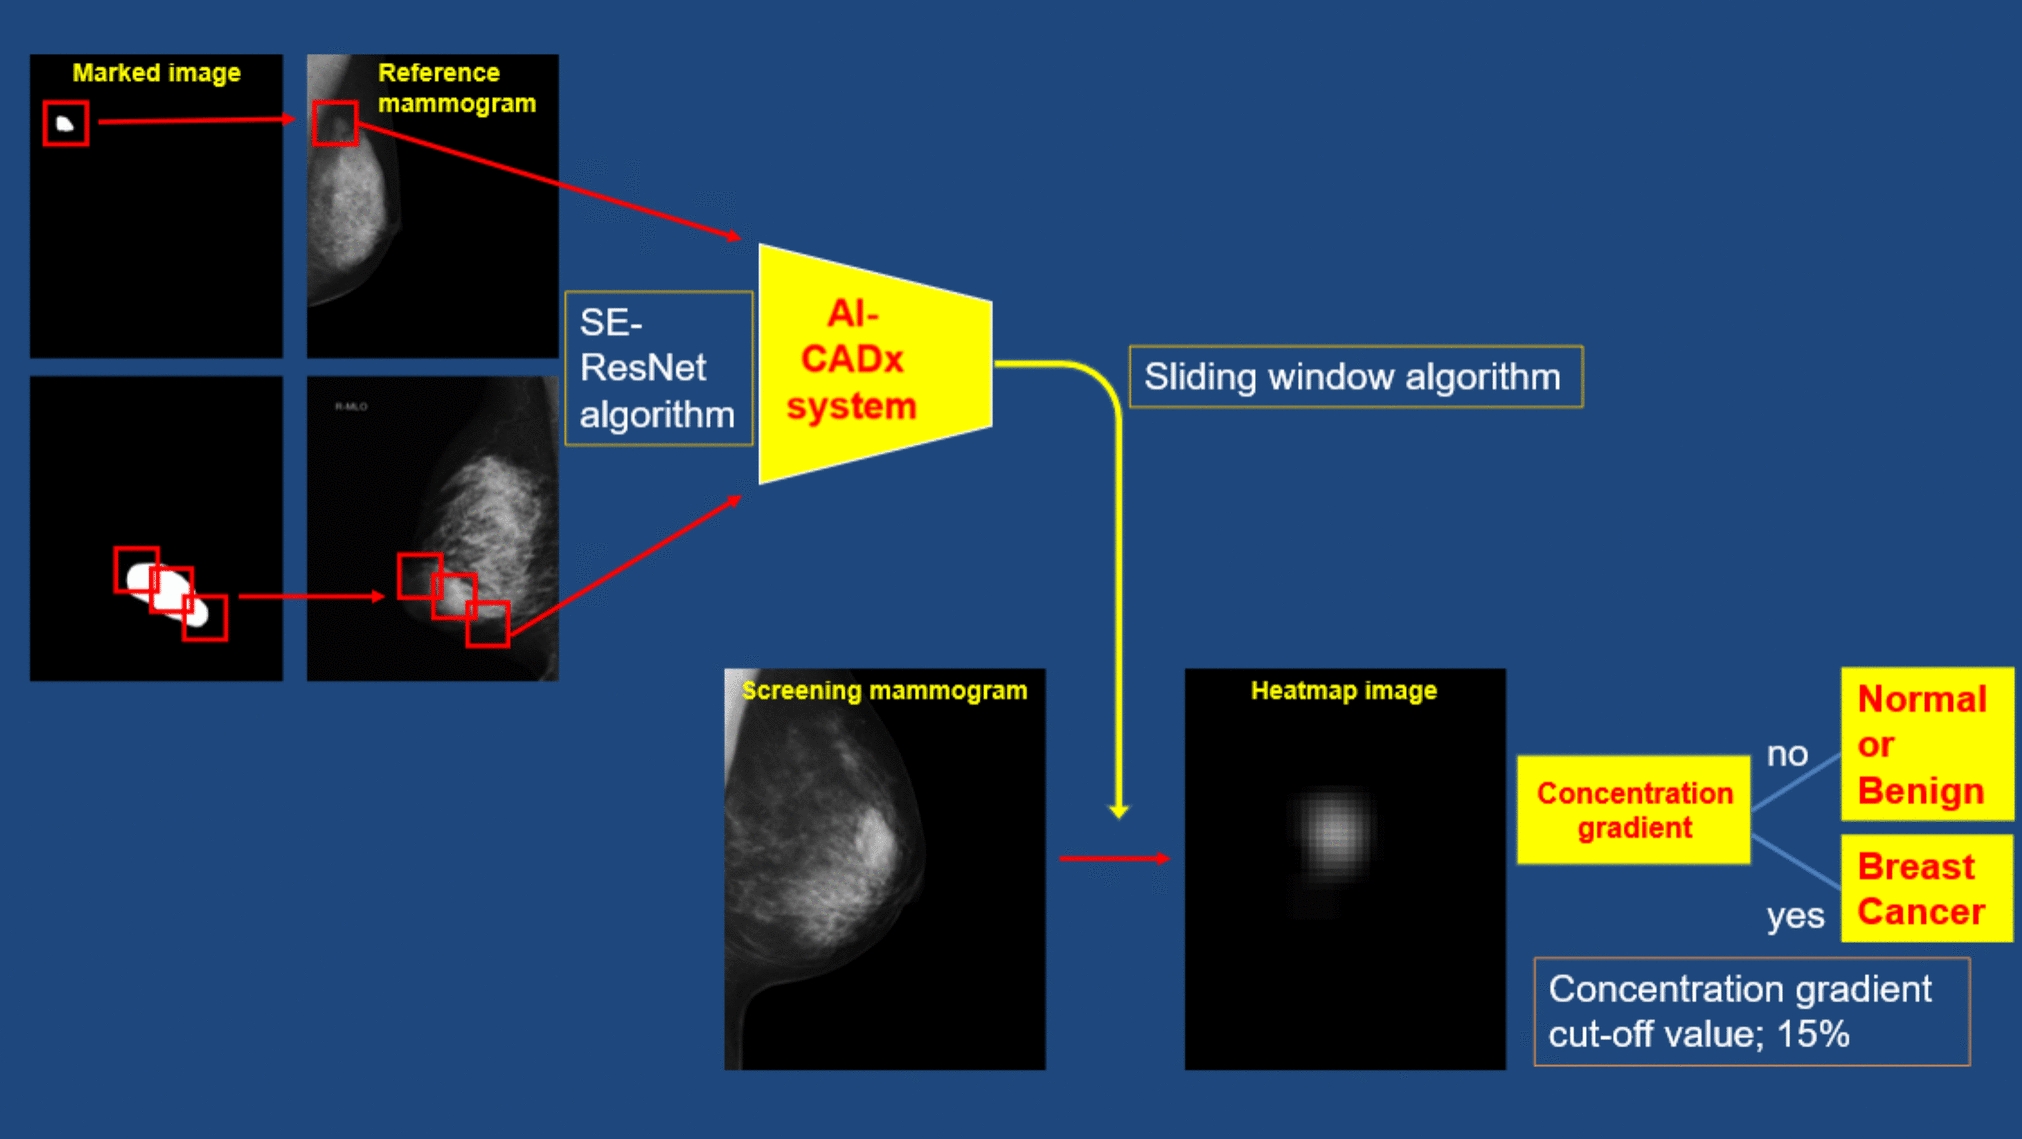
Construction of an AI algorithmThe flow diagram of our developed AI-CADx system is shown in Fig. 1. We used Python software (version 3.7.7) as the programming language. TensorFlow (version 2.1.0) was used as the AI framework.
Fig. 1
Flow diagram of the AI-CADx system
The AI architecture is an original design based on a convolutional neural network. First, we formed an squeeze-and-excitation (SE) — residual block by combining convolutional layers, batch normalization layers, and a SE structure. After the residual block, we compressed the data using global average pooling and passed it through two fully connected layers and a sigmoid function to output it as a tensor. The output number indicates the probability of detecting a malignant lesion. During training, the dropout rate was set to 50% and inserted after each fully connected layer. During learning, optimization was performed using reduced focal loss. The parameters were fixed at the recommended values of α = 0.25 and γ = 2.0.
The mammograms used to train the AI-CADx system had different resolutions depending on the manufacturer. To standardize the size of calcifications and other mammographic findings, the mammograms were uniformly resized to a height of 2560 pixels while maintaining the aspect ratio. Then, the mammograms were converted into 8-bit grayscale PNG files with 256 levels before being used for learning. If the original mammogram is 16 bits, for instance, the pixel value is divided by 256 to ensure it falls between 0 and 255.
The gold standard for annotating this AI-CADx system is based on pathologic references. The mammogram was cropped to 512 × 512 pixels based on the marked image so that the detected lesion was sufficiently included. If the lesion was smaller than the cut-out image, the center of gravity of the lesion was calculated from the marked image and set as the center of the cut-out image. If the lesion was larger than the cut-out image, multiple crops were made at equal intervals along the contour of the marked image. This allowed us to create a cut-out image depicting the edge of the lesion and containing approximately 50% of it. During training, patch images were randomly cropped to 384 × 384 pixels and randomly combined using data augmentation techniques, e.g., horizontal flip, filtering (Laplacian, Sobel, Canny edge detection, Gabor, Gaussian, and Median), random shifting, and random erasing. Since we plan to commercialize the current AI-CADx system, we did not perform pretraining on ImageNet. Instead, we trained the model from scratch for 300 epochs.
During testing, the sliding window method was used to detect lesions in a single mammogram. Since lesions may appear at the mammogram’s edges, margins of 384 pixels were added to the top, bottom, left, and right of the mammogram. Lesions were detected using a stride of 64 pixels. If the tensor value was 0.5 or greater, the corresponding area of a prepared heat map image was assigned a probability value. Repeating this process assigned a higher numerical value to areas with a high probability of depicting a lesion. Finally, the heat map image was overlaid on the mammogram to visualize the likelihood of a lesion’s presence (see Supplementary Fig. 2).
AI stand-alone was not designed to interpret mammograms independently. Assuming a performance evaluation was conducted on a single unit, areas of the heat map image with a concentration gradient exceeding 15% were identified as having a malignant lesion. This value of 15% was determined through repeated experimentation to strike a good balance between sensitivity and specificity. Using the sliding window method, heat map images were created for all mammograms. If a concentration gradient of 15% or higher was present, the mammogram was determined to contain a malignant lesion (Fig. 1).
OutcomesAfter developing the AI-CADx system with the training and validation datasets, we assessed its performance with an independent test dataset. The test dataset consisted of MLO view mammograms only. The AI-CADx system was considered accurate if it detected the presence of a malignant lesion in a mammogram indicating breast cancer. Localization was not considered in the assessment of accuracy. The Breast Cancer Surveillance Consortium reported radiologist’s interpretive performance at mammography screening with sensitivity and specificity of approximately 85 and 90%, respectively [23]. In addition, the sensitivity of mammography screening was 77% in the J-START study conducted in Japan [24].
Therefore, we set the primary endpoint as the expected sensitivity and specificity of the AI-CADx system for diagnosing breast cancer at 80% or higher.
If the AI-CADx system met this endpoint, we interpreted its performance as equivalent to that of Japanese physicians involved in breast cancer screening, according to the Japan Central Organization on Quality Assurance of Breast Cancer Screening (https://www.qabcs.or.jp/).
We also set the secondary endpoints as follows: the accuracy of the AI-CADx system according to the following subgroups: (i) breast density, (ii) mammographic findings, (iii) pathologic findings, and (iv) mammography vendors.
Statistical analysisWe evaluated the breast cancer diagnostic performance of the AI-CADx system using the receiver operating characteristic (ROC) curve and the area under the ROC curve (AUC). We calculated the sensitivity, specificity, and AUC of the AI-CADx system at the breast level using the sci-kit learn Python library. Sensitivity is defined as the proportion of mammograms that the AI-CADx system correctly diagnosed breast cancer among breast cancer-positive mammograms. Specificity is the number of mammograms in which the AI-CADx system correctly diagnosed normal or benign lesions among mammograms without breast cancer. Since the sample size was sufficient and the data were expected to follow a standard normal distribution, we used the DeLong method [25] to calculate the 95% confidence interval from the AUC rather than the bootstrap method. All statistical calculations and analyses were performed using Python software (version 3.7.7).
Comments (0)