
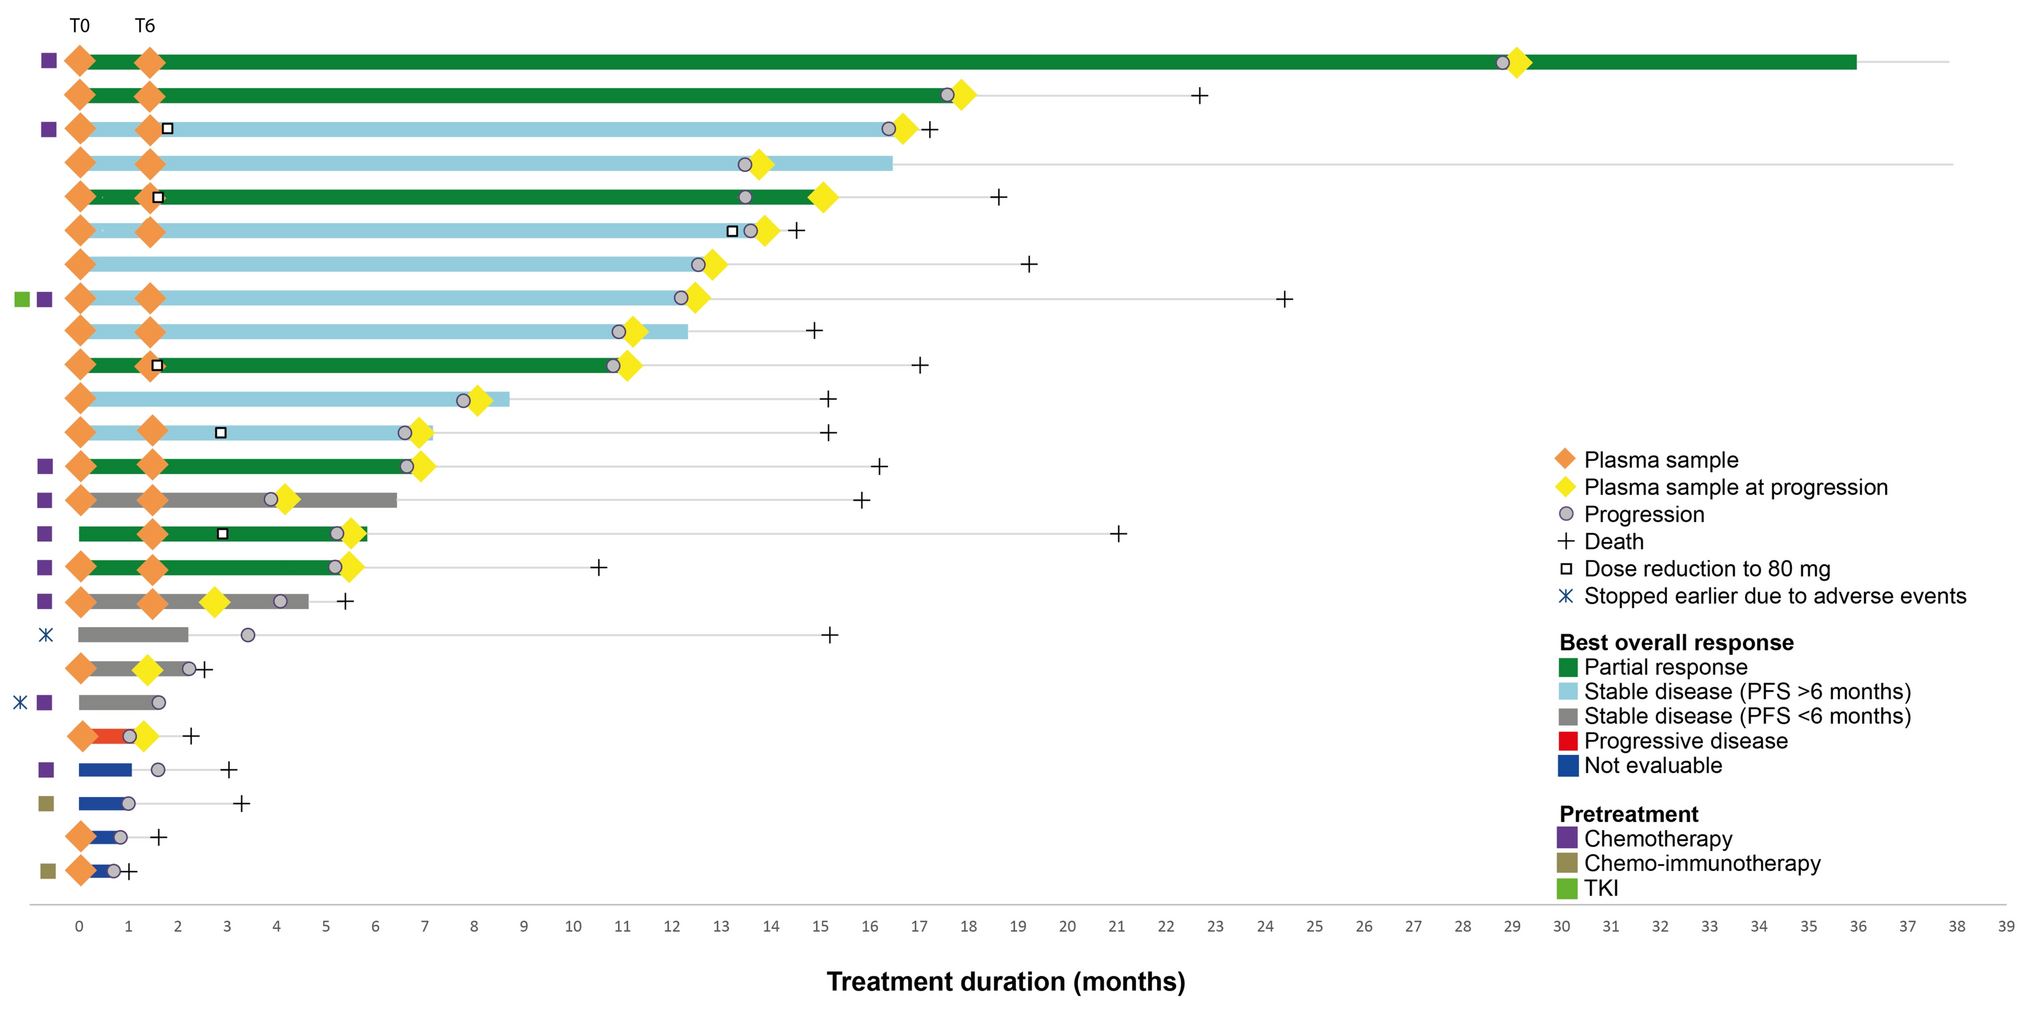
Remember me
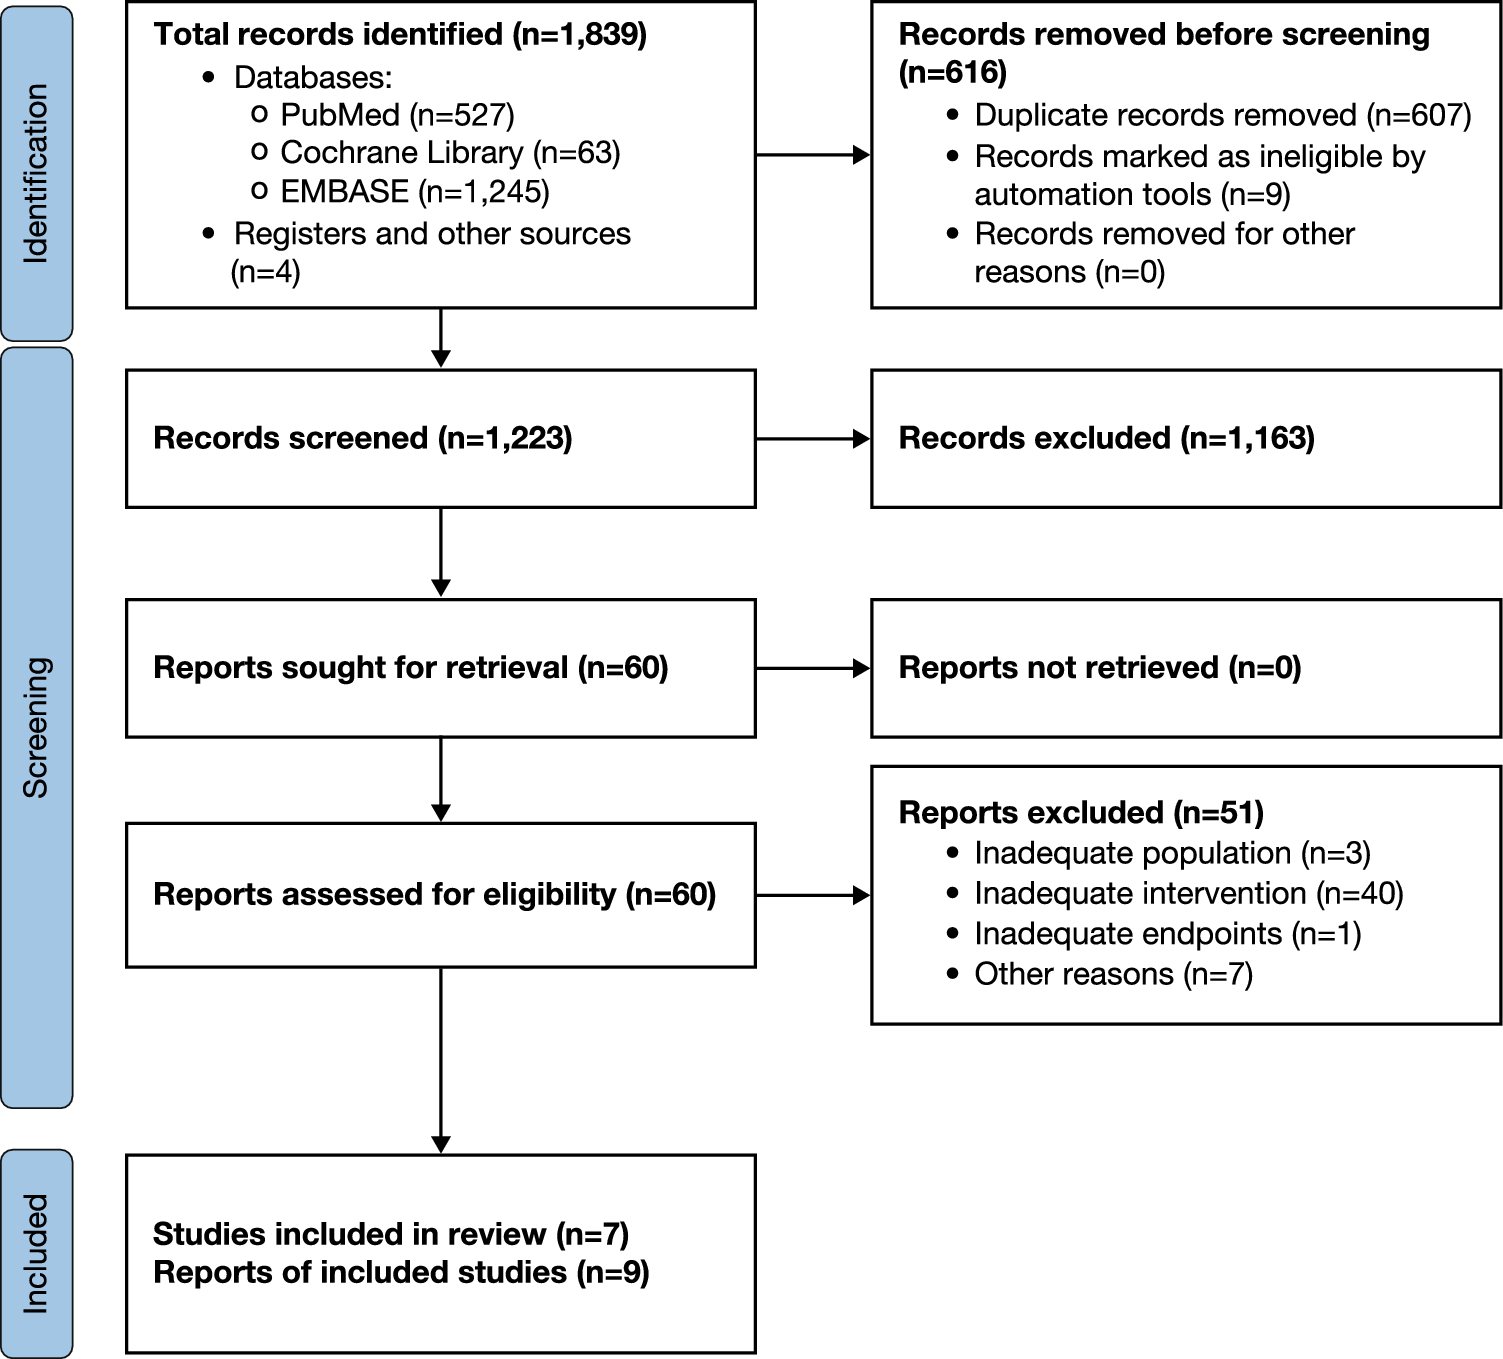
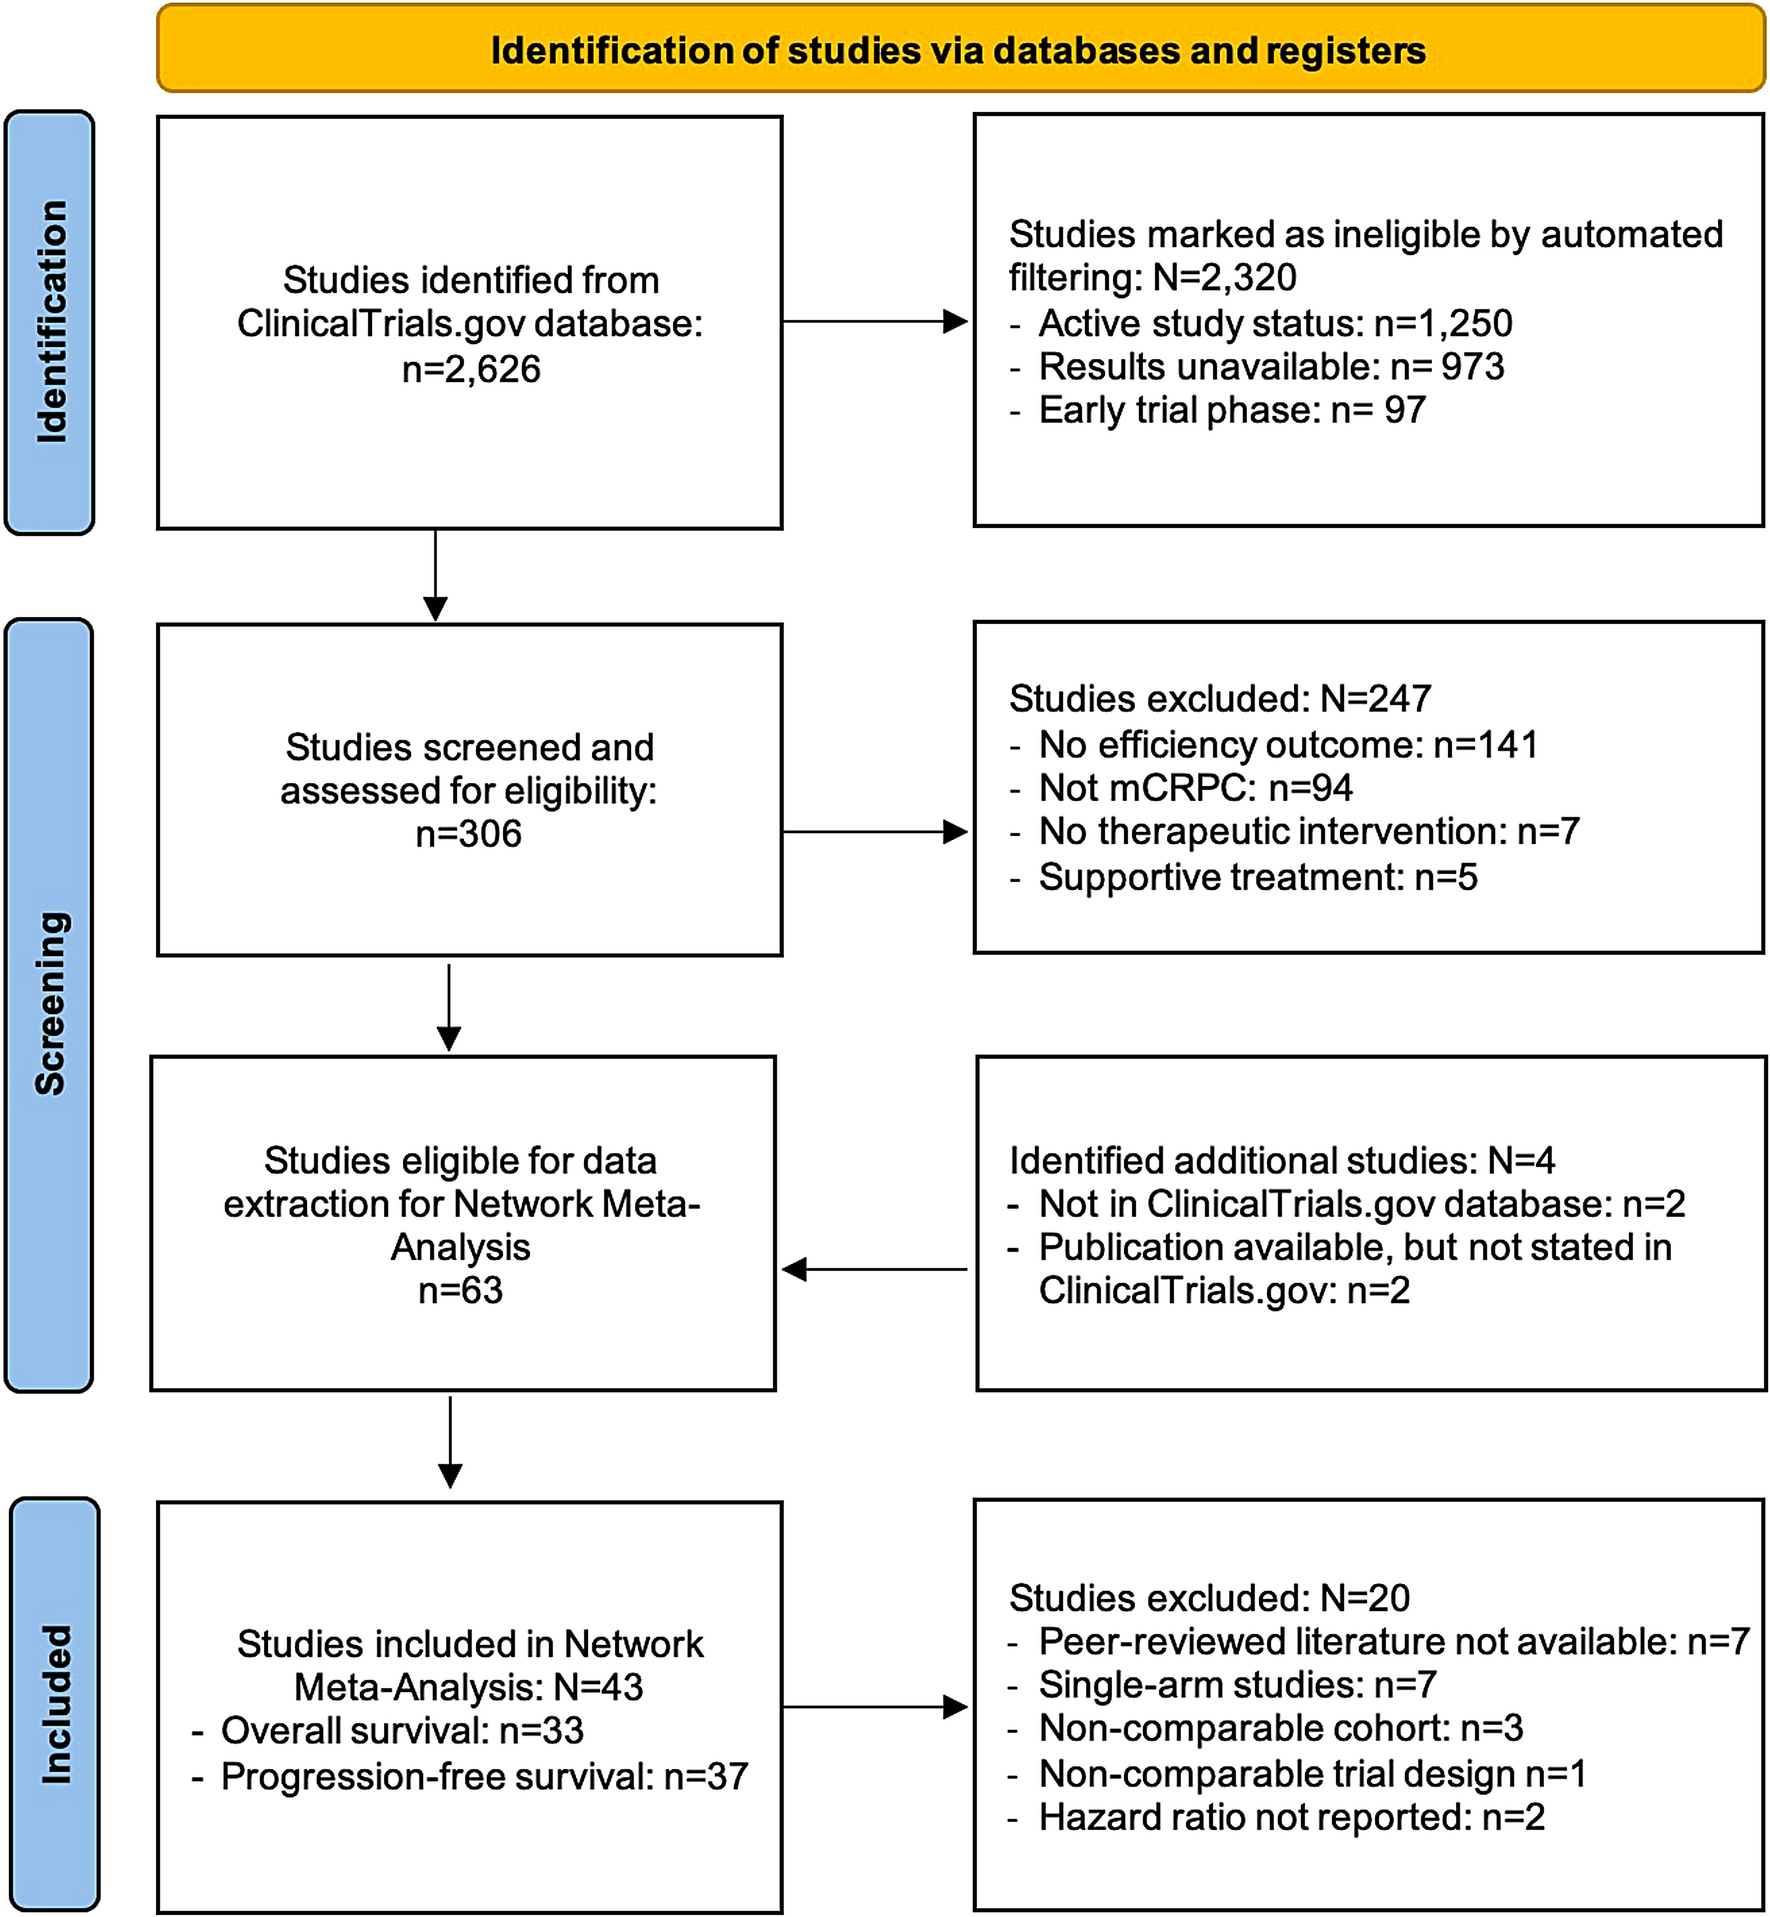
A total of 2626 unique studies were retrieved from the ClinicalTrials.gov database (Fig. 1). After automated filtering, we excluded 2320 studies because of their active recruitment status (n = 1250), unavailable results (n = 973), or early-phase classification (n = 97), resulting in 306 studies deemed eligible for manual screening. Following manual screening, we excluded 247 studies because they did not report treatment efficiency (n = 141), they focused on malignancies other than mCRPC (n = 94), or they studied non-therapeutic interventions (n = 7) or supportive treatments (n = 5), resulting in 59 eligible studies. Additionally, we included four relevant studies: those initiated before the ClinicalTrials.gov database launch (n = 2) or that were published elsewhere despite unavailable results on ClinicalTrials.gov (n = 2), leading to 63 studies for full-text data extraction. From these, 20 studies were excluded for reasons such as missing peer review (n = 7), single-arm design (n = 7), non-comparable cohorts (n = 3), non-comparable trial designs (n = 1), and missing HRs/CIs (n = 2). Ultimately, 43 studies [14, 16, 19, 22, 54,55,56,57,58,59,60,61,62,63,64,65,66,67,68,69,70,71,72,73,74,75,76,77,78,79,80,81,82,83,84,85,86,87,88,89,90,91,92] were included, with 33 for OS and 37 for PFS analysis .
Fig. 1
PRISMA flow diagram of the study selection process. mCRPC metastatic castration-resistant prostate cancer
3.2 Risk-of-Bias AssessmentIn the risk-of-bias assessment, 44% (n = 19) of studies demonstrated a low risk of bias, and 56% (n = 24) had some concerns (Fig. 2 in the ESM). The primary issue (51%; n = 22) was biases in the randomization process, primarily because of an open-label design and group size disparities. However, OS and PFS are objective endpoints, unlikely to be affected by the lack of blinding. Additionally, 40% (n = 17) of studies raised concerns about deviations from intended interventions, and four studies had missing data for reported outcomes. Notably, none of the studies presented a high risk of bias in any dimension.
3.3 Network Structure and Patient Characteristics3.3.1 Network ModelWe selected a fixed-effect model for the OS endpoint based on the MCMC error assessment and DIC comparison. The fixed-effect model (DIC = 66.01) provided a better model fit than the random-effects model (DIC = 68.18), indicating consistent treatment effects across the studies, which was further supported by trace plots with entangled chains and density plots resembling a normal distribution (Figs. 3, 4 in the ESM). For the endpoint PFS, a random-effects model provided a better fit (DIC = 76.63) than the fixed-effect model (DIC = 120.29). Model convergence was confirmed with Gelman–Rubin statistics, PSRF = 1.001872 for OS and PSRF = 1.001584 for PFS, indicating satisfactory convergence of MCMC chains (Figs. 5, 6 in the ESM). Node-splitting analysis showed no significant differences between direct and indirect treatment comparisons for both endpoints (p≥0.05) (Figs. 7, 8 in the ESM), suggesting reliable results.
3.3.2 Principal FindingsOf all 43 studies, 40 (93%) were two-arm and three (7%) were three-arm trials. Additionally, three trials (7%) reported two cohorts as two-arm studies using all-comers as the entire intention-to-treat population. A total of 89 arms and 33,494 patients were included in this NMA. Among the studies, eight (18%) were phase II, 33 (77%) were phase III, and two (5%) were phase IV trials, published between 2004 and 2024. Of these, 27 (63%) reported both OS and PFS, 10 (23%) reported only PFS, and six (14%) reported only OS outcomes (Table 1).
Table 1 Study and patient characteristics of included studies.The trials investigated 40 treatment approaches, including combination therapies and 34 unique individual treatments. The most frequent interventions included docetaxel (n = 16; 18%), enzalutamide (n = 15; 17%), abiraterone (n = 12; 13%), and ARPI switch therapy (n = 5; 6%). Prednisone was incorporated into 45 treatment arms (51%). Placebo was the control in 27 arms (30%), thereof 14 (16%) including active agents such as abiraterone or docetaxel, and 13 (15%) using standard supportive treatment.
All patients had mCRPC with metastases involving bones, visceral tissues, lymph nodes, or a combination thereof. Of the 43 studies, 23 (53%) focused on first-line therapies in a chemo-naïve setting, four (9%) explored interventions in both first- and second-line settings, nine (21%) concentrated on second-line therapies, two (5%) examined therapies in second- and third-line settings, and five (12%) investigated third-line therapies after hormonal therapy and chemotherapy. A network graph (Fig. 2A) illustrates treatment comparisons for OS and PFS, where nodes represent interventions, their size corresponds to patient numbers, and edges denote direct comparisons, with thickness indicating comparison frequency.
Fig. 2
Network plots for a overall survival and b progression-free survival. ABI =abiraterone, ARPI androgen receptor pathway inhibitor, CBZC20 cabazitaxel 20 mg, DOX docetaxel, ENZA enzalutamide, GMCSF granulocyte-macrophage colony-stimulating factor, MTX mitoxantrone, OLA olaparib, PREMB pembrolizumab, PSMA prostate specific membrane antigen
3.4 Findings for Endpoint Overall Survival3.4.1 Principal FindingsFor the endpoint OS, 33 studies were included, thereof 30 (91%) were two-arm trials and three (9%) were multi-arm trials, resulting in 69 arms analyzed in the NMA, with 28,847 patients [14, 16, 19, 21, 54,55,56,57,58,59,60,61,62,63,64,65,66,67,68,69, 72, 75, 77, 79,80,81, 84,85,86, 88,89,90, 92]. The mean ± standard deviation (SD) sample size per arm was 367 ± 192 for the control and 465 ± 215 for the intervention arm. Overall, 36 different direct comparisons were included in the analysis. Among these, abiraterone versus placebo (n = 2), enzalutamide versus placebo (n = 2), and orteronel versus placebo (n = 2) were each compared twice; all other comparisons were conducted once.
Most patients received chemotherapy, mainly docetaxel (n = 6760; 23%) (Fig. 2A). Of these, 3472 (12%) received docetaxel monotherapy and 3288 (11%) underwent combination therapy. Cabazitaxel was given to 1284 (4%) patients, with 895 (3%) on monotherapy and 389 (1%) on combination regimens or varied dosing. Additionally, mitoxantrone was administered to 774 (3%) patients. Moreover, a significant proportion of patients received a form of ARPI, thereof 2810 (10%) enzalutamide, 2607 (9%) abiraterone, 1515 (5%) orteronel, 1055 (4%) ARPI switch therapy, 492 (2%) apalutamide, and 45 (<1%) darolutamide. For controls, 5127 (18%) patients received placebo, either alone or in combination with active treatments, and the other control arms included standard-of-care therapies or active treatments (Table 1).
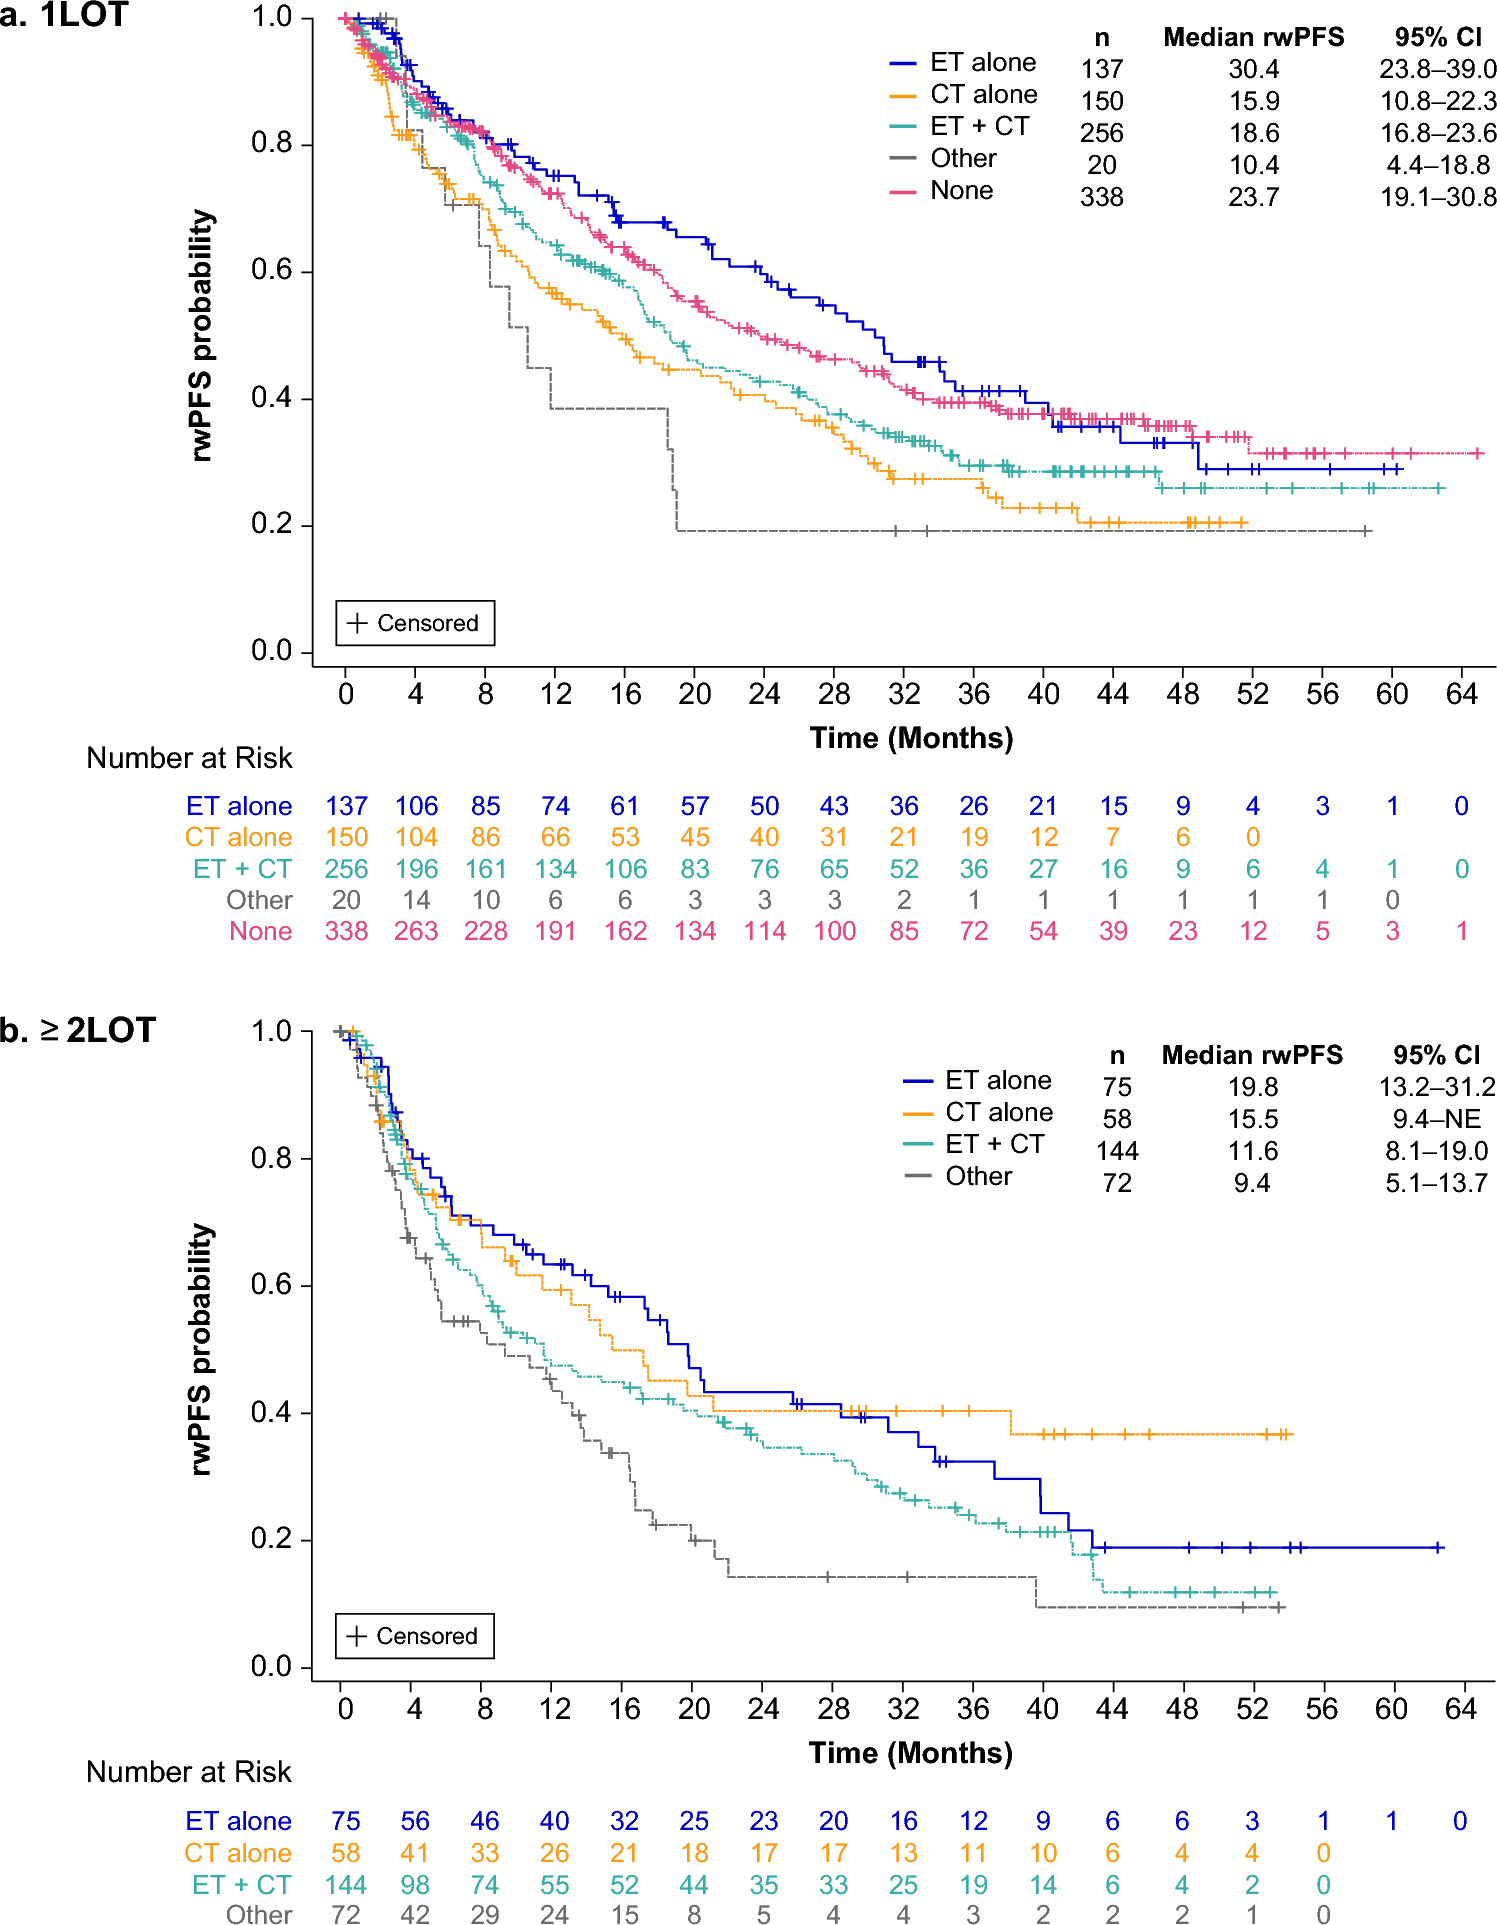
3.4.2 Treatment EfficacyIn this Bayesian NMA, treatment effects are presented as relative effect (RE) expressed as HRs with corresponding CrIs, anchored to placebo as the reference, and SUCRA values with ranking probabilities are reported for a comprehensive assessment of comparative effectiveness (Table 2, Fig. 3A, Fig. 4A, Fig. 5). A total of 21 interventions demonstrated a large treatment effect and longer OS than placebo, including 177Lu-PSMA (HR 0.55; 95% CrI 0.32–0.96), aflibercept + docetaxel (HR 0.56; 95% CrI 0.38–0.84), olaparib + abiraterone (HR 0.56; 95% CrI 0.44–0.71), cabazitaxel (HR 0.57; 95% CrI 0.38–0.85), docetaxel (HR 0.59; 95% CrI 0.41–0.87), enzalutamide + abiraterone (HR 0.59; 95% CrI 0.50–0.71), and olaparib (HR 0.59; 95% CrI 0.32–1.09). In SUCRA ranking, aflibercept + docetaxel SUCRA = 0.83 emerged as the top treatment, followed by olaparib + abiraterone SUCRA = 0.82 (rank = 2), cabazitaxel SUCRA = 0.82 (rank = 3), 177Lu-PSMA SUCRA = 0.8 (rank = 4), and enzalutamide + abiraterone SUCRA = 0.76 (rank = 5). These differences highlight nuances between pairwise comparisons and probabilistic rankings.
Table 2 Summary of findings for endpoint overall survivalFig. 3
Forest plots for endpoints overall survival and progression-free survival. ARPI androgen receptor pathway inhibitor, CrI credible interval, GMCSF granulocyte-macrophage colony-stimulating factor
Fig. 4
Surface under the cumulative ranking curve (SUCRA) plots for endpoints overall survival and progression-free survival. ARPI androgen receptor pathway inhibitor, GMCSF granulocyte-macrophage colony-stimulating factor.
Fig. 5
Bubble plot of the summary of findings for endpoint overall survival. ARPI androgen receptor pathway inhibitor, GMCSF granulocyte-macrophage colony-stimulating factor
Certainty of evidence, assessed via GRADE (Table 2, Fig. 5), varied across interventions: 14 (42%) interventions were rated as high certainty, 17 (52%) as moderate, and two (6%) as low. Notably, several of the top-ranked treatments based on SUCRA values, such as 177Lu-PSMA, aflibercept + docetaxel, olaparib + abiraterone, and olaparib, were rated as “moderate” because of imprecision or indirectness. For instance, 177Lu-PSMA was exclusively evaluated in patients with PSMA-positive mCRPC in the third-line treatment setting, with concerns such as lack of blinding, allocation concealment, and a weak comparator arm involving a second ARPI. Olaparib showed benefits across treatment lines in an unselected patient population, although its primary target remains patients with homologous recombination repair mutations. Similarly, atezolizumab + enzalutamide had “low” certainty because of study design bias and indirectness (Table 2 in the ESM). Moreover, although zibotentan + docetaxel ranked as “moderate,” with SUCRA = 0.71 and RE of 0.60 (95% CrI 0.32–1.10), suggesting a potential benefit, this was not confirmed in trials evaluating zibotentan in combination with docetaxel [62] or as monotherapy [61], emphasizing a limited efficacy.
Several interventions showed no meaningful OS improvement, with REs near or above 1.0, indicating no clinical benefit over placebo. Both HR and SUCRA analysis consistently ranked these treatments as the least effective, specifically, cabozantinib (HR 0.9; 95% CrI 0.76–1.06; SUCRA = 0.24; rank = 28), lenalidomide + docetaxel (HR 0.91; 95% CrI 0.58–1.44; SUCRA = 0.23; rank = 29), PROSTVAC (HR 1.01; 95% CrI 0.84–1.21; SUCRA = 0.13; rank = 30), PROSTVAC-GMCSF (HR 1.02; 95% CrI 0.86–1.21; SUCRA = 0.12; rank = 32), and ipilimumab (HR 1.11; 95% CrI 0.88–1.40; SUCRA = 0.07; rank = 33); however, the rating of evidence was “moderate” for most of these interventions because of imprecision or indirectness.
Pairwise comparisons among all treatments, including every possible permutation between them, were performed and depicted in a league table (Fig. 9 in the ESM).
3.4.3 Analysis of First- vs. Second- and Later-Line TreatmentsFor the endpoint OS, 16 trials with 17,016 patients and 20 treatments were included for first-line treatment, whereas nine trials involving 4845 patients and 10 treatments were analyzed for second- and further-line treatments (Fig. 6 A, C). Analysis of first-line treatments only revealed several therapies that significantly improved OS compared with placebo, with the most effective treatment in this category being aflibercept + docetaxel (HR 0.61; 95% CrI 0.40–0.94) and olaparib + abiraterone (HR 0.61; 95% CrI 0.46–0.81) (Fig. 7 A & C, Fig. 8 A & C). Other notable first-line therapies included cabazitaxel (HR 0.63; 95% CrI 0.40–0.98) and enzalutamide + abiraterone (HR 0.63; 95% CrI 0.51–0.78). These regimens consistently showed strong efficacy in improving OS with narrow CrIs. In the analysis of second- and later-line settings, only patients who had previously received an ARPI were included in the comparison. Of these, 177Lu-PSMA (HR 0.38; 95% CrI 0.18–0.80) emerged as the most effective therapy, followed by cabazitaxel (HR 0.4; 95% CrI 0.18–0.87), olaparib (HR 0.42; 95% CrI 0.19–0.91), and cabozantinib + atezolizumab (HR 0.49; 95% CrI 0.23–1.06). Second ARPIs, including abiraterone, enzalutamide, and darolutamide grouped as a single comparator termed “Second ARPI,” were notably less effective (HR 0.62; 95% CrI 0.30–1.26), regardless of whether the first ARPI was administered during the mHSPC or the mCRPC phase.
Fig. 6
Network plots for endpoints (a,b) overall survival and (c,d) progression-free survival, first and second line of treatment. ABI abiraterone, CBZC20 cabazitaxel 20 mg, DOX docetaxel, ENZA enzalutamide, GMCSF granulocyte-macrophage colony-stimulating factor, MTX mitoxantrone, OLA olaparib
Fig. 7
Forest plots for endpoints (a, c) overall survival and (b, d) progression-free survival, first and second line of treatment. ARPI androgen receptor pathway inhibitor, CrI credible interval, GMCSF granulocyte-macrophage colony-stimulating factor
Fig. 8
Surface under the cumulative ranking curve (SUCRA) plots. ARPI androgen receptor pathway inhibitor, GMCSF granulocyte-macrophage colony-stimulating factor
3.4.4 Safety OutcomesFor safety NMA, olaratumab + mitoxantrone (odds ratio [OR] 0.66; 95% CrI 0.15–2.98), testosterone (OR 0.69; 95% CrI 0.24–1.98), radium-223 (OR 0.78; 95% CrI 0.37–1.67), mitoxantrone (OR 0.79; 95% CrI 0.25–2.52), and sipuleucel–T (OR 0.87; 95% CrI 0.39–1.93) exhibited the lowest incidence rate for grade 3 or higher AEs. In contrast, the highest incidence rates were observed with cabozantinib + atezolizumab (OR 6.18; 95% CrI 1.20–31.55), 177Lu-PSMA (OR 5.29; 95% CrI 1.06–26.87), aflibercept + docetaxel (OR 4.33; 95% CrI 1.30–14.45), pembrolizumab + olaparib (OR 4.24; 95% CrI 0.85–21.36), and olaparib (OR 3.46; 95% CrI 0.66–17.93).
3.5 Findings for Endpoint Progression-Free Survival3.5.1 Principal FindingsFor endpoint PFS, the NMA included 37 studies: 34 (92%) two-arm and three (8%) three-arm studies, comprising 75 arms and 27,540 patients [14, 19,
Comments (0)