Patients and Clinical Samples
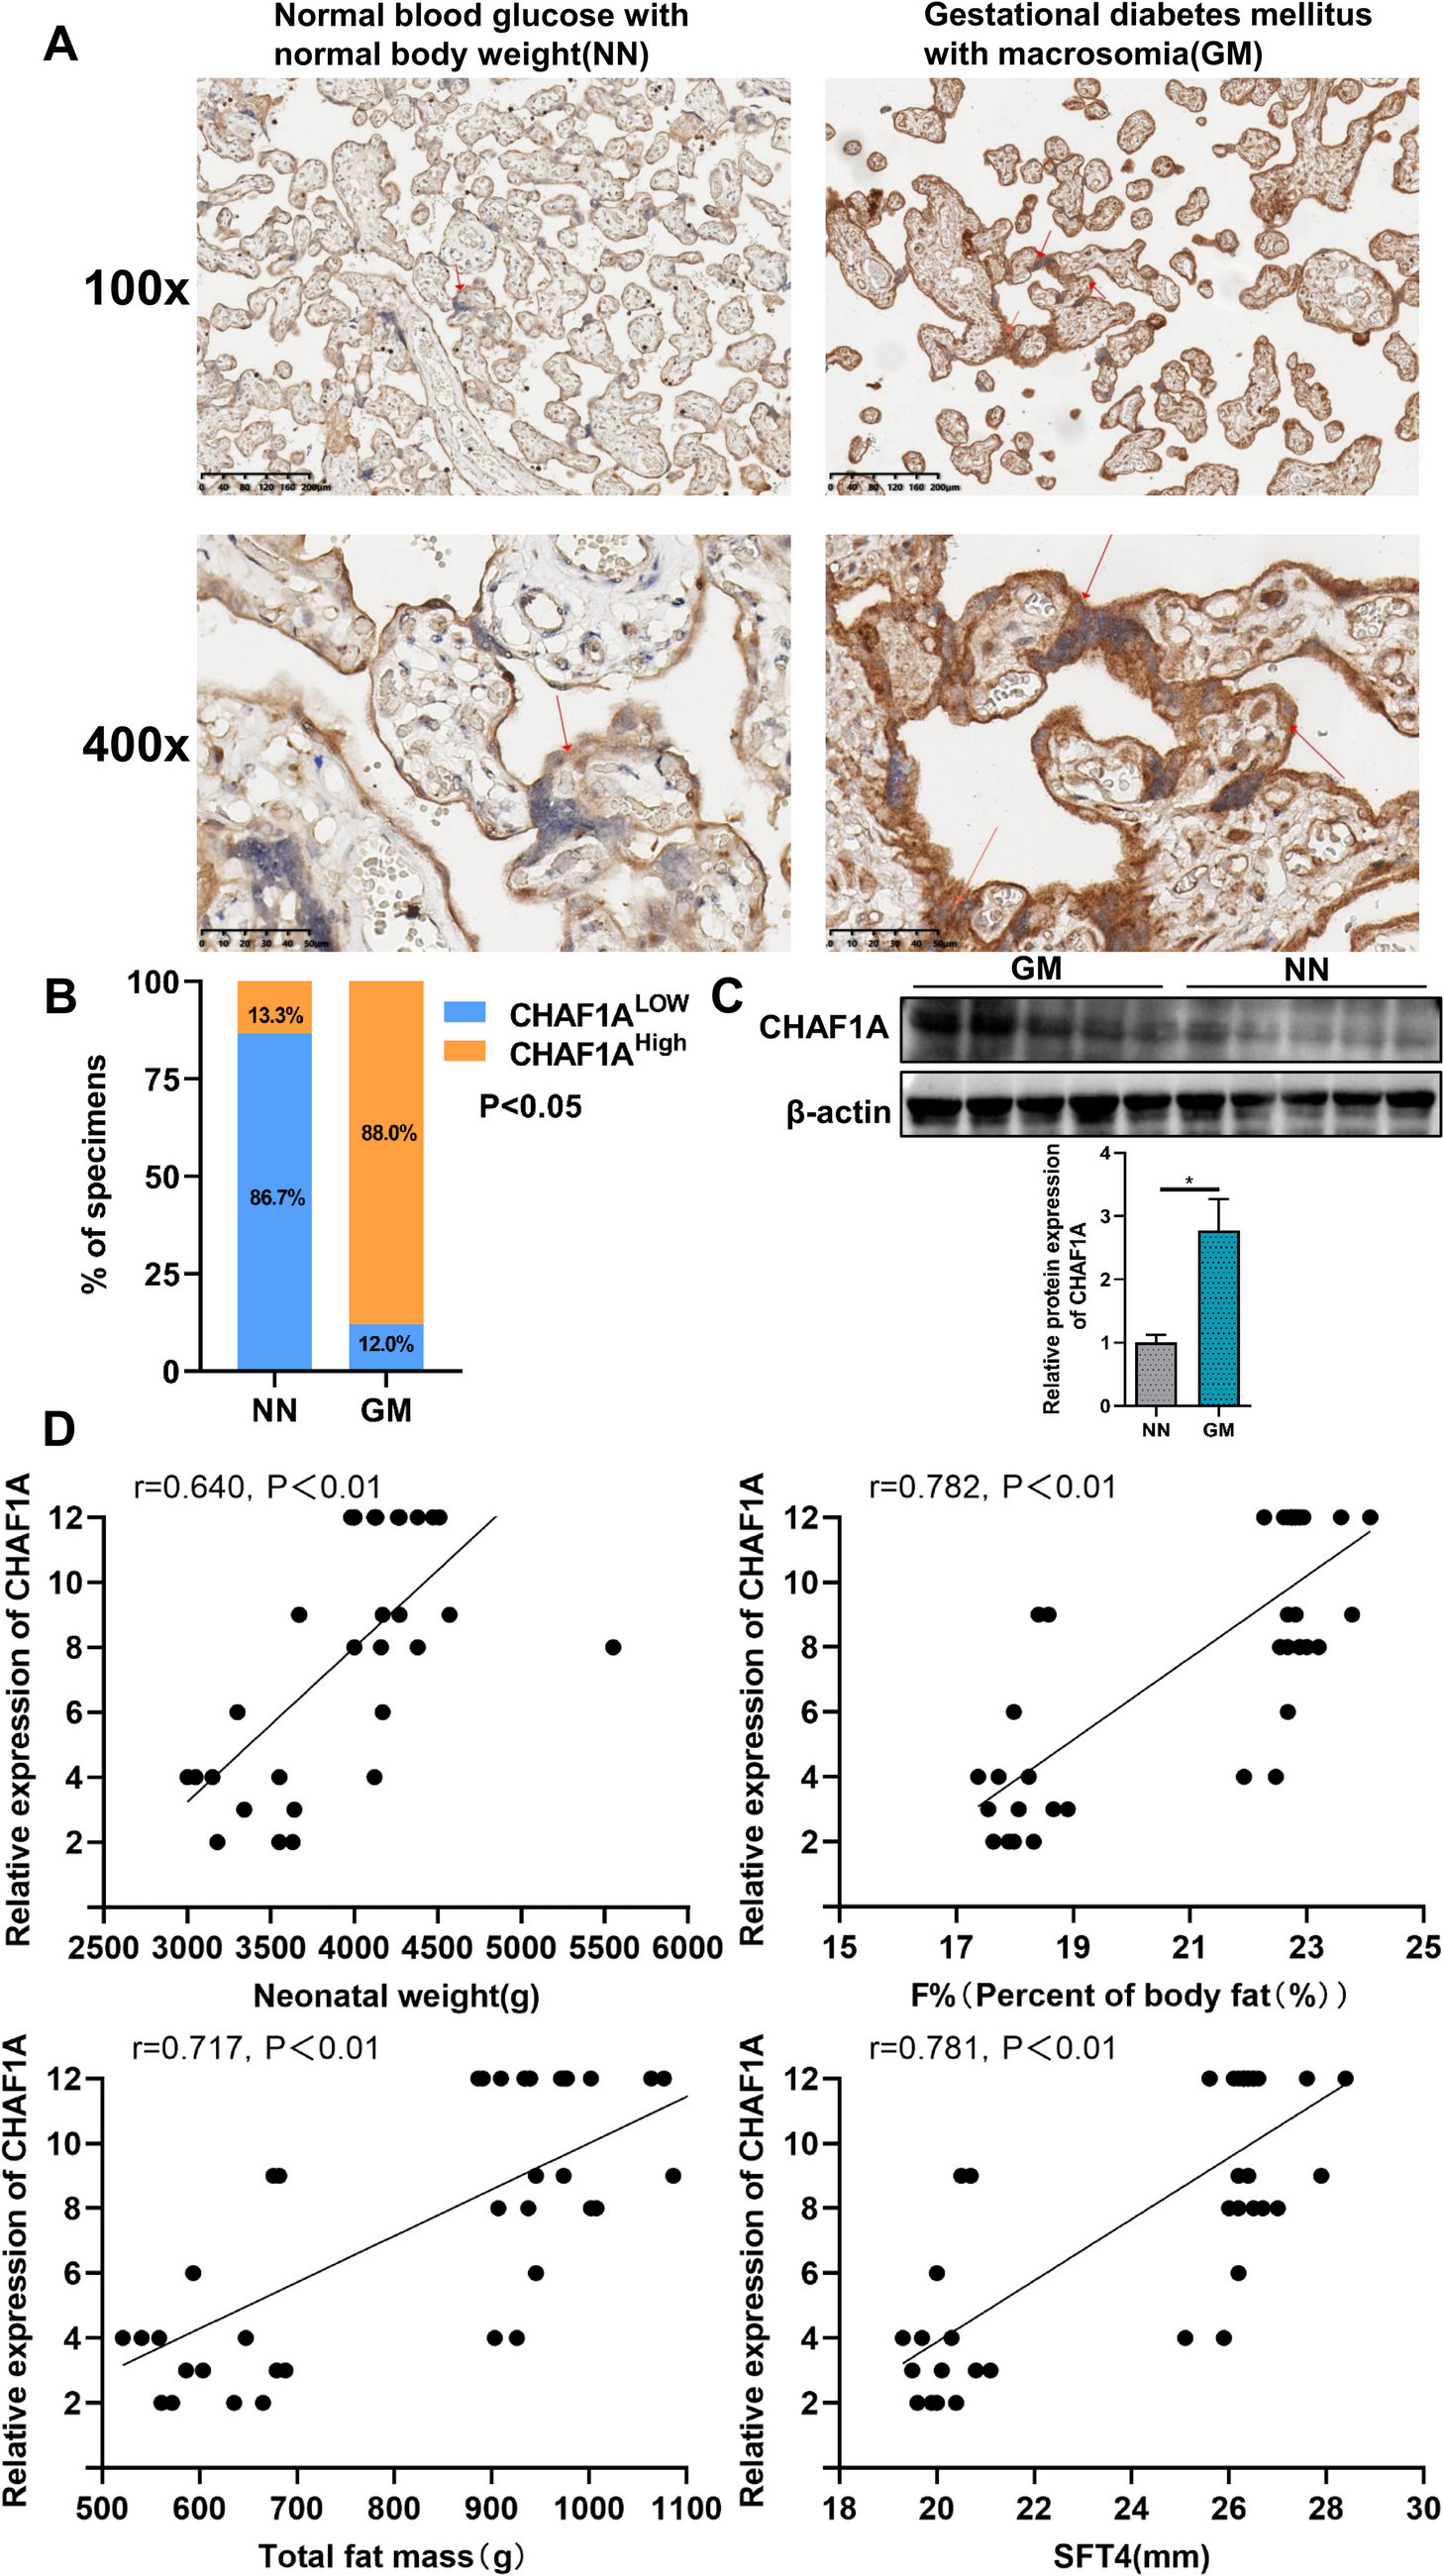
We selected patients who received regular prenatal examination and delivered by cesarean section in Changzhou Maternal and Child Health Hospital in 2023, and collected placental tissues within 15 min post-delivery, including 15 cases of normal blood glucose with normal birth weight and 25 cases of GDM with macrosomia. GDM was diagnosed using a standardized 75 g oral glucose tolerance test (OGTT) at 24–28 weeks of pregnancy according to the criteria of the International Association of Diabetes and Pregnancy Study Group [12]. All GDM patients achieved stable blood glucose control through strict diet and exercise management or insulin therapy. Macrosomia referred to a newborn with a birth weight equal to or exceeding 4000 g. The control group were those with normal OGTT results and a newborn birth weight below 4000 g. Exclusion criteria for mothers were as follows: multiple pregnancies, hypertension, history of diabetes prior to pregnancy, thyroid dysfunction, polycystic ovary syndrome, Cushing’s syndrome, pheochromocytoma, conception through assisted reproductive technology, and other pathological conditions. Exclusion criteria for infants were as follows: preterm birth, fetal growth restriction, fetal congenital anomalies, and other pathological conditions. General information is presented in Table 1.
Table 1 Primers and sequencesNeonatal Body Composition Analysis
A highly skilled neonatologist conducted anthropometric assessments on 40 newborns within the first 12 h after birth, focusing on measuring skinfold thickness at the biceps, triceps, subscapular, and suprailiac regions. Each measurement was taken three times and then averaged for accuracy. The infants’ body fat mass (FM) and body fat percentage (F%) were estimated using a modified Weststrate method [13]: SFT4 = the sum of bicipital, tricipital, subscapular, and suprailiacal skinfold thickness; body density (D) = 1.1235–0.0719 × log(SFT4); F% = (585/D-550) × 100%; FM = F% × body weight. The characteristics of the neonates are detailed in Table 2.
Table 2 The general clinical data of mothers and infants in the two groupsCell Lines and Reagents
The human visceral preadipocytes (HPA-v) was purchased from Pronosai (Wuhan, China) and cultured in RPMI 1640 (Gibco, Thermo Fisher Scientific, Waltham, MA, USA) supplemented with 10% fetal calf serum (Gibco, USA). The cell culture conditions were constant temperature at 37 °C and 5%CO2.
Immunohistochemistry (IHC)
For IHC, placental tissue sections were prepared and processed at room temperature, then deparaffinized and rehydrated for antigen retrieval. Non-specific binding was blocked with 10% goat serum. Sections were incubated with anti-CHAF1A primary antibody (17,037–1-AP, 1:200, Proteintech) overnight at 4 °C, followed by biotinylated secondary antibody for 1 h at room temperature. Immune complexes were detected using DAB, and sections were counterstained with hematoxylin. Positive expression was assessed by multiplying staining intensity and the proportion of positive cells. Staining intensity is divided into four levels: 0, no positive staining(negative); 1, light yellow (weak positive); 2, brownish-yellow (positive); 3, brownish-brown (strong positive). The proportion of positive cells is divided into four ranges: 0, no staining of cells; 1, 1–25%; 2, 26–50%; 3, 51–75%; and 4, 76–100% of cells stained. A score of ≤ 6 points is considered low expression, while a score of > 6 points is defined as high expression.
Overexpression and Knockdown of CHAF1A
CHAF1A was overexpressed or knocked down by recombinant lentiviral vectors, which incorporates an open reading frame for Green fluorescent protein (GFP). The overexpression sequence:(https://www.ncbi.nlm.nih.gov/nuccore/NM_005483.3?from=124&to=2994&report=fasta;NCBIReferenceSequence:NM_005483.3). The shRNA sequences are shown in Table 1. Cells were plated in 6-well plates with 3 × 10^5 cells per well. When the virus confluence reached about 40%, the virus solution was added, gently shaken, and incubated. After 6 to 16 h, the viral medium was replaced with normal medium. After 48 h of infection, puromycin (5 µg/mL) was added to culture for two passages, and the infection efficiency of CHAF1A was verified.
Western Blot Analysis
Tissues and cells were lysed in cold RIPA buffer with protease and phosphatase inhibitors, then centrifuged at 12,000 rpm for 15 min at 4 °C. Supernatants were collected and quantified using the BCA method. Proteins were boiled in 5 × SDS loading buffer at 100 °C for 10 min, resolved on SDS-PAGE gels, and transferred to PVDF membranes. Membranes were blocked with 5% nonfat milk and incubated with primary antibodies. The primary antibodies included: CHAF1A (1:1000), PPAR-γ (16,643–1-AP, 1:1000, Proteintech), SREBP1 (14,088–1-AP, 1:1000, Proteintech), FASN (10,624–2-AP, 1:1000, Proteintech), CEBPα(29,388–1-AP, 1:1000, Proteintech), LPL (28,602–1-AP, 1:1000, Proteintech) and β-Actin (66,009–1-Ig, 1:1000, Proteintech) as a loading control. The membranes were then incubated with HRP-conjugated secondary antibodies (A0208, 1:1000, Beyotime, Shanghai, China) for 1 h at room temperature. Immunoreactive bands were detected using an ECL system (Amersham Biosciences) and visualized with an image reader. Densitometric analysis was performed using ImageJ software.
Quantitative Reverse Transcription Polymerase Chain Reaction (qRT-PCR)
Total RNA was extracted using TRIzol reagent (Invitrogen) and subsequently reverse transcribed with the PrimeScript® RT reagent kit with gDNA Eraser (Perfect Real Time) (Takara), following the manufacturer’s protocol. GAPDH served as the endogenous control. The relative expression of target genes was calculated using the 2-ΔΔCt method and normalized to GAPDH expression. Details of the primers are provided in Table 1.
Cell Proliferation Assay
Cell proliferation was evaluated using the CCK-8 assay (CCK8, Beyotime, Shanghai, China). Cells were seeded into 96-well plates at a density of 2000 cells per well. At specific time points, 10 μl of CCK-8 solution was added to each well and incubated for 2 h to facilitate color development. Absorbance was measured at 450 nm.
Triglyceride (TG) Content Determination
Triglyceride content was detected by triglyceride content determination kit (ADS-W-ZF013, AIDISHENG, Jiangsu, China). Cells were collected into a centrifuge tube, and the supernatant was discarded after centrifugation. About 5 million cells were added to 1 mL of the extract, and the cells were broken by ultrasound (ice bath, power 200 W, ultrasonic 3 s, interval of 10 s, repeated 30 times). After centrifugation at 12000 rpm for 10 min at 4℃, the supernatant was removed, and the reagents were added sequentially according to the instructions for use to measure the absorbance at 510 nm.
$$\mathrm(\mathrm/10^4\mathrm)=((_}-_})\times_}\times_2)\div(500\times_1\div\mathrm V)\div(_}-_}))\times\mathrm D.$$
Oil Red O Staining
The Oil Red O solution was prepared by diluting the stock with distilled water (3:2 ratio), mixing, and filtering twice. Cells were fixed in 4% paraformaldehyde for 30 min, then stained with Oil Red O for 10–15 min. After differentiation with 60% isopropanol, nuclei were stained with hematoxylin, differentiated, and sections were mounted with glycerin gelatin for microscopy. Lipid droplets appeared orange to red, and nuclei were blue.
Transcriptome Sequencing Analysis
In HPA-v cells, CHAF1A was knocked down using sh1. Total RNA was extracted from differentiated cells and sequenced on an Illumina HiSeq/Novaseq/MGI2000 instrument with a 2 × 150 paired-end configuration. The transcripts were converted to fasta format, indexed, and expression levels were estimated using HTSeq (v0.6.1). Differential expression analysis was performed using the DESeq2 Bioconductor package, with Padj set at < = 0.05 to identify differentially expressed genes. GO terms were identified using GOSeq (v1.34.1), and significant differential expression genes were enriched in KEGG pathways using in-house scripts. (http://en.wikipedia.org/wiki/KEGG).
Statistical Analysis
Each experiment was performed in triplicate. Demographic data are expressed as mean ± SDs. Statistical analysis was performed using SPSS 26.0, GraphPad Prism 9.5, and ImageJ. For IHC scores, normality was verified using the Shapiro–Wilk test. Non-normal data were analyzed using the Mann–Whitney U test. The Bonferroni correction was applied for multiple comparisons in qPCR and Western blot analyses. Comparisons between two groups were made using Student’s t-test or Mann–Whitney U test, while ANOVA followed by Tukey’s HSD test was used for comparisons among three or more groups. Pearson correlation coefficient analysis was used for correlation analysis. P < 0.05 was considered statistically significant.


Comments (0)