
Remember me
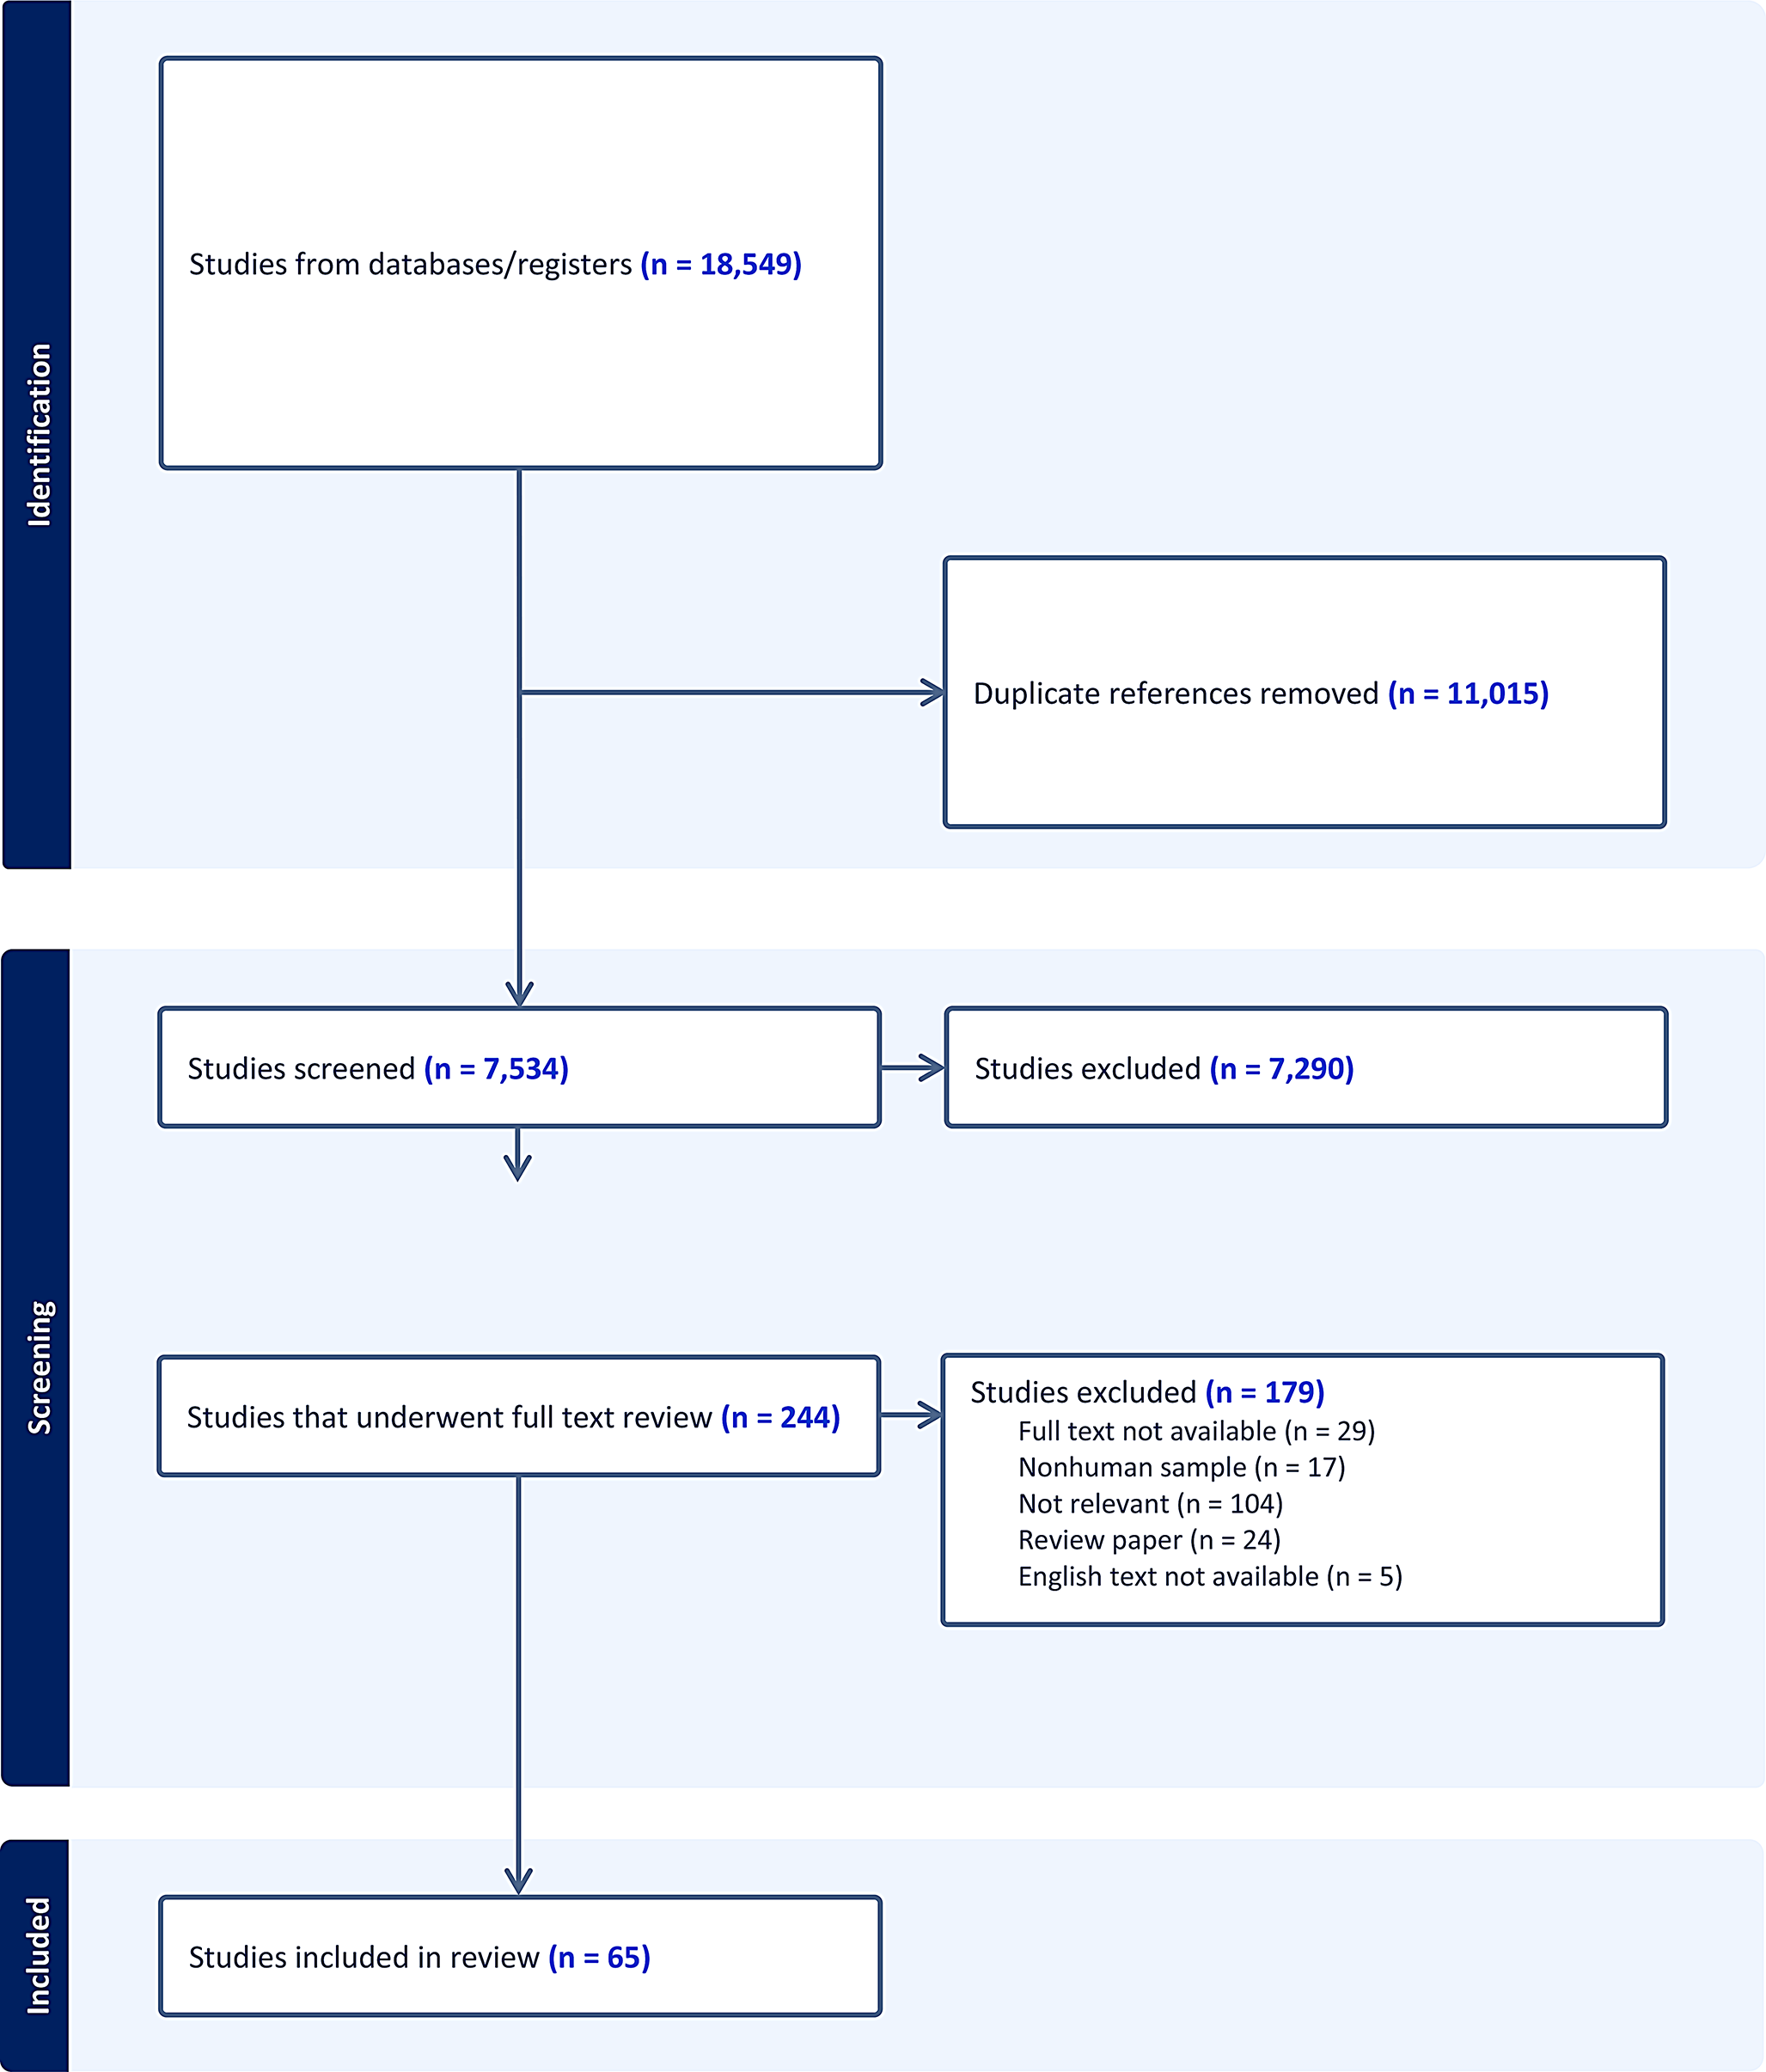


The study population comprised 845 women with PP who underwent cesarean delivery. Among them, 28% (n = 236) experienced PPH, defined as blood loss ≥ 1000 mL. As shown in Tables 1 and 2, the training cohort included 403 individuals, with 28% (n = 112) in the PPH group; the testing cohort included 174 individuals, with 28% (n = 49) in the PPH group; and the validation cohort included 268 individuals, with 28% (n = 75) in the PPH group.
Table 2 The clinical characteristics of pregnant women in the PPH and non-PPH groupBaseline characteristics revealed significant differences between the PPH and non-PPH groups. Women with PPH had a higher prevalence of risk factors, including maternal age, gravidity, parity, abortions, cesarean sections, gestational age, d-dimer, platelet, prothrombin time (PT), neutrophils, neutrophil to lymphocyte ratio, and prenatal weight (p < 0.01). Additionally, the PPH group exhibited a higher proportion compared to the non-PPH group, like ultrasound diagnosis of PAS (85% vs. 56%, p < 0.01). No significant differences were observed in gestational diabetes, gestational hypertension, assisted reproductive technology, prenatal body mass index (BMI), or pre-pregnancy BMI between the two groups (p > 0.01) (Table 2).
Screening of Clinical VariablesFive clinical variables were selected for model establishment, including ultrasound diagnosis of PAS, elevated d-dimer levels, elevated platelet count, prolonged PT, and increased neutrophil. The process of the variables ultimately selected is shown in Online Resource 2. The selected variables and specific statistical results are shown in Table 3. According to the odds ratio (OR) values (Table 3), while controlling for other variables, it was found that four variables have a promoting effect on the outcome of PPH, including ultrasound diagnosis of PAS, elevated d-dimer levels, prolonged PT, and increased neutrophil, while elevated platelet count has a negative effect on the outcome of PPH.
Table 3 Clinical variables with a P-value < 0.05 were selected through regression analysisModel MeritsUltimately, 11 machine learning prediction models were developed based on the clinical data of patients, and the performance of these models was summarized in Online Resource 3. Among the 11 machine learning models, MLP, SVM, and GradientBoosting ML models demonstrated superior performance. Besides, the performance of the ensemble model PEC was almost the same as the GradientBoosting model. In the testing cohort, the AUCs of MLP, SVM, GradientBoosting, and PEC models were 0.868(95%CI 0.803–0.933), 0.877(95%CI 0.820–0.933), 0.880(95%CI 0.816–0.943), and 0.880(95%CI 0.817–0.942) (Table 4 and Fig. 2b). In the external validation cohort, the AUCs of MLP, SVM, GradientBoosting, and PEC models was 0.778(95%CI 0.715–0.842), 0.809(95%CI 0.752–0.865), 0.810(95%CI 0.754–0.865), and 0.813(95%CI 0.756–0.871), respectively (Table 4 and Fig. 2c). Decision curve analysis showed that all four models provided a high overall net benefit, which was more advantageous than the strategies of treating all or none (Fig. 3).
Table 4 Performances of the models in the training, testing and validation cohortsFig. 2
ROC curves of the three prediction models and the resemble classifier. (a) The ROC curves of the models in training cohort. (b) The ROC curves of the models in testing cohort. (c) The ROC curves of the models in validation cohort. ROC the receiver operating characteristic curve; PEC Prediction ensemble classifier; SVM Support vector machine; MLP Multilayer perceptron
Fig. 3
DCA curves of the three prediction models and the resemble classifier. The x-axis represents the threshold probability, and the y-axis represents the net benefit. The gray line represents the assumption that all patients have PPH, and the black line represents the assumption that no patients have PPH. (a) The DCA curves of the models in training cohort. (b) The DCA curves of the models in testing cohort. (c) The DCA curves of the models in validation cohort. DCA decision curve analysis; PEC Prediction ensemble classifier; SVM Support vector machine; MLP Multilayer perceptron
Comparison of the Three ModelsThe AUC of the GradientBoosting was higher than that of MLP and SVM in the training, testing, and external validation cohorts. The AUC of the GradientBoosting was higher than that of PEC in the training, testing cohorts and almost the same as PEC model in the external validation cohorts. In the testing cohort, the ACC, SPE, and PRE of MLP were higher than those of SVM and GradientBoosting, while the SEN of GradientBoosting was higher than that of MLP and SVM. In the external validation cohort, the SEN of SVM was higher than that of MLP and GradientBoosting, while the SPE and PRE of MLP were higher than those of SVM and GradientBoosting (Table 4 and Fig. 2).
The Interpretation of the ModelsIn the summary plot in SHAP, the horizontal axis shows the impact of each feature on the prediction outcome. Points located further from the center signify a stronger influence of the feature on the predictions of the model. The vertical axis indicates the order of feature values from highest to lowest based on their overall contribution to the predictions of the model, with the top features exerting the most significant influence on the output of the model. The influence and direction of features vary across different prediction models.
As shown in the Fig. 4, the order of feature values from highest to lowest in the MLP model were ultrasound diagnosis of PAS, neutrophils, PT, d-dimer and platelet (Fig. 4a). The order of features from highest to lowest in the SVM model was ultrasound diagnosis of PAS, d-dimer, neutrophils, PT, and platelet (Fig. 4b). And the order of features from highest to lowest in the GradientBoosting model was d-dimer, ultrasound diagnosis of PAS, neutrophils, PT, and platelet (Fig. 4c). Besides, the positive SHAP values of platelet indicate a negative effect on the prediction outcome in these three models. As shown in the feature heatmap, the order of features from highest to lowest in the PEC model was d-dimer, ultrasound diagnosis of PAS, neutrophils, PT, and platelet (Fig. 5).
Fig. 4
Shap summary plots for the three prediction models. Each point corresponds to the feature value of a sample (red for higher values, blue for lower values). (a) Shap summary plots of MLP model. (b) Shap summary plots of SVM model. (c) Shap summary plots of GradientBoosting model. SVM Support vector machine; MLP Multilayer perceptron
Fig. 5
The feature importance heatmap of the models. PEC Prediction ensemble classifier; SVM Support vector machine; MLP Multilayer perceptron
Comments (0)