
Remember me
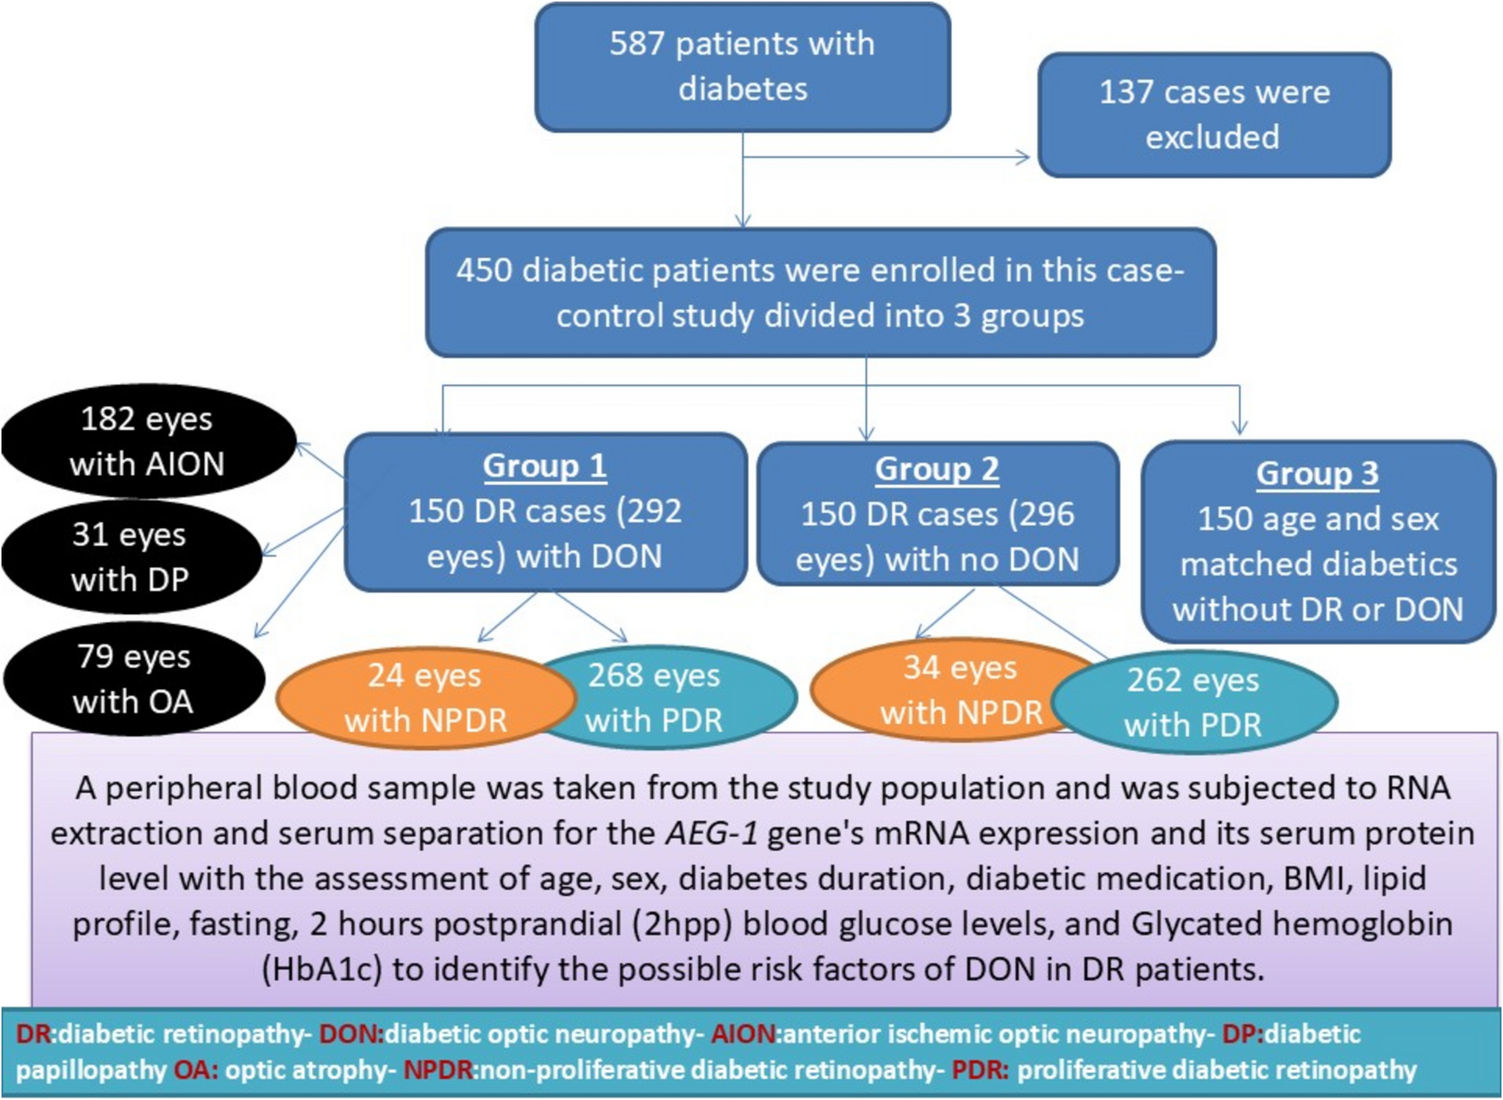

The study design was summarized in Fig. 1. The study was given the 72020BIO approval number by the Menoufia University Faculty of Medicine's ethics committee and adhered to the principles of the Declaration of Helsinki. After discussing the study's objectives and methods, the participants'oral and written informed consents were gained. This study was conducted at the Medical Biochemistry and Molecular Biology department in association with the Internal Medicine and Ophthalmology Departments and the Central Laboratory, Menoufia University, and Hospitals between November 2020 and November 2022.
Fig. 1
This case–control study constituted 450 diabetic patients categorized into three groups: Group 1 comprised 150 DR patients with any sign of DON (DP, AION, or OA). Group 2 included 150 DR patients without any sign of DON. Group 3 included 150 sex and age-matched diabetic patients without any sign of DR or DON.
Every enrolled patient underwent: 1) Thorough history-taking including the duration and the medication of diabetes, 2) Physical examination, including anthropometric measurements. By dividing body weight (kilograms) by the square of height (meters), the body mass index (BMI) was calculated manually, 3) Measurement of serum lipid profile [total cholesterol (TC), triglycerides (TG), high-density lipoprotein cholesterol (HDLc)], and low-density lipoprotein cholesterol (LDLc) 4) Measurement of Fasting blood sugar (FBG) and two hours postprandial (2hpp) blood glucose and Glycated haemoglobin (HbA1c) 5) Measurement of the AEG1 gene's mRNA expression and its serum protein level.
We used the International Clinical Diabetic Retinopathy Disease Severity Scales for grading DR (Wilkinson et al. 2003). Proliferative diabetic retinopathy (PDR) is different from non-proliferative diabetic retinopathy (NPDR) by the existence of neovascularization (NVE) at the optic disc (NVD) or elsewhere, the presence of vitreous haemorrhage or tractional retinal detachment. Diabetic optic neuropathy was categorized according to the study conducted by the Zhongshan Ophthalmic Center (Ding et al. 2005) and the study of Wang et al. 2017. In DP, the optic disc exhibits non-specific hyperemic swelling or prominent dilated vessels that resemble neovascularization on the disc surface. In AION, the optic nerve head shows hyperaemic diffuse or segmental oedema with splinter peripapillary haemorrhages. In OA, the optic nerve head is pale with the loss of its normal pink colour.
We excluded patients with (1) background of eye procedures (such as anti-vascular endothelial growth factor injection, laser photocoagulation, or vitrectomy); (2) previous ocular surgeries; and (3) patients with primary optic atrophy (OA) or OA secondary to retinal diseases, e.g., retinitis pigmentosa or glaucomatous OA.
Biochemical AnalysesBy sterile vein puncture, about 10 millilitres of venous blood was taken from every subject. The first 2 ml of blood was transferred into an EDTA tube: which was used for quantitative colorimetric determination of HA1c as a percentage of the total hemoglobin using kits supplied by Teco Diagnostics, USA. Following 8 h of fasting, one millilitre of blood was drawn into a tube with sodium fluoride to measure FBG. After two hours, a further 1 ml blood sample was collected for 2hpp blood glucose. Using the Spinreact kit from SPAIN, blood glucose was determined by the enzymatic colorimetric method (Attia et al. 2014). Then, after 12 h of overnight fasting, four millilitres of blood was placed into a clear tube, permitted to coagulate at 37 °C for 10 min and then centrifuged. The transparent serum supernatant was gathered and stored at −80 °C until the determination of serum AEG-1 protein, serum HDL, TC, TG, and LDL (El-Hefnawy et al. 2018), (Rifai and Warnick 2006). Using kits from Spinreact (SPAIN), the enzymatic colorimetric approach was used to determine the serum TC and TG levels with cataloge numbers TK41021 and TK41030 respectively. While HDL-c was assessed using a colorimetric kit from"Human Diagnostics mbH, GERMANY"with cataloge No:10084. The Friedewald equation computed LDL-c using TG, HDL-c, and TC (Dorak 2000). Serum AEG-1 was determined by ELISA using the MyBiosource® human Metadherin (AEG-1) ELISA kit, USA, with catalog No: MBS4501182.
Estimation of AEG-1 Gene's mRNA Expression by Real-Time qPCRTotal RNA ExtractionIn an EDTA-containing tube, the last 2 ml of blood was added to estimate the AEG1 gene's mRNA expression by RT-qPCR. According to the manual guide, the Whole Blood RNA Purification Mini Kit from Thermo Scientific Gene JET was used to isolate total RNAs from peripheral blood WBCs.
The RNA concentration was calculated using Beer-Lambert's formula with the Nanophotometer N60, Implen-Germany to evaluate its 260 nm and 280 nm absorbances (A260 and A280, respectively). A260/A280 is the ratio that estimates RNA purity. The 260/280 ratio of the RNA extract was between 1.8 and 2, which is accepted. Until the following step, the RNA extract was kept at −80 C.
The first-step PCR of complementary DNA (cDNA) synthesis was performed using cDNA Reverse Transcription Kits with High Capacity from Applied Biosystems, USA.
The second step in real-time PCR was carried out utilizing Applied Biosystems QuantiTect SYBR Green PCR Kit with QuantiTect primers. For the assessment of human AEG-1 mRNA levels, the subsequent forward and reverse primers were utilized.: 5′-ACGACCTGGCCTTGCTGAAGAATCT-3′ and 5′-CGGTTGTAAGTTGCTCGGTGGTAA-3′, respectively. Forward and reverse primers for glyceraldehyde-3-phosphate dehydrogenase (GAPDH) were: 5′-ATGGGGAAGGTGAAGGTCGGAGTC-3′ and 5′-GCTGATGATCTTGAGGCTGTTGTC-3′, respectively.
Each reaction mixture for each gene was conducted at a total volume of 20 µL., ten μL SYBR Green 2 × QuantiTect PCR Master Mix, one μL forward primer, one μL reverse primer, and variable amounts of cDNA and RNase-free H2O according to the initial RNA concentration to ensure a 100 ng of cDNA per reaction. PCR was conducted under the following conditions: Three minutes of incubation at 94 °C, followed by 60 cycles (at 94 °C for 30 s of denaturation, at 55 °C for 40 s of annealing, and at 72 °C for 31 s of extension) (Fig. 2a). Gene expression's relative quantitation (RQ) was performed using the Comparative ΔΔCt method (Wang et al. 2017). The mRNA level of the housekeeping gene GAPDH was used to normalize the amount of AEG-1 mRNA. A melting curve was carried out to verify the specificity of the amplification and the absence of primer dimers (Fig. 2b).
Fig. 2
a and b: Amplification plot (a) and melting curve (b) of AEG-1 mRNA gene expression
Statistical AnalysisThe data were analyzed by the IBM SPSS program version 20.0 (Armonk, NY: IBM Corp). The Kolmogorov–Smirnov test was utilized to confirm the normality of the variables'distribution. Using the Chi-square test, comparisons between groups for categorical variables were evaluated. ANOVA was used to compare the three groups under study, and a Post Hoc test (Tukey) was then utilized to compare two groups at once. For quantitative variables with abnormal distribution, the Kruskal–Wallis test was utilized. The Post Hoc test (Dunn's for multiple comparisons test) for pairwise comparison came next. Mann–Whitney test compared two groups with not normally distributed quantitative variables. The Spearman coefficient correlates the quantitative variables together. Binary Logistic Regression detects the most independent factor affecting DR with DON. The diagnostic efficacy of the markers was evaluated using the receiver operating characteristic curve (ROC), a performance of more than 50% is considered acceptable, and the best result for the test is an area of about 100%. The 5% level was used to determine the data's significance.
Comments (0)