
Remember me

Twenty-seven patients met the inclusion criteria; thirteen were treatment-naïve (TN), and fourteen recurrent (R) tumors; sixty-six tumor tissue samples were collected from this cohort. Thirty-seven samples were obtained from enhancing tissue and twenty-nine from the non-enhancing tumor. Table 1 summarizes the clinical, pathological, and radiological characteristics of the enrolled cohort.
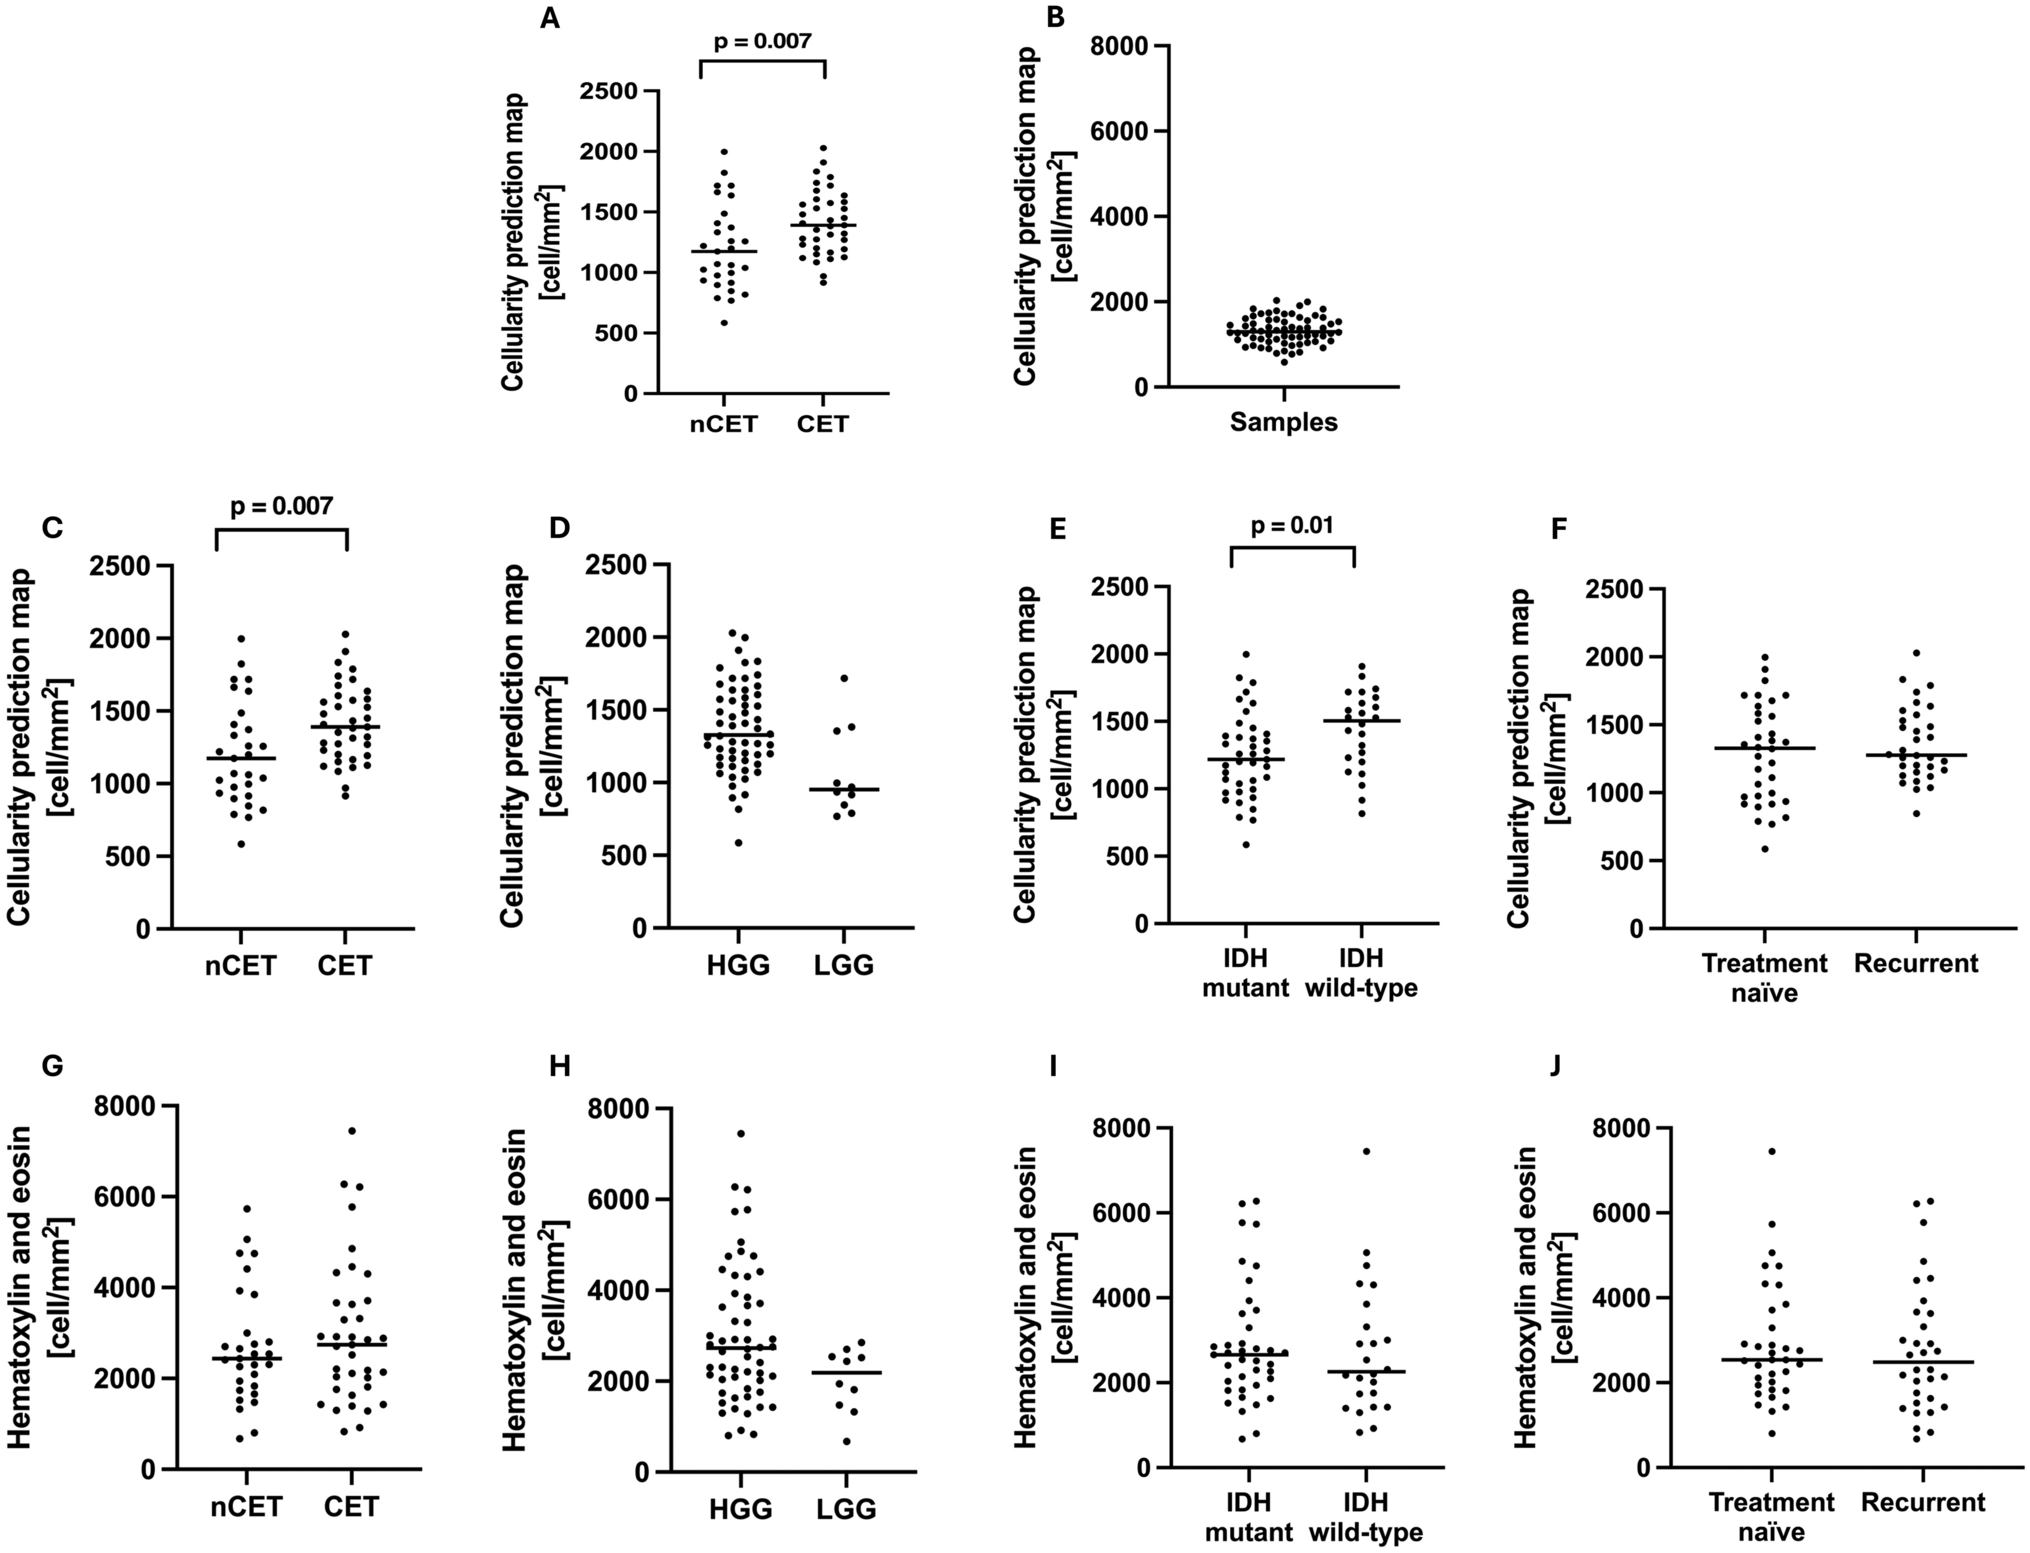
Table 1 Demographic, clinical, and radiological characteristicsDescriptive statistics and group comparisonsThe mean H&E cellularity from histology was 2856 cell/mm2 (SD 1461 cell/mm2) across all surgical samples (Fig. 1a). The mean predicted cellularity value from the MRI-derived CPM map was 1323 cell/mm2 (SD 324.4 cell/mm2) (Fig. 1b). Samples taken from CET regions showed significantly higher CPM values compared to the ones taken from nCET (mean: 1415 cell/mm2 vs 1206 cell/mm2p = 0.007, Fig. 1c). CPM values tended to be higher in HGG than in LGG (mean: 1358 cell/mm2 vs 1195 cell/mm2, Fig. 1d), although this difference was not significant. Samples from IDH wild-type tumors had significantly higher CPM values compared to those from IDH mutant tumors (mean: 1432 cell/mm2 vs 1243 cell/mm2, p = 0.01, Fig. 1e). Finally, CPM values corresponding to samples from treatment-naïve lesions and from recurrent lesions did not exhibit a statistical difference (mean 1290 cell/mm2 vs 1358 cell/mm2, Fig. 1f).
Fig. 1
Descriptive statistics of sample cellularity and group differences. A Histological cell density using H&E staining (H&E cellularity). B Cellularity predicted by the radio-pathomic maps (CPM cellularity). C–G Difference in CPM values (C) and H&E cellularity (G) between samples taken from enhancing (CET) vs non-enhancing (nCET) tumor components. D–H Difference in CPM values (D) and H&E cellularity (H) between samples taken from high- vs low-grade gliomas (HGG vs LGG). E–I Difference in CPM values (E) and H&E cellularity (I) between samples taken from IDH mutant and IDH wild-type gliomas. F–J Differences in CPM values (F) and H&E cellularity (J) between samples taken from treatment-naïve and recurrent lesions
Cellularity correlations assuming independent observationsCPM was a predictor of H&E cellularity when considering the subset of treatment-naïve lesions (TN), showing both a significant linear correlation (b = 1.4, R2 = 0.2, p = 0.009, RMSE = 1503 cell/mm2) and rank correlation (rho = 0.41, p = 0.016) (Table 2, Fig. 2b). Instead, no significant association was found between CPM values and H&E cellularity in the whole cohort (b = 0.7, R2 = 0.028, p > 0.05, RMSE 1974 cell/mm2; rho = 0.17, p > 0.05, Fig. 2a), and considering only patients with recurrent disease (b = -0.66, R2 = 0.014, p > 0.05, RMSE 3156 cell/mm2; rho = -0.12, p > 0.05, Fig. 2c).
Table 2 Comparison between radio-pathomic map and ADC statisticsFig. 2
Relationship between CPM cellularity from radio-pathomic maps, ADC values, and histological H&E cellularity. The radio-pathomic map performs well in predicting the histological cellularity of treatment-naïve tumors (B), while no association was found in recurrent patients (C) and in the whole cohort (A). Similarly, ADC was associated with histological cellularity only in the treatment-naïve cohort (E), and not in the whole cohort (D) nor the recurrent subset (F). White dots represent outliers
Similarly, the ADC map showed a significant association with H&E cellularity in treatment-naïve patients (b = 1.3, R2 = 0.22, p = 0.007; rho = -0.37, p = 0.03, Fig. 2e), while no association was found in the whole cohort (b = -0.78, R2 = 0.032, p = 0.15; rho = -0.18, p > 0.05, Fig. 2d) and in recurrent lesions (b = 0.78, R2 = 0.031, p > 0.05; rho = -0.18, p > 0.05, Fig. 2f).
The correlation between CPM and histological cellularity was not statistically different from the correlation between ADC and histological cellularity (z = 0.27, p = 0.79 in the treatment-naïve subgroup).
Cellularity correlations accounting for non-independent observationsAdditional analyses accounting for non-independent observations confirmed the results of the independent sample approach. With the linear mixed model (Supplemental Table 1), CPM values were statistically-significant predictors of H&E cellularity only in the treatment-naïve cohort (b = 1.41, p = 0.013), and not significant predictors in the whole cohort and in recurrent cases. Similarly, the association between ADC values and H&E cellularity was significant only in treatment-naïve patients (b = -1.21, p = 0.01).
The results of the iterative approach (Supplemental Fig. 1) revealed a higher correlation between CPM and H&E cellularity in treatment-naïve patients (mean rho = 0.51) than in the entire cohort (mean rho = 0.25) or in the recurrent group (mean rho = 0.22). Similarly, the association between ADC values and H&E cellularity was stronger in treatment-naïve patients (mean rho = -0.37) compared to the entire cohort (mean rho = -0.22) and to the recurrent group (mean rho = -0.08).
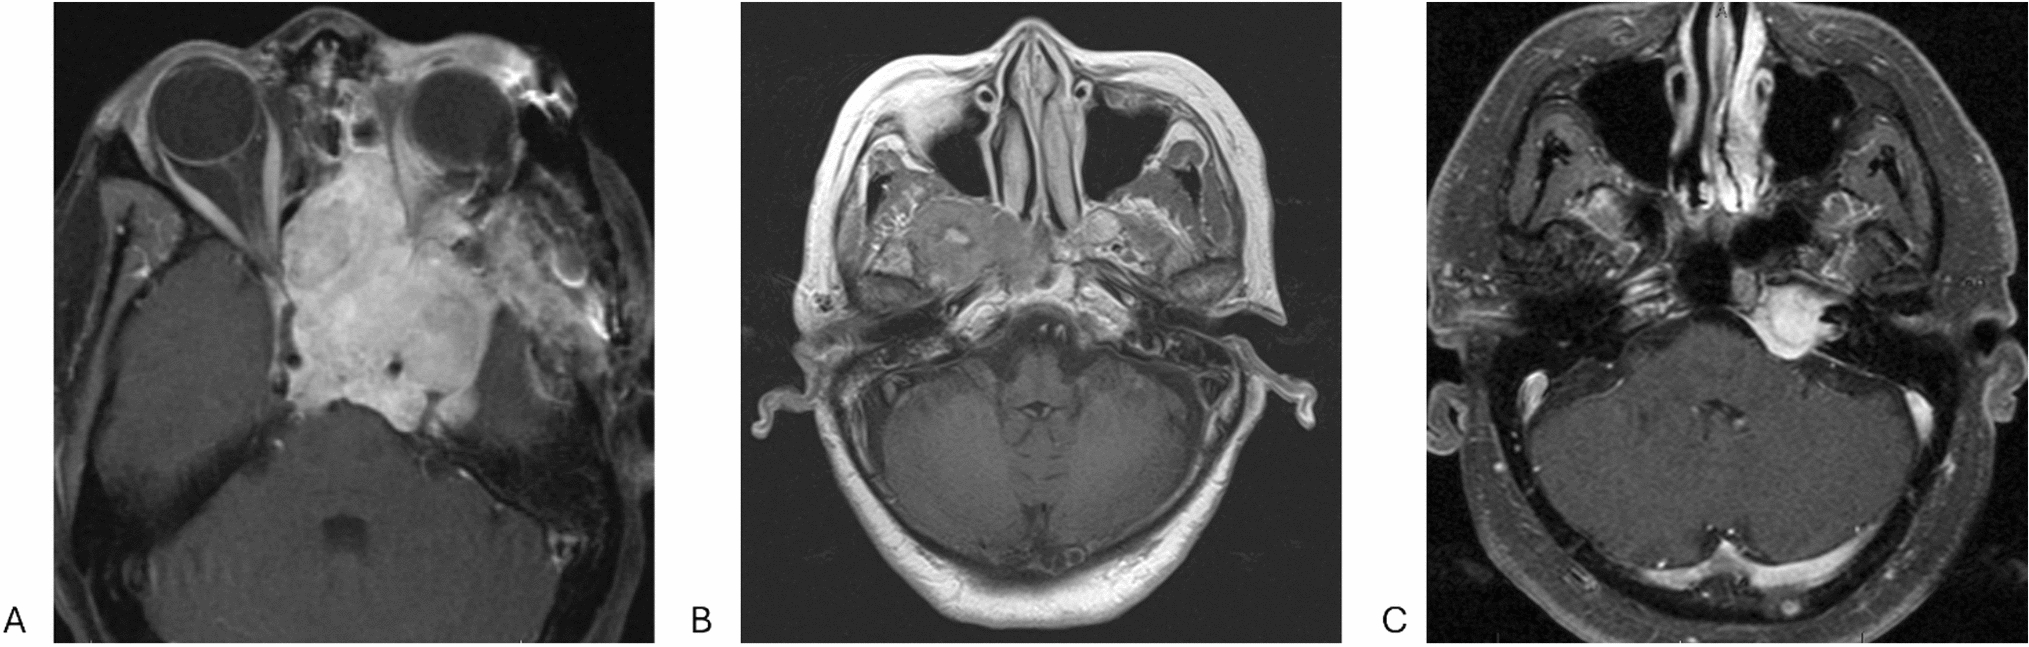
Representative casesA 86-year-old female received a first diagnosis of right temporal lobe glioblastoma (IDH wild-type, grade 4, Fig. 3a). In the targeted surgical region, obtained from contrast-enhancing tumor tissue, CPM maps exhibited relatively low values of predicted cellular density (916 cells/mm2), and ADC was 1145 × 10–6 mm2/s. Histological analysis revealed a relatively low tumor cellularity (2112 cells/mm2). A 28-year-old male had a treatment-naïve non-enhancing astrocytoma in the left fronto-parietal area (IDH mutated, 1p19q intact, grade 3, Fig. 3b). In the targeted region, CPM maps exhibited high values of predicted cellular density (1983 cells/mm2), and ADC was 1127 × 10–6 mm2/s. Histological analysis revealed a relatively high tumor cellularity (4749 cells/mm2). These two cases show successful prediction of H&E histology using CPM maps.
Fig. 3
Representative cases of good agreement between radio-pathomic maps and histology. A Sample collected from the enhancing tumor component. CPM values were low, and this finding was associated with low histological cellularity at H&E stain. Interestingly rCBV values were not elevated. B Sample taken from non-enhancing tumoral tissue. CPM values are elevated, and a high histological cellularity is found on H&E. rCBV values were increased in this region
A 35-year-old female presented with a treatment-naïve left frontal glioblastoma (IDH wild-type, grade 4, Fig. 4a). In the targeted surgical sample, obtained non-enhancing tumor tissue, CPM maps exhibited moderate values of predicted cellular density (1240 cells/mm2) and ADC was 685 × 10–6 mm2/s. However, histological analysis revealed extremely high tumor cellularity (7449 cells/mm2). A 24-year-old female received a first diagnosis of right fronto-temporo-insular astrocytoma (IDH mutated, 1p19q intact, grade 4, Fig. 4b), non-enhancing. In the targeted region, CPM maps exhibited moderate values of predicted cellular density (1354 cells/mm2) and ADC was 1992 × 10–6 mm2/s. However, histological samples revealed a high tumor cellularity (5732 cells/mm2). In these latter two cases CPM map fail to accurately predict histological cellularity.
Fig. 4
Representative cases of poor agreement between radio-pathomic maps and histology. A Sample collected from non-enhancing tumoral tissue. In this case, the CPM map fails to predict the high cellularity found in histological analysis. B Sample collected from non-enhancing tumoral tissue. The CPM map shows low values of predicted cellularity, while H&E showed a moderate to high histological cellularity. In both cases, rCBV values were not elevated
Comments (0)