Patients
The study was performed using primary human glioblastoma cell cultures isolated from intraoperative biopsy material of adult or pediatric patients diagnosed with GBM provided by the Russian Scientific Research Neurosurgical Institute named after A. L. Polenov and Almazov Medical Research Center. The study protocol was approved by the Ethics Committee of the Almazov Medical Research Center (resolution No. 2712-20 dated December 21, 2020). All patients received informed written consent to participate in the study. We confirm that all experiments have been conducted in accordance with the relevant guidelines and rules. Characteristics of patients presented in Table S1.
Cells
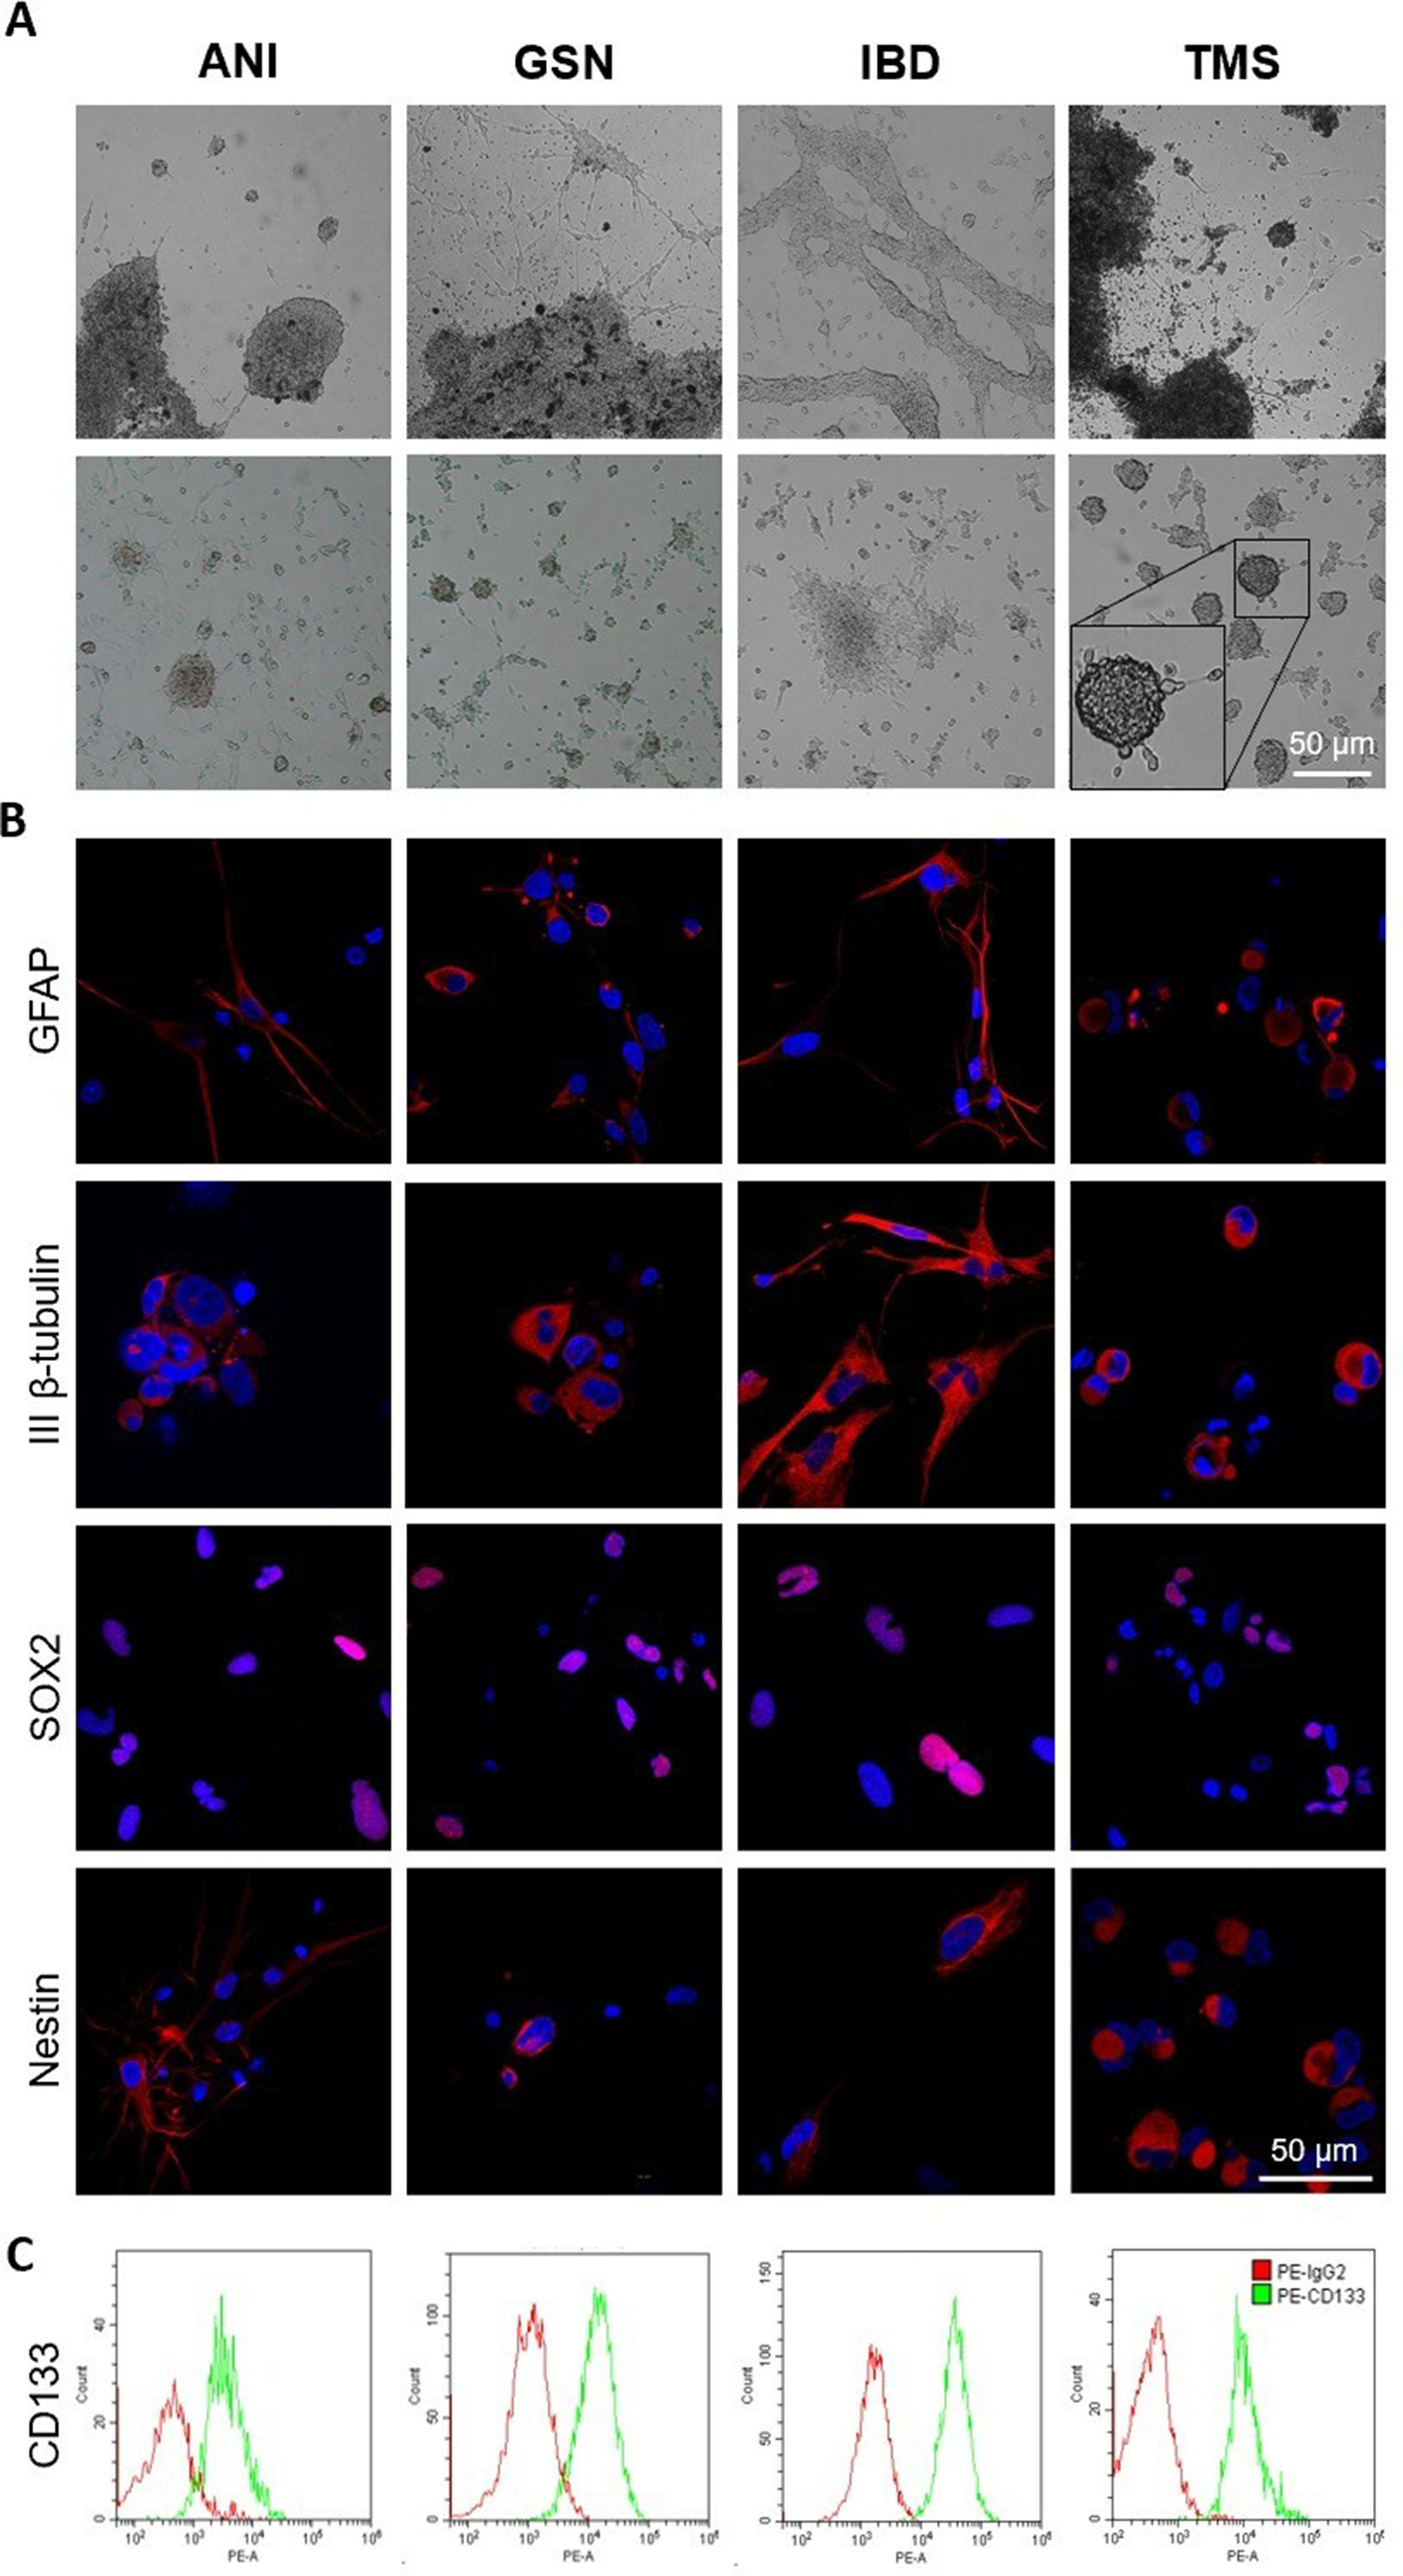
Primary glioblastoma cells (coined the abbreviations ANI, GSN, IBD, TMS) were obtained from fragments of intraoperative material from patients newly diagnosed with GBM (grade 4) without prior treatment. The cells were isolated using a three-dimensional explant model and cultured at 37 °C in a 5% CO2 in DMEM/F12 medium (Thermo Fisher Scientific, Waltham, Massachusetts, USA) containing B27 without vitamin A (50X, Thermo Fisher Scientific, Waltham, Massachusetts, USA), EGF and bFGF (20 ng/mL, PSG130-100, PSG060-100, SCI store, Moscow, Russia). For experiments, a suspension of single cells was obtained using Accutase solution (400 units/ml, Sigma-Aldrich, Burlington, Massachusetts, USA).
Confocal microscopy
The expression of mHsp70 in tumor cells was visualized by the confocal system Olympus FV3000 (Olympus, Tokyo, Japan). Cells on glass slides were incubated with FITC-mHsp70 monoclonal antibody (mAb) (SPA810, StressMarq Biosciences Inc, Victoria, Canada) for 25 min on ice in the dark. After incubation, cells were washed, fixed and mounted in Mounting Medium with 4′,6-diamidino-2-phenylindole (DAPI, 50011, Ibidi, Gräfelfing, Germany). The cells were also stained with III β-tubulin mAb (2G10, MA1-118, Thermo Fisher Scientific, Waltham, Massachusetts, USA), GFAP polyclonal antibody (PA5-16291, Thermo Fisher Scientific, Waltham, Massachusetts, USA), eFluor 570-SOX2 mAb (Btjce, 41-9811-82, Thermo Fisher Scientific, Waltham, Massachusetts, USA), and Alexa Fluor 647-Nestin mAb (10C2, 656810, BioLegend, San Diego, California, USA).
Flow cytometry and FACS
Analysis of the surface mHsp70 and CD133 expression in primary cells was performed by the CytoFLEX flow cytometer (Beckman Coulter, Brea, California, USA). Cell suspension was stained with FITC-mHsp70 mAb (SPA810, StressMarq Biosciences Inc, Victoria, Canada) or PE-CD133 mAb (293C3, ab253271, Abcam, USA) for 25 min on ice in the dark. Unstained cells and cells incubated with FITC-conjugated IgG1 mAb (679.1Mc7, A07795, Beckman Coulter, Brea, California, USA) or PE-conjugated IgG2 mAb (E5Y6Q, 62937, Cell Signaling Technology, Danvers, Massachusetts, USA) were used as a control. Based on the cytograms obtained after staining for mHsp70 each primary cell cultures were sorted into two subpopulations – high expressed mHsp70 (mHsp70High) and low expressed mHsp70 (mHsp70Low). Fluorescence activated cell sorting (FACS) was performed on S3e Cell Sorter (Bio-Rad, Hercules, California, USA). The quantitative content of subpopulations based on the gating results is presented in Table S2. Before using Hsp70 inhibitors in motility assays, their effect on cell viability was pre-tested using propidium iodide (PI, G1021-10ML, ServiceBio, Wuhan, China) staining.
Western blot
To confirm the presence of Hsp70 on the membrane, fractions (membrane and cytoplasmic) were isolated from ANI, GSN, IBD, and TMS cells using the Mem-PER™ Plus Membrane Protein Extraction Kit (89842, Thermo Fisher Scientific, Waltham, Massachusetts, USA) according to the manufacturer’s instructions. The obtained fractions were analyzed by Western blot. The samples were separated using 12% polyacrylamide gel electrophoresis and transferred to a nitrocellulose membrane (1620112, Bio-Rad, Hercules, California, USA). The proteins were incubated with primary mAb to Hsp70 (1:1000, EPR16892, ab181606, Abcam, Cambridge, UK) and visualized using the SuperSignal™ West Femto Maximum Sensitivity Substrate chemiluminescence reaction kit (34094, Thermo Fisher Scientific, Waltham, Massachusetts, USA) on ChemiDoc Touch (Bio-Rad, Hercules, California, USA).
Isolation of lipid rafts
Lipid rafts were isolated from 15 × 106 ANI, GSN, IBD, and TMS cells by nonionic detergent lysis and sucrose gradient ultracentrifugation as described in [16]. For subsequent mass spectrometric analysis, hydrolysis and trypsinolysis of the isolated proteins were performed. The peptides were then desalted on an Empore SDB-RPS microcolumn (3 M, Two Harbors, Minnesota, USA) [17], washed sequentially with solvent mixtures containing trifluoroacetic acid/ethyl acetate, and dried.
HPLC-MS/MS analysis
Samples were separated by reversed-phase chromatography using an Ultimate 3000 Nano LC System (Thermo Fisher Scientific, Waltham, Massachusetts, USA) coupled to an Orbitrap Lumos Tribrid mass spectrometer (Thermo Fisher Scientific, Waltham, Massachusetts, USA) via a nanoelectrospray source (Thermo Fisher Scientific, Waltham, Massachusetts, USA). The samples were applied to a pre-column (50 × 0.1 mm) with Reprosil-Pur 200 C18-AQ 5 m sorbent (Dr. Maisch GmbH, Tübingen, Germany) and separated at room temperature on a fused silica column (300 × 0.1 mm) with an P2000 Laser Puller (Sutter, Novato, California, USA). Mass spectrometric analysis was performed with the following settings: MS1 scan: resolution 60,000, scan range 350–1600 m/z, maximum ion injection time auto, AGC level standard, MS2 scan: resolution 15,000, HCD fragmentation with energy 30%, maximum ion injection time 80 ms, AGC level standard. The obtained mass spectrometric data were analyzed using Peaks studio 10.0 software (Bioinformatics Solutions Inc., Waterloo, Canada). Protein identification was performed by searching for correlation of mass spectra with the Uniprot SwissProt human protein sequence database with the following parameters: constant Cys modification – carbamidomethylation, variable modifications – Asn/Gln deamidation, Met oxidation and N-terminal amino group acetylation, acceptable level of false positive peptide identifications – 0.01, protease specificity – C-terminus of Arg and Lys. The deviation of the experimental mass of the peptide from the theoretical mass was allowed to be up to 10 ppm, and the deviation of the fragments mass was allowed to be up to 0.05 Da. The list of identified proteins was loaded into Cytoscape v3.10.2 platform, equipped with access to the STRING online protein search tool. The built-in yfiles-organic and remove overlaps layout algorithms were applied to the resulting network, and a network of neighborhood Hsp70 (HSPA1B) interactors was obtained.
Transwell analysis
The transwell method was used to assess tumor cells invasion characteristics. The directed movement of cells in a Transwell chamber (NEST, Wuxi, Jiangsu, China) through a permeable PET-membrane (pore diameter 3.0 μm) is driven by a concentration gradient of fetal bovine serum (FBS; HyClone, Tauranga, New Zealand). A matrigel solution (356234, Corning, New York, USA) was placed in the upper chamber before polymerization, and the remnants of the unpolymerized matrigel were removed. Then, a suspension of cells without FBS was placed in the upper chamber of the Transwell system, and a culture medium with 10% FBS was placed in the lower chamber. Additionally, Hsp70 inhibitors were added to the cell suspension: 1 µM 2-phenylethylsulfonamide/pifithrin-µ (PES; 506155, Sigma-Aldrich, Burlington, Massachusetts, USA), which binds to the substrate-binding domain of Hsp70, or 50 nM benzothiazole-acyanin (JG-98; HY-117282, MedChemExpress, Monmouth Junction, New Jersey, USA), which interacts with the nucleotide-binding domain. Native populations of ANI, GSN, IBD, TMS cells were used as controls. The concentrations are based on their preliminary testing on rat glioma C6, human glioblastoma T98G and U251 cell lines [15]. After 48 h, the membrane was fixed and stained with a 1% crystal violet solution (ServiceBio, Wuhan, China). Cells that did not pass through the membrane were removed with a cotton swab. 10 random non-overlapping fields of view were captured on each membrane (n = 3) using inverted microscope Nikon Eclipse TS100 (Nikon, Tokyo, Japan). The invasive capacity of native untreated cells was taken as 100%.
Automatic single-cell tracking
The automatic imaging system Image ExFluorer (LCI, Namyangju-si, Gyeonggi-do, Korea) was used to determine the motility characteristics of mHsp70High and mHsp70Low glioblastoma cell subpopulations. Cells were cultured in a plate pre-coated with matrigel solution (356234, Corning, New York, USA). The cell nuclei were stained with Hoechst 33,342 (R37165, Thermo Fisher Scientific, Waltham, Massachusetts, USA). Intravital imaging of cells (n ≥ 750) was carried out over 24 h, taking frames every 15 min. Hsp70 inhibitors PES (1 µM) or JG-98 (50 nM) were added to the cells immediately before the experiment. Native unsorted cell subpopulations (mHsp70Wt) were used as controls. The captured images were analyzed using NIS-Elements software with a module for automatic segmentation, quantification and tracking of individual cells: cell nuclei were recognized in the images and the coordinates of the nuclei along the X-Y axis were recorded, cell movement tracks were constructed, the mean speed and straightness of track were calculated.
Statistical processing
Statistical processing of the obtained data was carried out using GraphPad Prism 10.2.3 software (GraphPad Software Inc., California, USA). All experiments had at least three independent replicates. The data is presented as median with 95% confidence intervals (CI). The normality of data was performed using Kolmogorov-Smirnov and Shapiro-Wilk tests. All the data was distributed abnormally. The Mann-Whitney t-test was used to analyze the differences compared to the control group. The differences were considered statistically significant at P < 0.05. Statistical analysis specifics are presented in the Supplementary Information.


Comments (0)