
Remember me
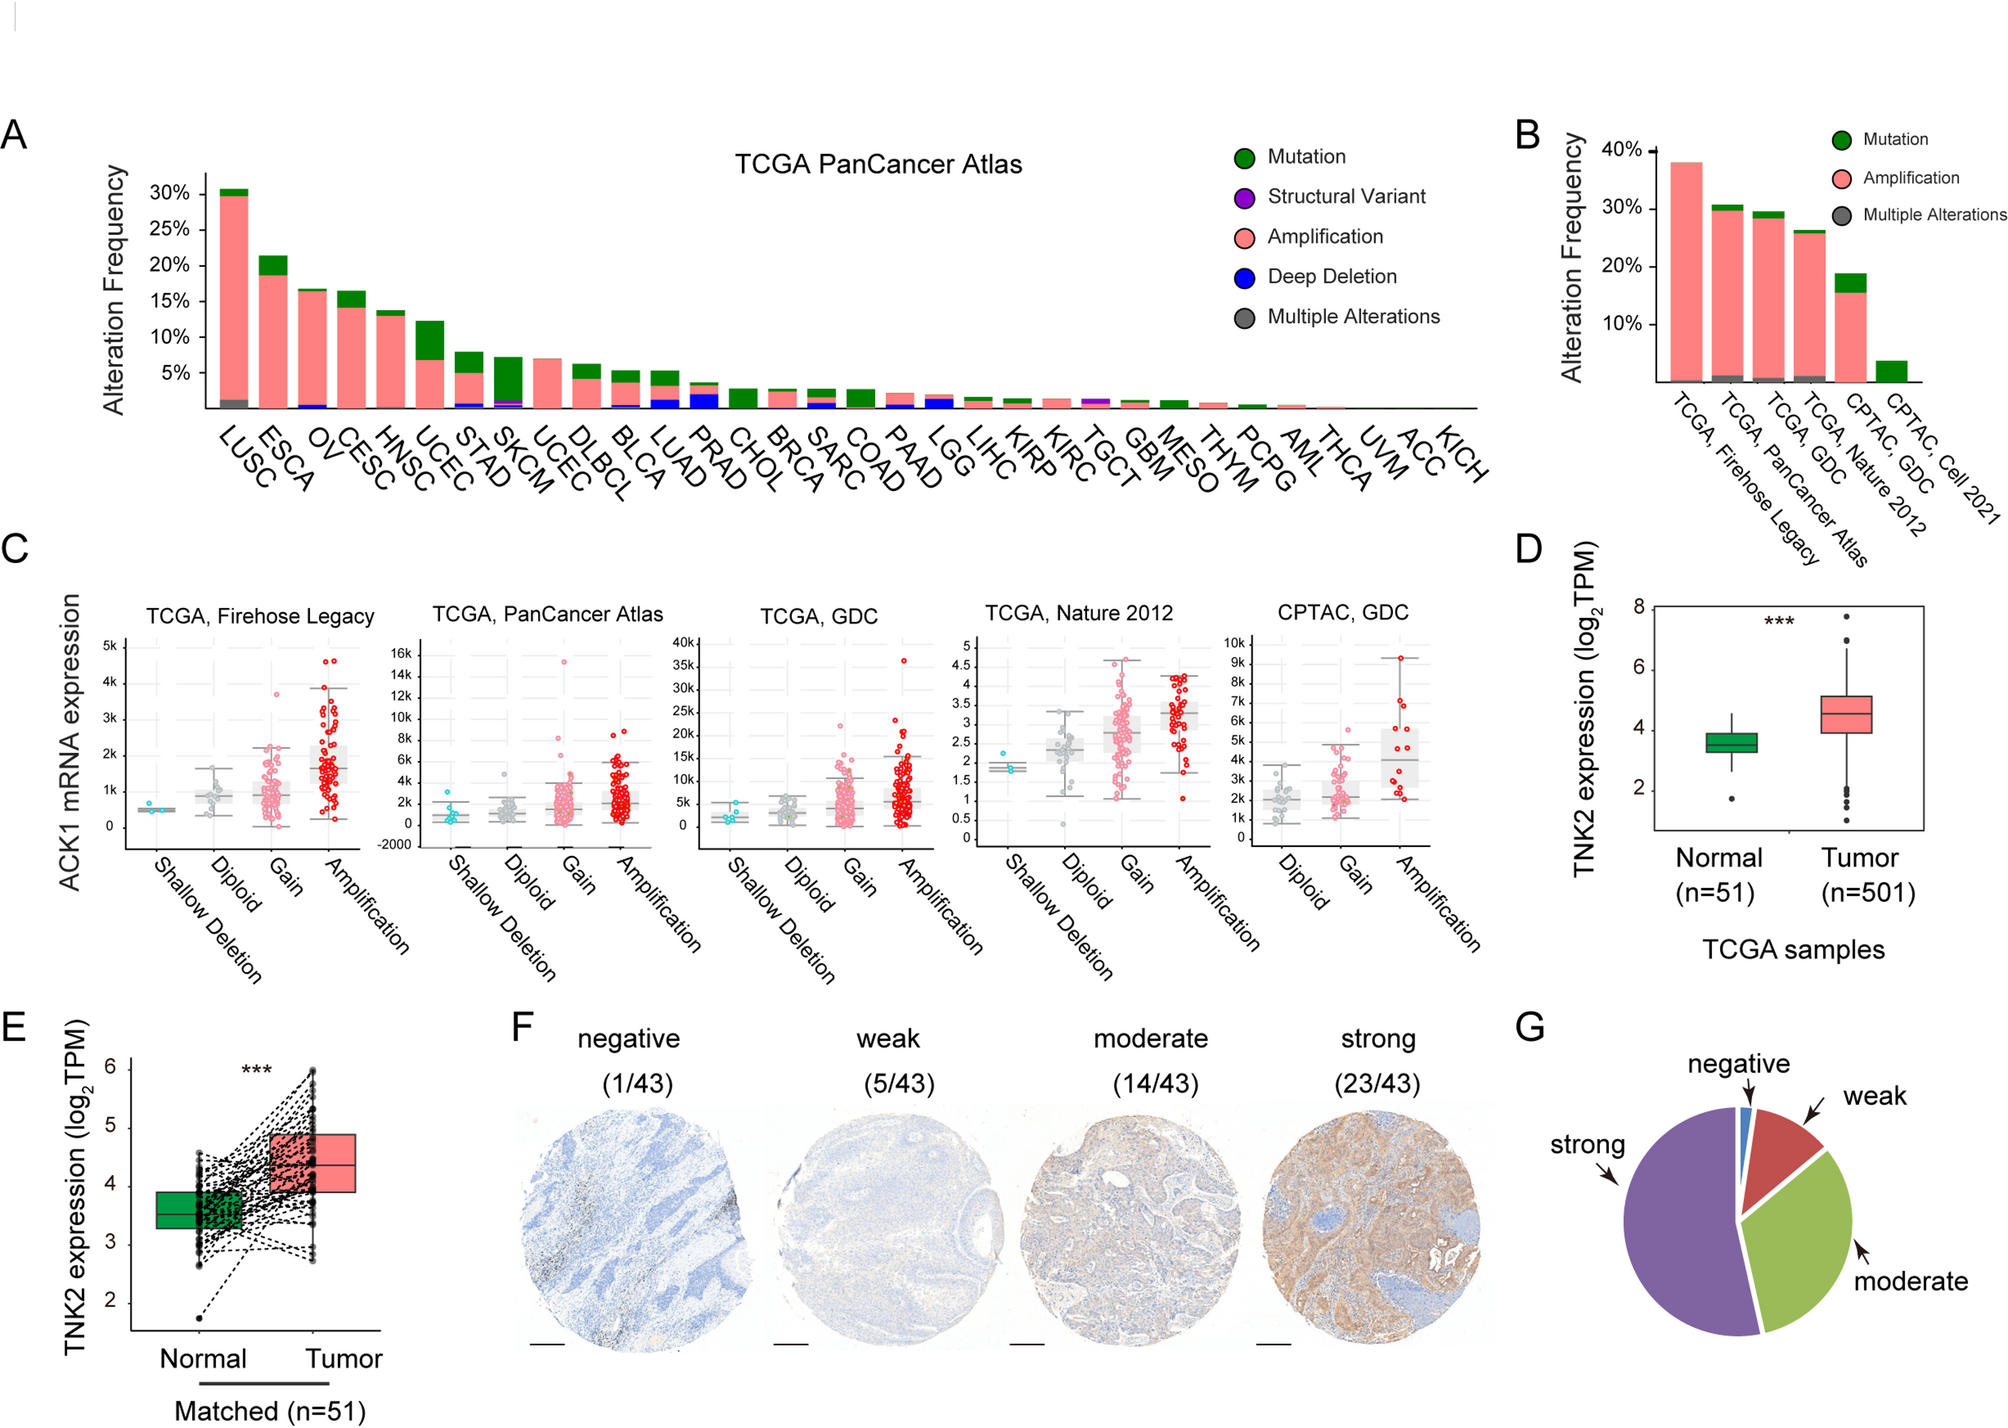

We analyzed the alterations in the ACK1 gene across various cancer types using the TCGA PanCancer Atlas dataset, as accessed through the cBioPortal website. Our analysis revealed frequent amplification of ACK1 in several cancer types, with the highest frequency observed in lung squamous cell carcinoma (LUSC) (Fig. 1A). Supporting this, ACK1 amplification was also prevalent in other LUSC datasets, including TCGA Firehose Legacy, TCGA GDC, TCGA Nature 2012, and CPTAC GDC (Fig. 1B).
Fig. 1
ACK1 is amplified and highly expressed in LUSC (A) ACK1 gene alterations across the TCGA PanCancer Atlas. (B) ACK1 gene alterations across six different LUSC datasets. (C) ACK1 mRNA expression in LUSC groups with different ACK1 gene alterations. Data from the indicated five LUSC datasets are shown. Panels (A–C) were generated using data from the cBioPortal database. (D–E) Comparison of ACK1 mRNA expression between normal and LUSC samples. Log2(TPM + 1) values were used for ACK1 mRNA expression. ***, p < 0.001 (Kruskal-Wallis test). In panel (E), matched normal and LUSC samples are connected by dashed lines. (F) Representative immunohistochemical staining images showing varying levels of ACK1 expression in LUSC samples. Staining intensities are indicated. Scale bars indicated 250 μm. (G) Pie chart illustrating the distribution of ACK1 staining intensities among LUSC samples
We analyzed ACK1 expression in LUSC samples. Consistent with amplification data, ACK1 expression was highest in samples with amplified ACK1 across five datasets exhibiting amplification (Fig. 1C). ACK1 expression was significantly elevated in LUSC samples compared to normal lung tissues in the TCGA GDC dataset (Fig. 1D). A total of 51 LUSC samples with matched normal lung tissues were further analyzed. Our results revealed that ACK1 expression was also higher in LUSC samples compared to their respective matched normal tissues (Fig. 1E). We evaluated ACK1 expression using a tissue microarray comprising 43 cases of LUSC tissues. Immunohistochemical analysis showed that 23 (53.5%) samples exhibited strong expression, 14 (32.6%) moderate, 5 (11.6%) weak, and 1 (2.3%) negative expression of ACK1 (Fig. 1F–G). Collectively, these data indicate that ACK1 is amplified and overexpressed in LUSC.
ACK1 proteins undergo LLPS independent of their kinase activityTo elucidate the mechanism underlying ACK1 function, we investigated its subcellular localization. We overexpressed ACK1-GFP fusion proteins in the LUSC cell line H2170 and observed punctate localization of the exogenous proteins (Fig. 2A). Similarly, punctate localization of ACK1-GFP was also detected in the cervical cancer cell line HeLa (Fig. 2A). Immunofluorescence staining with an anti-ACK1 antibody revealed that endogenous ACK1 also formed cytoplasmic puncta (Fig. 2C). We designed an sgRNA to knockout the ACK1 gene in the H2170 cells. Western blot analysis confirmed successful deletion of the ACK1 gene (Fig. 2B). Notably, the punctate localization was absent in the ACK1 KO cells (Fig. 2C and D), validating the specificity of the staining.
Fig. 2
ACK1 proteins undergo LLPS independent of their kinase activity (A) Subcellular localization of exogenous ACK1-GFP proteins in H2170 or HeLa cells. (B) Western blot detection of ACK1 in H2170 ACK1 KO cells. (C-D) Immunofluorescent staining of ACK1 in H2170 control and ACK1 KO cells. Puncta numbers were presented as mean ± SD. (E) Fusion of ACK1 condensates in HeLa cells expressing ACK1-GFP. Scale bars, 5 μm. (F-G) Representative images of the FRAP experiment involving ACK1 condensates in HeLa cells expressing ACK1-GFP. The fluorescence intensity was quantified and plotted. Scale bars, 5 μm. (H-I) Subcellular localization of ACK1-GFP in HeLa cells expressing ACK1 (WT)-GFP, treated with AIM-100 (10 µM) or untreated, and HeLa cells expressing kACK1 (KD)-GFP. Scale bars, 10 μm. ns, not significant; ***, p < 0.001 (unpaired two-tailed Student’s t test)
LLPS condensates, distinct from protein aggregates, are characterized by fluid-like properties and dynamic behaviors. To investigate the properties of ACK1 condensates, we performed time-lapse imaging and photobleaching experiments. Time-lapse imaging revealed that these condensates exhibited mobility and could fuse spontaneously upon contact (Fig. 2E). The photobleaching analysis demonstrated rapid fluorescence recovery in ACK1 condensates within minutes (Fig. 2F-G). These observations indicate that ACK1 undergoes LLPS with fluidic, dynamic characteristics.
To assess whether LLPS formation depends on the kinase activity of ACK1, we examined condensate formation under conditions where its kinase activity was inhibited. Remarkably, puncta formation was still observed in cells expressing wild-type ACK1 (WT) following treatment with the AIM100 inhibitor, as well as in cells expressing the kinase-dead (KD) ACK1 mutant (Fig. 2H-I). These results demonstrate that ACK1 undergoes LLPS independently of its kinase activity.
IDR1 is critical for the formation of ACK1 condensatesIDR are key structural elements that drive LLPS of proteins. Using the PONDR tool, we predicted five IDRs in ACK1: IDR1, IDR2, IDR3, IDR4, and IDR5 (Fig. 3A). To investigate their roles, we generated ACK1 mutants by individually deleting each of the five IDRs in the ACK1 (WT)-GFP expression plasmid (Fig. 3B). Our results showed that the ACK1 mutant lacking the IDR1 region (ΔIDR1), which spans amino acids 96–120, exhibited a significantly diffuse distribution, whereas mutants lacking IDR2, IDR3, IDR4, or IDR5 showed a punctate distribution similar to that of the ACK1 (WT)-GFP (Fig. 3C-D). Notably, the ΔIDR(2–5) mutant, which lacks regions IDR2 through IDR5, retained the punctate distribution, while the mutant with deletions of all five IDRs (ΔIDR(1–5)) displayed a markedly diffuse distribution (Fig. 3C-D). These findings suggest that the IDR1 region plays a critical role in the formation of ACK1 condensates.
Fig. 3
The critical IDR for ACK1 condensate formation (A) Intrinsic disorder of ACK1. The y-axis represents the PONDER VSL2 score (Ponder score), and the x-axis represents amino acid position. The five predicted intrinsically disordered regions (IDRs 1–5) within ACK1 are indicated by thick black lines. (B) Diagrams of ACK1 mutants with deletions in individual IDRs (ΔIDR1, ΔIDR2, ΔIDR3, ΔIDR4, ΔIDR5) and mutants with deletions in multiple IDRs (ΔIDR(2–5), ΔIDR(1–5)). (C–D) The indicated ACK1 mutants from panel B were fused to GFP and transfected into HeLa cells for subcellular localization analysis. The number of ACK1 puncta per cell was quantified. (E–G) Diagrams of ACK1 mutants with deletions within the IDR1 region. These mutants were transfected into HeLa cells for subcellular localization analysis, and the number of ACK1 puncta per cell was quantified. Scale bars, 10 μm. ns, not significant; ***, p < 0.001 (unpaired two-tailed Student’s t-test)
We further dissected the IDR1 region into two segments: IDR1-1 (amino acids 96–120) and IDR1-2 (amino acids 121–156), and generated mutants with each segment deleted individually (ΔIDR1-1 and ΔIDR1-2) (Fig. 3E). The ΔIDR1-2 mutant failed to form condensates, while the ΔIDR1-1 mutant retained the ability to form condensates (Fig. 3F-G). Next, we divided the IDR1-2 segment into three subregions: IDR1-3 (amino acids 121–131), IDR1-4 (amino acids 132–142), and IDR1-5 (amino acids 143–156), and generated mutants with each subregion deleted individually (ΔIDR1-3, ΔIDR1-4, and ΔIDR1-5) (Fig. 3E). We found that the ΔIDR1-5 mutant failed to form condensates, while the other mutants (ΔIDR1-3 and ΔIDR1-4) retained the ability to form condensates (Fig. 3F-G). These results indicate that the region spanning amino acids 143–156 is critical for the IDR1-mediated promotion of condensate formation.
IDR1 is capable of inducing droplet formationTo further investigate the phase separation ability of the IDR1 region, we performed an optoDroplet assay. In this assay, we constructed clones expressing IDR1 fused to photoactivatable Cry2 and mCherry (IDR1-mCherry-Cry2). Following transfection into cells, Cry2 self-association was induced by exposure to blue light, which increases the local concentration of the fused proteins. Proteins capable of phase separation are expected to form liquid-like droplets upon light stimulation, while proteins unable to phase separate should remain diffuse (Fig. 4A). We observed that the IDR1-Cry2-mCherry fusion protein formed droplets upon light exposure, while the Cry2-mCherry control did not (Fig. 4B).
Fig. 4
IDR1 Induces LLPS (A) The diagram illustrating the OptoDroplet assay. (B) IDR1 within ACK1 exhibits phase separation in the OptoDroplet assay. IDR1 was fused with mCherry and Cry2, and the constructs were transfected into HeLa cells. Images were captured at the indicated time points after blue-light stimulation. Scale bars, 10 μm. (C) Purified IDR1-GFP proteins from bacteria were visualized by Coomassie Blue staining. (D–E) Representative images of turbidity in GFP (10 µM) or IDR1-GFP (10 µM) solutions with or without 25% PEG-6000. The plot shows mean optical density at 600 nm (OD600) ± SD from three replicate samples. (F-G) IDR1-GFP droplet formation (10 µM) in buffer, in the absence or presence of PEG-6000. Scale bars, 10 μm. Droplet numbers were presented as mean ± SD from three replicate samples. **, p < 0.01; ***, p < 0.001 (unpaired two-tailed Student’s t-test). (H) Fusion of IDR1-GFP droplets in vitro. Scale bars, 5 μm. (I) Representative images of IDR1-GFP droplet formation (20 µM) in buffer with various concentrations of NaCl. ns, not significant; ***, p < 0.001 (unpaired two-tailed Student’s t-test)
We also constructed clones expressing IDR1 fused to GFP and purified the IDR1-GFP proteins in a bacterial expression system for in vitro droplet formation assays (Fig. 4C). IDR1-GFP or GFP proteins were added to a 25% polyethylene glycol-6000 (PEG-6000) solution, which mimics the crowded cellular environment. We found that IDR1-GFP proteins caused the solution to become opaque, whereas the GFP solution remained clear (Fig. 4D-E). We observed the droplet formation under the microscope. In the absence of PEG-6000, IDR1-GFP did not form spherical droplets (Fig. 4F-G). However, the addition of PEG-6000 significantly enhanced droplet formation (Fig. 4F-G). Live imaging revealed that these droplets could fuse (Fig. 4H). These results demonstrate that IDR1 is capable of inducing droplet formation. Furthermore, we observed that increasing the NaCl concentration inhibited droplet formation (Fig. 4I-J), suggesting that electrostatic interactions play a role in mediating the droplet formation.
ACK1 condensates promote STAT5 signaling likely through recruiting NCK1 and NCK2We investigated the effects of ACK1 overexpression on downstream signaling pathways, specifically AKT and STAT3, which are known substrates of ACK1 5,18,19. In H2170 cells overexpressing ACK1, we did not observe alterations in the phosphorylation of AKT (pAKT) or STAT3 (pSTAT3) (Fig. 5A). However, we detected a significant increase in pSTAT5 signal (Fig. 5A). To further explore the role of ACK1 in STAT5 activation, we co-transfected cells with both ACK1 and STAT5 plasmids. Consistent with our previous findings, ACK1 overexpression enhanced the phosphorylation of exogenous STAT5 (Fig. 5B). To determine whether this activation was kinase-dependent, we co-expressed STAT5 with either a constitutively active (CA) or KD mutant of ACK1. Only the CA mutant induced phosphorylation of STAT5, while the KD mutant did not (Fig. 5C). Furthermore, treatment with AIM-100, a specific inhibitor of ACK1 kinase activity, abolished the p-STAT5 signal induced by ACK1 (Fig. 5D). These results demonstrate that ACK1 promotes STAT5 signaling through its kinase activity.
Fig. 5
ACK1 condensates recruits NCK1 and NCK2 and promote STAT5 signaling (A) H2170 cells expressing ACK1 (WT) or (IDRmut)-GFP were collected for western blot detection. (B) HeLa cells were co-transfected with STAT5-FLAG and GFP, ACK1 (WT)-GFP, or ACK1 (IDRmut)-GFP plasmids. (C) HeLa cells were co-transfected with STAT5-FLAG and ACK1 (WT)-, (CA)-, or (DN)-GFP plasmids. (D) HeLa cells were co-transfected with STAT5-FLAG and GFP or ACK1 (WT)-GFP plasmids. Cells co-transfected with STAT5-FLAG and ACK1 (WT)-GFP were treated with AIM100 (10 µM, 3 h) or untreated. (E) The ACK1-interacting proteins identified in the two studies, based on immunoprecipitation (IP) and proximity-dependent biotinylation, respectively, were intersected, and the common genes are indicated. (F) HeLa cells were co-transfected with either GFP or ACK1 (WT)-GFP plasmids and expression plasmids for myc-HSP90AA1, myc-NCK1, or myc-NCK2. These cells were co-stained with GFP and myc antibodies. (G) HeLa cells were co-transfected with GFP, ACK1 (WT)-GFP, ACK1 (IDRmut)-GFP, or ACK1 (DN)-GFP plasmids, along with myc-NCK1 expression plasmids. Cells transfected with ACK1 (WT)-GFP and myc-NCK1 were treated with AIM-100 (10 µM, 3 h). These cells were co-stained with GFP and myc antibodies. Panel (F-G): The green and red lines in the graphs represent the fluorescence intensity for GFP or ACK1-GFP and HSP90AA1, NCK1, or NCK2, respectively, along the freely positioned arrow. Scale bars, 10 μm. (H) NCK1 and NCK2 were silenced through shRNA (shNCK1&NCK2) in H2170 cells expressing ACK1 (WT)-GFP. mRNA levels of NCK1 and NCK2 were assessed by RT-PCR. shCtrl indicated the control shRNA. (I) Western blot analysis of the indicated H2170 cells using the specified antibodies.
We investigated the impact of ΔIDR1-5, a mutant defective in condensate formation, which we henceforth refer to as IDRmut. We observed that overexpression of the ACK1 (IDRmut) failed to promote both the endogenous and exogeneous pSTAT5 signaling (Fig. 5A-B). This loss of p-STAT5 signaling was not due to a lack of ACK1 kinase activity, as the IDRmut exhibited Tyr284 autophosphorylation levels comparable to ACK1 (WT) (Fig. 5B). These findings suggest that the failure to form condensates accounts for the loss of p-STAT5 signaling in the mutant.
We investigated whether ACK1 condensates influence the organization of signaling components by analyzing proteins interacting with ACK1 through two distinct interaction datasets: immunoprecipitation [26] and proximity-dependent biotinylation [27]. Three proteins—NCK1, NCK2, and HSP90AA1—were detected in both datasets (Fig. 5E). When expressed alone, NCK1, NCK2, or HSP90AA1 localized diffusely in the cytoplasm. However, in cells expressing ACK1 (WT), both NCK1 and NCK2 exhibited punctate localization and colocalized with ACK1 condensates (Fig. 5F), whereas the subcellular localization of HSP90AA1 remained unaffected (Fig. 5H).
Given NCK1 and NCK2 are highly conserved proteins, sharing similar protein structures and 68% similarity in the amino acid sequences [28]we selected NCK1 for further analysis. We found that the punctate localization of NCK1 was not observed in cells expressing ACK1 (IDRmut) (Fig. 5G), while NCK1 were recruited to the condensates in cells expressing the KD mutant or in cells expressing ACK1 (WT) treated with AIM100 (Fig. 5G). These results indicated that ACK1 promotes the recruitment of NCK1 and NCK2 to condensates via its IDR, independent of its kinase activity. NCK1 and NCK2 are adaptor proteins that facilitate the organization of molecular complexes to regulate cellular functions, such as signal transduction [29]. To examine the roles of NCK1 and NCK2 in ACK1-mediated STAT5 signaling, we silenced NCK1 and NCK2 in ACK1-overexpressing cells (Fig. 5H). Notably, knockdown of NCK1 and NCK2 significantly attenuated ACK1-induced STAT5 phosphorylation (Fig. 5I). These results suggest that ACK1 promotes STAT5 signaling by recruiting NCK1 and NCK2 to condensates.
ACK1 condensates promote the STAT5 transcriptional activity, cell growth and migrationPhosphorylation of STAT5 facilitates its nuclear import and subsequent transcriptional activity [30]. Consistent with the observed effect in pSTAT5, we found that ACK1 (WT) promoted the nuclear localization of STAT5, whereas ACK1 (IDRmut) failed to do so (Fig. 6A). To assess the role of ACK1 in STAT5-mediated transcriptional activation, we performed a STAT5-responsive reporter assay using the β-casein gene promoter cloned upstream of a luciferase reporter. As expected, overexpression of ACK1 (WT) resulted in approximately a 4-fold increase in transcriptional activity, whereas ACK1 (IDRmut) had no such effect (Fig. 6B).
Fig. 6
ACK1 condensates promote STAT5 transcriptional activity, cell growth and migration (A) The β-casein promoter reporter and ACK1 (WT) or (IDRmut) overexpression constructs were co-transfected into HeLa cells, and luciferase activity was measured. Data are presented as mean ± SD from three replicate experiments. ***, p < 0.001 (unpaired two-tailed Student’s t test). (B) HeLa cells were co-transfected with STAT5-FLAG and GFP or ACK1-GFP constructs, followed by co-staining with GFP and p-STAT5 antibodies. Scale bars, 10 μm. (C) PCA of RNA-seq data from H2170 cells expressing GFP (Control), ACK1 (WT)-GFP, or ACK1 (IDRmut)-GFP. (D) GSEA plots showing activation of the TTCYNRGAA_STAT5B_01 gene set in H2170 cells expressing ACK1 (WT)-GFP, but not ACK1 (IDRmut)-GFP, compared to Control cells. The NES (Normalized Enrichment Score) and p values were indicated in the plots. (E) The TCGA LUSC samples were divided into high and low ACK1 expression groups based on the median ACK1 expression level. STAT5 target gene set scores for each sample were calculated using the GSVA() method and compared between the two groups. (F–G, J–K) Representative images of colony formation in control and ACK1 KO H2170 cells, or H2170 cells expressing GFP, ACK1 (WT)-GFP, or ACK1 (IDRmut)-GFP. The number of cell colonies was quantified and presented as mean ± SD from three replicates. (H–I, L–M) Representative images of migration in the indicated cells using a wound-healing assay. Wound healing rates are presented as mean ± SD from three replicates. ns, not significant; **, p < 0.01; ***, p < 0.001 (unpaired two-tailed Student’s t test)
We further explored the changes in gene expression mediated by ACK1 through RNA-seq. Principal component analysis (PCA) revealed a clear distinction between the control, ACK1 (WT), and (IDRmut)-expressing cells (Fig. 6C). GSEA indicated that a STAT5 target gene set were upregulated in cells overexpressing ACK1 (WT), but not in those expressing ACK1 (IDRmut) (Fig. 6D). We analyzed LUSC samples from the TCGA GDC dataset using the STAT5 target gene set and found that samples with higher ACK1 expression showed significantly elevated STAT5 target gene set scores (Fig. 6E). Collectively, these findings demonstrate that ACK1 condensates promote STAT5 transcriptional activity.
Given that STAT5 regulates genes involved in cell growth and migration [31]we investigated the role of ACK1 in these processes. We assessed cell proliferation using a colony formation assay and found that ACK1 deletion significantly reduced the number of colonies (Fig. 6F-G). Cell migration was evaluated through a scratch wound assay, which revealed that ACK1 deletion markedly suppressed cell migration (Fig. 6H-I). These results indicate that ACK1 is essential for both cell growth and migration. Next, we compared the cellular activities of cells expressing ACK1 (WT) and (IDRmut). Consistent with the critical role of ACK1, overexpression of ACK1 promoted both cell growth and migration (Fig. 6J-M). In contrast, overexpression of IDRmut had no such effects (Fig. 6J-M). These findings suggest that ACK1 condensates are involved in promoting cell growth and migration.
Comments (0)