
Remember me
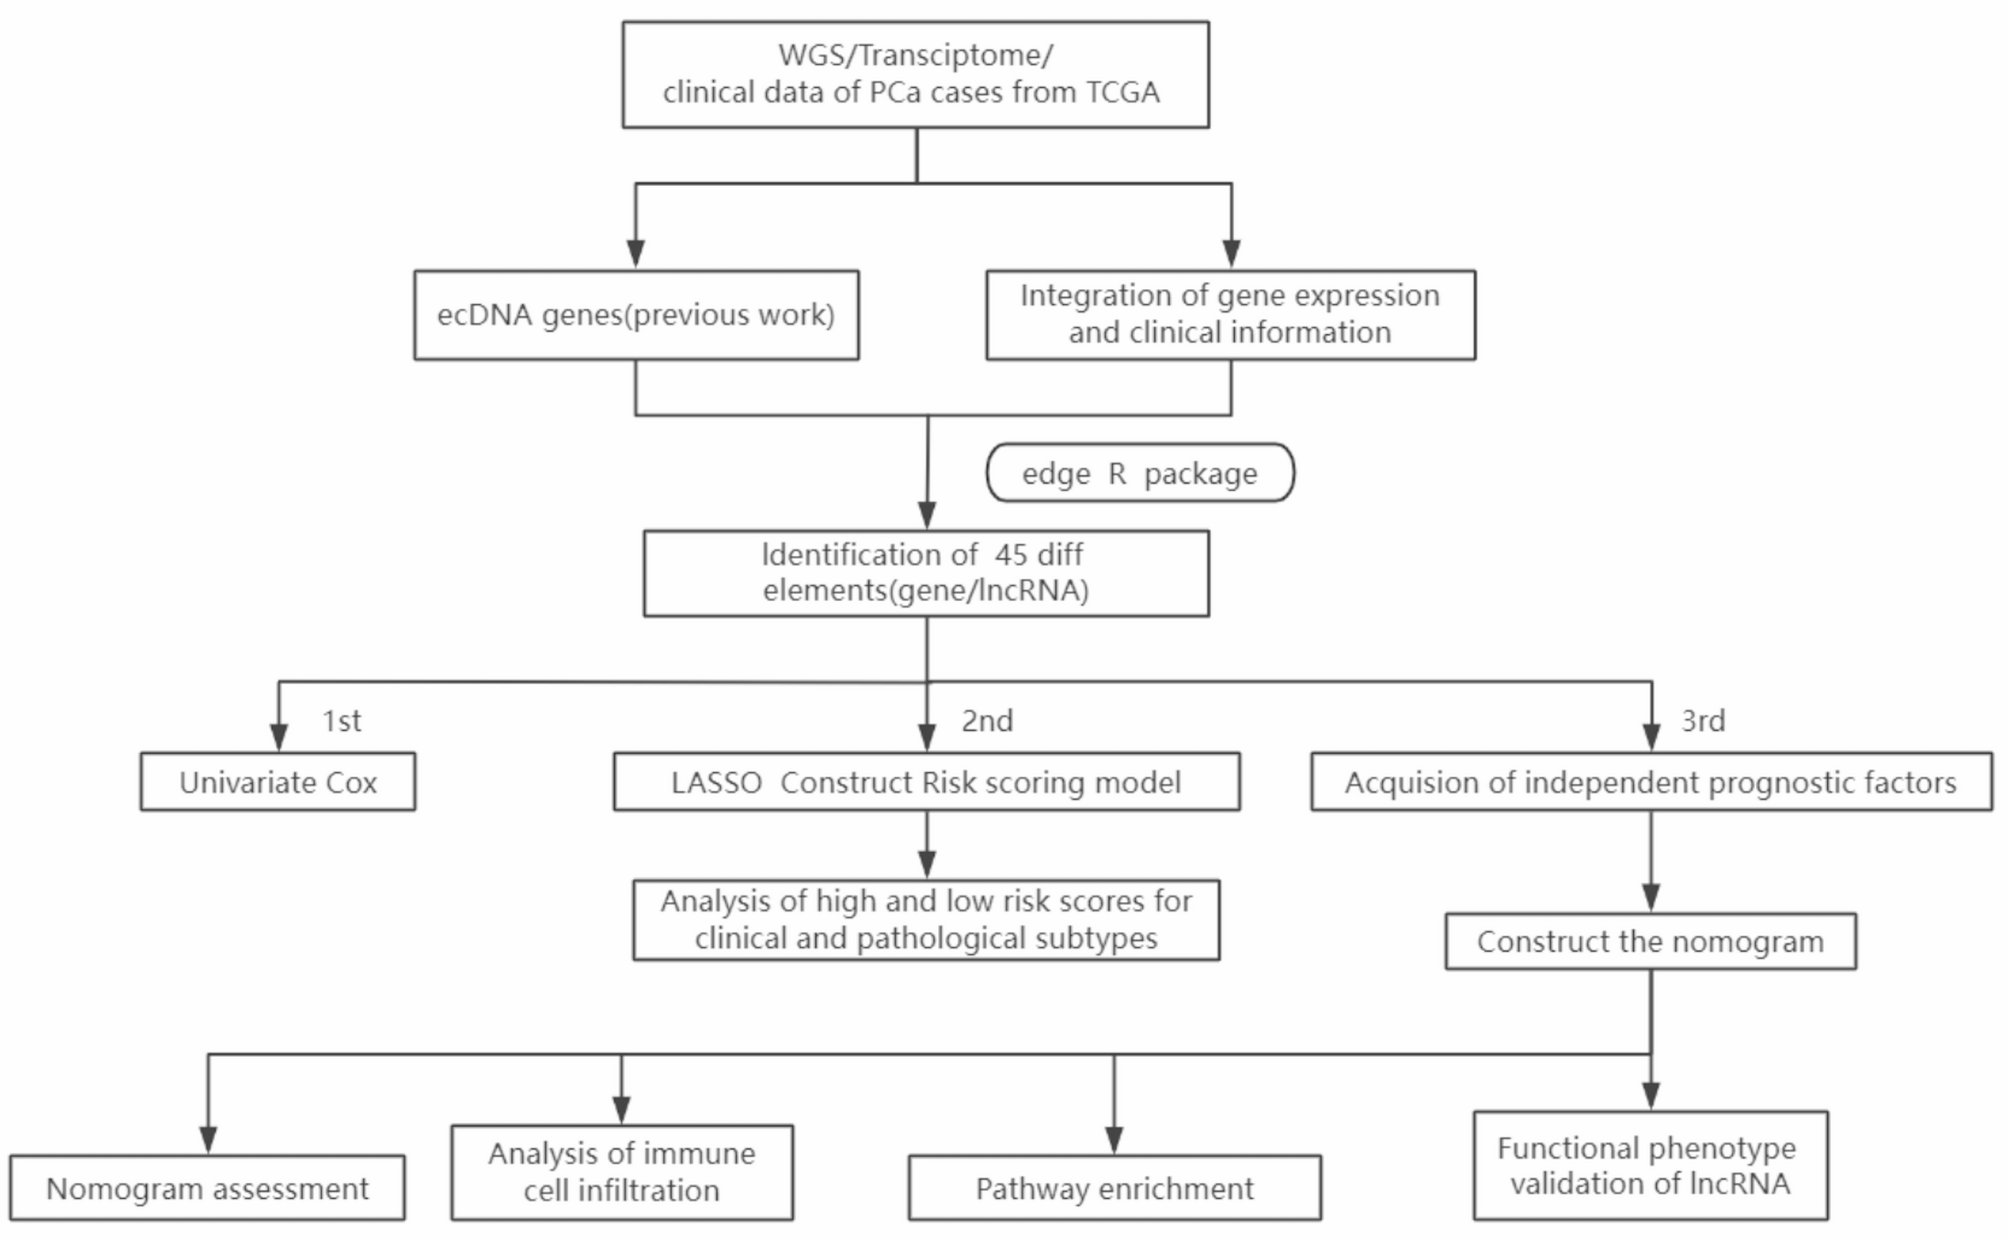

Figure 1 shows the workflow of our entire research. The ecDNA genes of PCa analyzed in this study were obtained from our previous work, the ECGA database (https://www.zhounan.org/ecga/). In ECGA, we analyzed the whole genome sequencing data of a variety of cancers to detect ecDNAs and then identified the sequence carried on ecDNAs, namely ecDNA genes. It included 209 PCa ecDNA genes in total. After removing duplicated records, 194 PCa ecDNA genes were kept for downstream analysis. Among these, 118 relevant coding genes and lncRNAs were further extracted (Fig. 2A). Next, we analyzed their expression difference between the cancer and the adjacent tissue, and got 45 ecDNA genes with significant difference (Fig. 2B). Subsequently, we performed Cox regression analysis to screen ecDNA genes associated with PCa prognosis, identifying eight significantly correlated ecDNA lncRNAs, namely ec-lncRNAs (Fig. 2C). These were then refined using LASSO regression to control overfitting, leading to the development of a risk score model comprising six ec-lncRNAs: AC016394.1, AC016394.2, AL353600.1, AL117336.2, AL121749.2, and ANKRD30A (Fig. 2D-E). Notably, none of these ec-lncRNAs have previously reported specific function. At the same time, this also suggests that ec-lncRNA have more potential application value in PCa compared to coding genes.
Fig. 1
We presented patient data from TCGA as one group set of data for Univariate Cox regression analysis and Lasson regression analysis to calculate the coefficients of selected ecDNA genes, which helps to establish a robust risk score model. The median value of the risk scores was chosen as the cutoff point(0.923956) to categorize into two distinct groups: high-risk and low-risk. This stratification approach ensured a good evaluation and validation of the model’s performance, providing a more reliable and generalizable assessment of its applicability to a diverse range of patients.
Among the six ec-lncRNAs, only AL121749.2 showed a negative correlation with prognosis, acting as a protective factor with low expression in the high-risk group which means that AL121749.2 is positively correlated with prostate cancer patients and good prognosis. The remaining five ec-lncRNAs were identified as risk factors that exhibited a positive correlation with poor prognosis. These ec-lncRNAs showed significantly higher expression levels in the high-risk group compared to the low-risk group, further supporting their role in influencing the adverse clinical outcomes associated with the higher risk category (Fig. 2F). At the same time, we evaluated the predictive power of AUC values for clinical indicators including age, Gleason score, TN staging, and risk score. The ROC curve assessed our risk score model’s ability to predict biochemical recurrence (BCR) in prostate cancer patients. The AUC value of [X] at [timepoint] follow-up indicates [moderate/strong] predictive accuracy, demonstrating the model’s clinical utility for risk stratification. We found that the AUC value of risk score was second only to that of Gleason score (Fig. 2G). In order to build a more efficient model, we will add clinical indicators with independent prognosis to construct a scoring column chart in the future.
Fig. 2
Obtaining ecDNA genes and establishing risk scores. (A) Acquisition of ecDNA-related genes; (B) Differentially expressed ecDNA genes in PCa; (C) Screening for ecDNA genes associated with PCa prognosis; (D-E) Lasso regression simplifies the genes required for constructing risk scores; (F) The expression differences of genes constructed by scoring in high and low scoring groups; (G) Differences in classification efficacy of risk scores and clinically relevant indicators.
Validation of risk scoring coefficientTo validate the predictive accuracy of the risk score, we conducted a series of evaluations. These included comparing the AUC values with various clinical indicators, calculating the AUC values for predicting BRFS at 1, 3, and 5 years, and analyzing differences between high- and low-risk groups. Specifically, these analyses encompassed comparisons of BRFS, the number of patients experiencing BCR, levels of the risk score, and associations with distinct clinical pathological subtypes. Notably, the calculation of AUC values for 1, 3, and 5 years BRFS predictions revealed the robust predictive capability of the risk score, with AUC values consistently approaching 0.7 (Fig. 3D).
Patients classified into the high-risk group exhibited a significantly lower BRFS rate, a greater number of cases of BCR, and notably elevated risk scores. This trend highlights the association between higher risk scores and adverse clinical outcomes, underscoring the utility of the risk score in stratifying patients based on their prognosis (Fig. 3A-C). Marked differences were identified between the high-risk and low-risk groups across various clinical pathological subgroups. These distinctions emphasize the stratification’s effectiveness in capturing prognostic disparities within different pathological contexts, including patients aged ≤ 60 years, T3 stage, N0 stage, and Gleason score ≤ 7, where the high-risk group exhibited notably lower BRFS (Fig. 3E-H).
Fig. 3
Performance of risk score in clinical data and pathological subtypes. (A) Differences in risk scores between high and low-risk groups; (B) Differences between high-and low-risk groups for biochemical recurrence(BCR); (C) Differences in biochemical recurrence free survival(BRFS) rates between high and low-risk groups; (D) Risk score in 1/3/5 years classification effectiveness; (E, F,G, H) Differences in BRFS between high-risk and low-risk groups in pathological subtypes(age ≤ 60;T3 Stage; N0 Stage; Gleason score ≤ 7)
Construction and validation of risk scoring model nomogramIn an effort to enhance the predictive accuracy of the model, we conducted an in-depth examination of potential clinical predictors. Through univariate Cox regression analysis, several variables were identified as relevant, including age, T stage, N stage, Gleason score, and risk score. Among these, TN stage and Gleason score were highlighted as significant factors associated with BRFS in patients with PCa, underscoring their critical role in influencing prognosis (Fig. 4A). Further validation through multivariate Cox regression analysis reinforced the significance of T stage and Gleason score, identifying them as independent predictors of BRFS. This finding highlights their distinct and critical roles in influencing patient outcomes, independent of other clinical factors (Fig. 4B). Among the AUC values of various clinical factors, only the Gleason score outperformed our risk score. The insights gained from these findings guided the creation of a prognostic nomogram that incorporates both the Gleason score and the risk score. This model serves as a valuable resource for clinicians, enabling a thorough and integrated evaluation of patient prognosis to support clinical decision-making (Fig. 4C).
To assess the predictive accuracy of our nomogram, we evaluated its classification performance against other clinical indicators, its efficiency at 1-, 3-, and 5-year intervals, and its clinical utility through calibration curves analysis for BRFS prediction. Results showed that incorporating the Gleason score significantly enhanced the model’s classification efficiency, particularly for 1-, 3-, and 5-year predictions. Specifically, the prediction model had an AUC value of 0.827, a cutoff value of 3.167, a sensitivity of 0.837, and a specificity of 0.715 for 1-year prediction; an AUC value of 0.786, a cutoff value of 2.956, a sensitivity of 0.860, and a specificity of 0.586 for 3-year prediction; an AUC value of 0.798, a cutoff value of 2.956, a sensitivity of 0.849, and a specificity of 0.694 for 5-year prediction (Fig. 4D-E). Additionally, calibration curves demonstrated substantial clinical utility of the nomogram, underscoring its potential benefits for managing PCa patients (Fig. 4F).
Fig. 4
Construction and efficacy verification of prognostic nomogram. (A, B) Univariate and multivariate independent prognostic analysis of clinical indicators; (C) Prognostic nomogram scores for BRFS at 1/3/5 years; (D) Differences in classification efficacy of nomogram and clinically relevant indicators; (E) nomogram in 1/3/5 years classification effectiveness; (F) Calibration curves evaluation of the accuracy of 1/3/5 years BRFS in patients
Pathway enrichment and immune cell infiltration analysisTo explore how lncRNAs on ecDNA affect PCa prognosis, we performed KEGG and GO pathway enrichment analyses by utilizing GSEA’s R language package. The results indicated that high-risk groups were primarily enriched in immune-related pathways, such as NK cell-mediated cytotoxicity and T cell activation regulation (Fig. 5A-B). Immune cell infiltration analysis revealed marked variations in specific immune cell populations between high- and low-risk groups. Notably, differences were observed in cells like resting CD4 + T cells(P value < 0.05), regulatory T cells (P value < 0.01), and M2 macrophages(P value < 0.001), highlighting the potential impact of these cells on the distinct immune landscapes associated with each risk group (Fig. 5C). These findings imply that lncRNAs on ecDNA may contribute to tumor progression by altering the tumor immune microenvironment.
Fig. 5
Pathway enrichment and immune cell infiltration analysis. (A, B) GO and KEGG pathway enrichment analysis revealed that high-risk groups were enriched in immune related pathways; (C) Infiltration differences of immune related cells in high-risk and low-risk group. Results are presented as mean ± SD. *P < 0.05;**P < 0.01;***P < 0.001
Cellular function validation of ec-lncRNA AC016394.2To confirm the functional relevance of these ec-lncRNAs to PCa progression, we examined the expression patterns of the six ec-lncRNAs comprising the risk score (Expression data from TCGA). Among them, the ec-lncRNA AC016394.2, which showed the highest average expression in PCa, was chosen for functional validation in PCa cells (Fig. 6A).
We evaluated AC016394.2 expression in commonly used PCa cell lines and identified higher expression level in PC3 and DU145 cells compared to others (Fig. 6B). Accordingly, knockdown experiments targeting AC016394.2 were conducted in these two cell lines, the expression of AC016394.2 gene was significantly decreased by SiRNA knockdown in PC-3/DU145 cells (Fig. 6C). CCK8 and colony formation assays showed a marked reduction in cell proliferation following AC016394.2 knockdown (Fig. 6D-F). Furthermore, migration and invasion assays revealed a substantial reduction in the PCa cells to migrate and invade following the knockdown, underscoring the critical role of the targeted gene in promoting these aggressive cellular behaviors (Fig. 6G).
These findings highlight the pivotal role of ec-lncRNA AC016394.2 in regulating the behavior of PCa cells, providing valuable perspectives on its potential as both a prognostic marker and a therapeutic target. Further research is essential to uncover the precise molecular mechanisms by which AC016394.2 contributes to PCa progression and malignancy.
Fig. 6
Cellular Functional Validation of ec-lncRNA AC016394.2. (A) The expression differences of 6 ec-lncRNAs that constitute the risk score in tumor and normal tissues (Expression data from TCGA); (B) Expression differences of AC016394.2 in common PCa cell lines; (C) The expression of AC016394.2 was knocked down in PC3 and DU145 cells to investigate its functional role in prostate cancer progression; (D-E) CCK-8 assays were conducted to evaluate the impact of AC016394.2 knockdown on the proliferative capacity of PC-3 and DU145 cells, offering quantitative insights into its role in cell growth; (F) Colony formation assays were performed to evaluate the proliferative capacity of PC-3 and DU145 cells following AC016394.2 knockdown, providing insights into its role in tumor cell growth; (G) Transwell assays were utilized to assess the migratory and invasive capabilities of PC-3 and DU145 cells after AC016394.2 knockdown. Representative images were captured, with scale bars set at 200 μm for reference. Results are presented as mean ± SD. **P < 0.01;***P < 0.001;****P < 0.0001. Data were obtained from three independent experiments. Student’s t test was used to determine the difference between two groups of experiments
Comments (0)