
Remember me
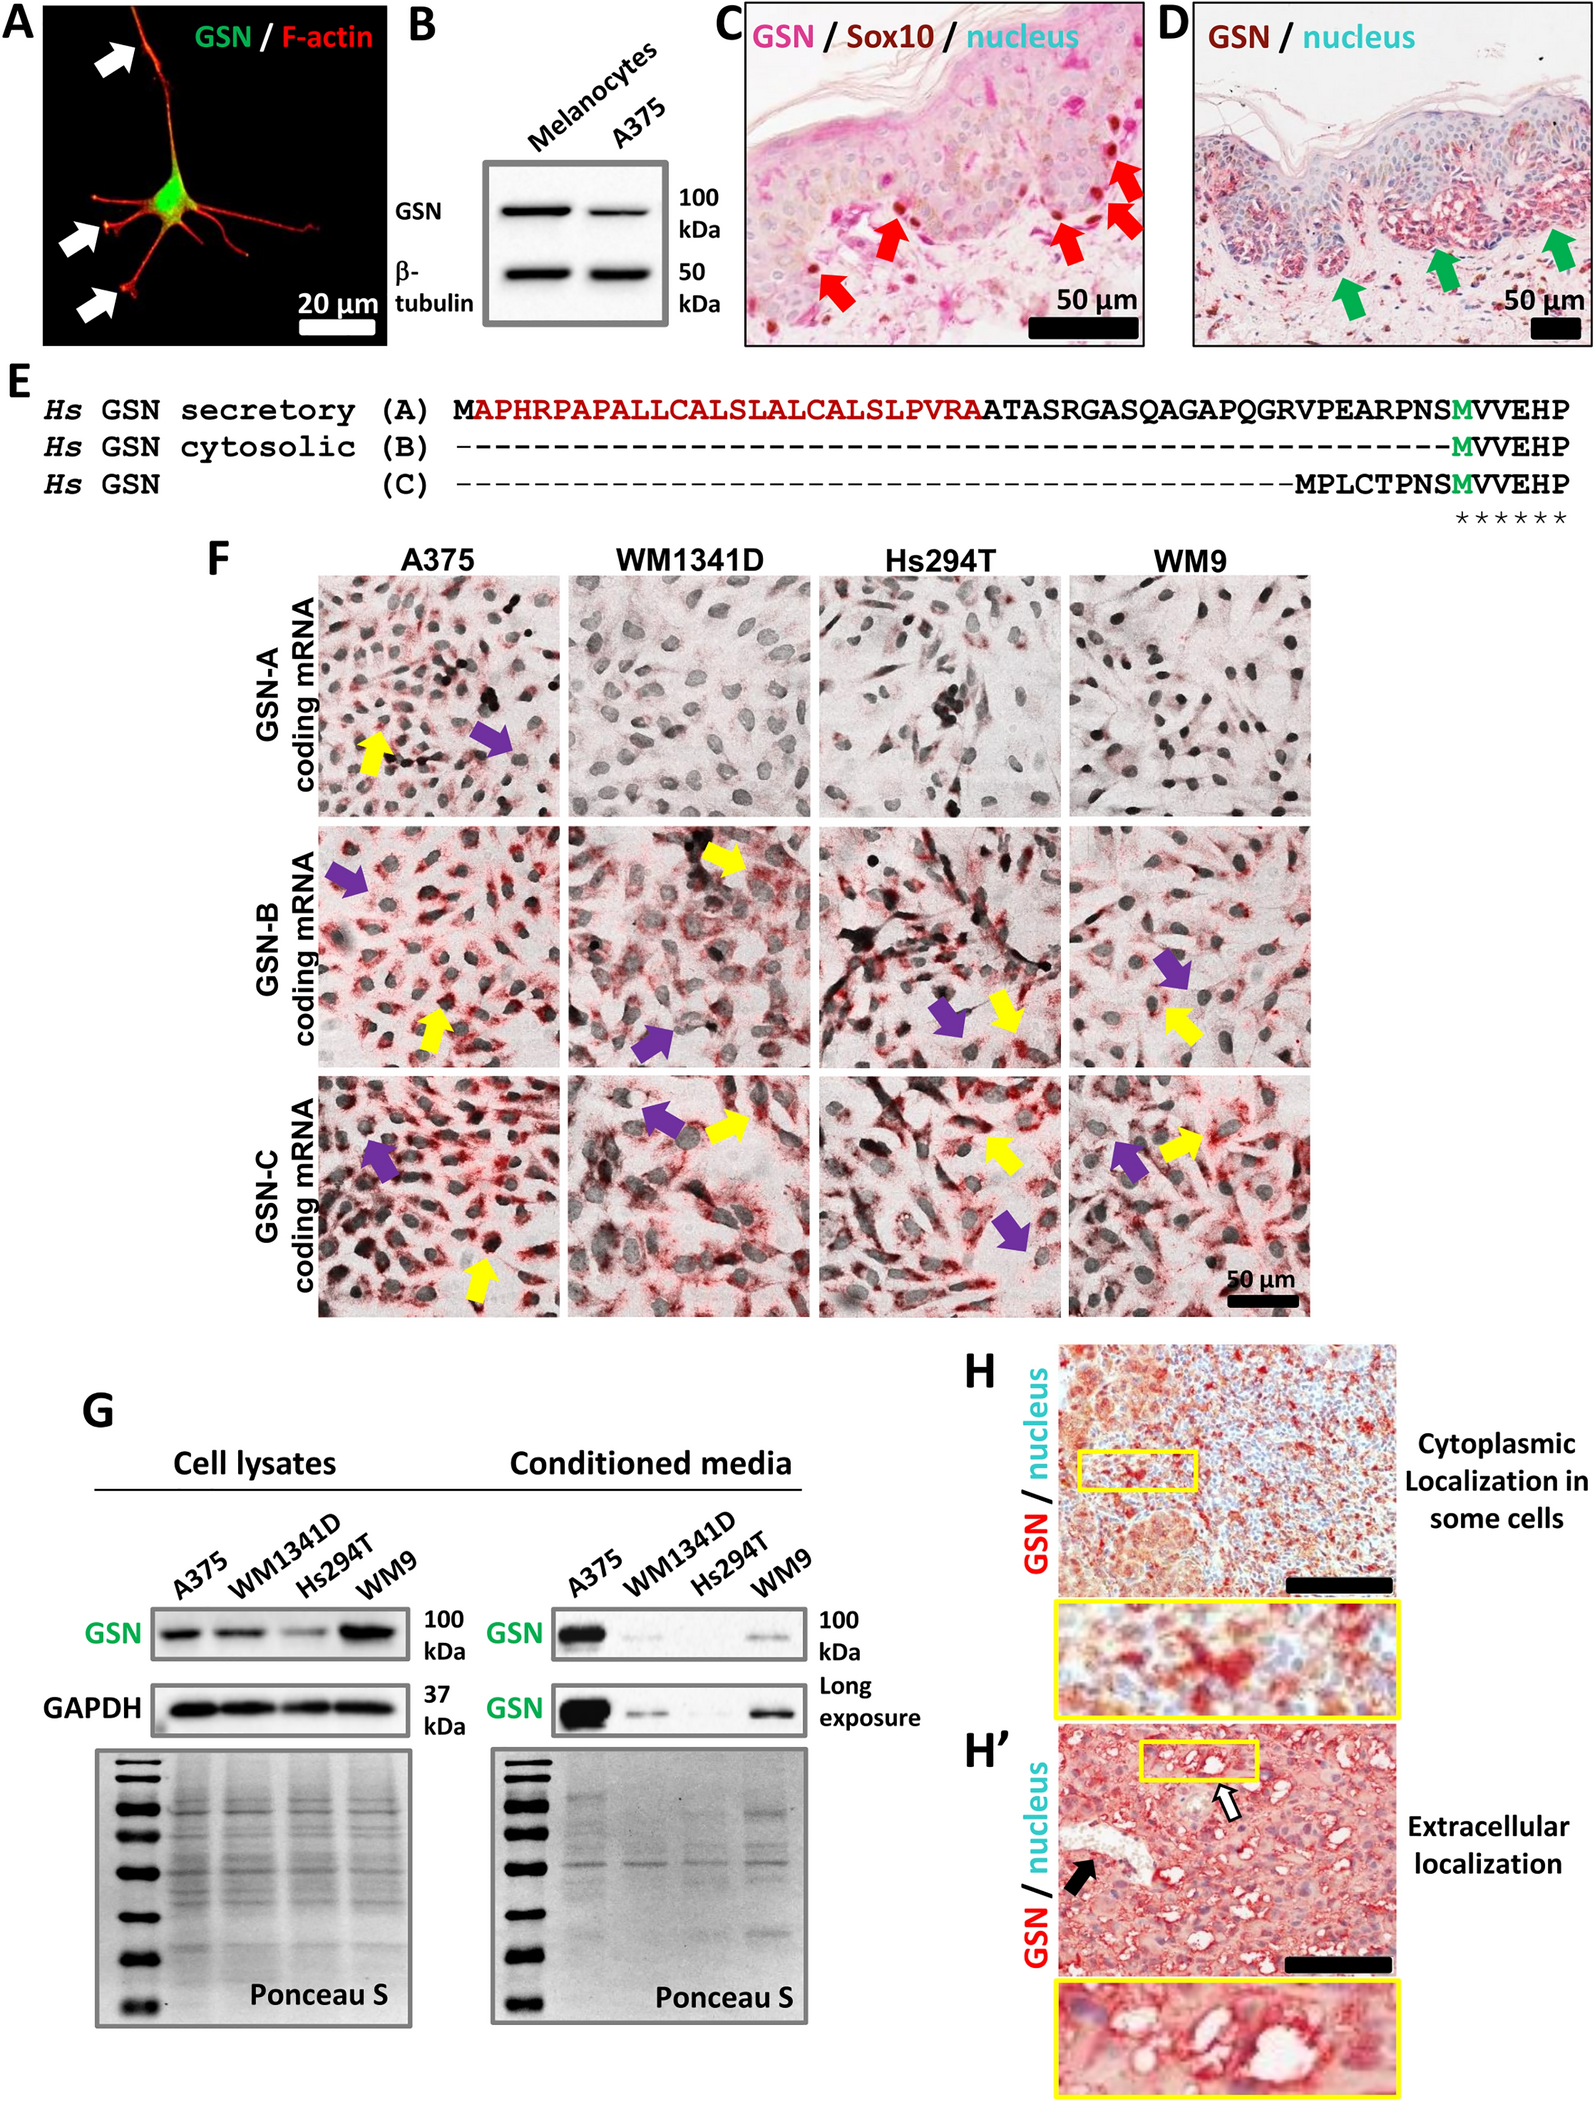

A375 (Cellosaurus #CVCL_0132) and Hs294T (Cellosaurus #CVCL_0331) cell lines were obtained from ATCC©, while WM1341D (Cellosaurus #CVCL_6787) and WM9 (Cellosaurus #CVCL_6806) cells came from Rockland Immunochemicals Inc. Dulbecco’s modified Eagle’s medium (with a reduced concentration of NaHCO3 at 1.5 g/l) was supplemented with 10% FBS, 1% L-Glutamine, and 1% Antibiotic–Antimycotic from Thermo Fisher Scientific. The cell lines were free of Mycoplasma and cultured following the suppliers’ recommendations. Cells were maintained at 37 °C in a humidified atmosphere of 5% CO2 and split twice a week. A375 cells with GSN knock-out and control clones were generated using the CRISPR/Cas9(D10A) technique and are described elsewhere [23, 58]. Normal human melanocytes from adult donors (NHEM-Ad) were obtained from Lonza and cultured in MGM™−4 Melanocyte Growth Medium-4 BulletKit™ according to the manufacturer. Only early passage NHEMs were used for the analysis to prevent dedifferentiation cells.
Patient samples and immunohistochemistry (IHC)Healthy skin fragments were collected from patients who underwent surgery for non-skin-related diseases. Patients with cutaneous melanoma who were diagnosed and treated at the Regional Oncology Centre in Opole, Poland, between 2005 and 2010 were included in the study. Enrollment of patients was based on the availability of medical documentation and paraffin blocks containing primary skin tumors. This study was conducted in accordance with The Code of Ethics of the World Medical Association (Declaration of Helsinki) related to experiments involving humans, and patient consent was obtained. The study received review and approval from the ethics committee at Wroclaw Medical University, Poland (No 580/2019). Tissue microarrays (TMAs) comprising three 1.5 mm tissue cores from each tumor were created automatically (TMA Grand Master, Sysmex). Immunohistochemical analysis was performed using rabbit polyclonal anti-GSN-Antibody (Abcam) or rabbit monoclonal anti-Sox10 antibody (Cell Marque Antibodies) on 4-μm-thick paraffin sections mounted on silanized slides (Agilent DAKO, Santa Clara, CA, USA). The slides underwent automated dewaxing, rehydration, and heat-induced epitope retrieval with EnVision Target Retrieval Solution (Agilent DAKO) for 30 min at 97 °C in the PT Link Pre-Treatment Module for Tissue Specimens (DAKO). Liquid Permanent Red (Agilent DAKO) was used as the detection system. Negative controls were processed using FLEX Rabbit Negative Control, Ready-to-Use, instead of the primary antibody. The antibodies used and their dilutions are listed in Table S1.
Evaluation of transcript levels in normal skin and human melanoma samplesTranscript expression data were downloaded from UCSC Xena [59]. More specifically, UCSC TOIL RNA-seq recomputed data processed with RSEM expected counts (version 2016-09-02) were used [60]. For downstream analyses, we used a subset of the UCSC TOIL recomputed data, which included GTEX skin – 555 RNA-seq profiles of skin obtained from healthy individuals; TCGA SKCM – 469 RNA-seq profiles of human skin cutaneous melanoma obtained from The Cancer Genome Atlas (TCGA) [61, 62]. GSN transcripts were annotated using the GENCODE version of the human genome (Release 23/GRCh38.p3) [63]. Specific GSN transcripts were assigned to three GSN isoforms (A, B, and C) using the archived Ensembl database (version 80) [64]. For the GSN-B isoform consisting of three transcripts, rounded RSEM expected counts were summed. Subsequently, the entire dataset was transformed to log2(Transcripts per Million + 1) values using the CustomSelection package [65]. All statistical analyses were performed in R (version 4.4.2). Violin plots were generated using the ggpubr (Kassambara A (2023). ggpubr:'ggplot2'Based Publication Ready Plots. R package version 0.6.0.999, https://github.com/kassambara/ggpubr) and tidyverse [66] packages. TPM levels of GSN isoforms between healthy and tumor tissues were compared using the Kruskal–Wallis test. A p-value ≤ 0.05 was considered statistically significant.
Xenotransplantation of the cells into Danio rerio larvaeThe cells were suspended at a density of 1 × 10^6/ml and then labeled with Vybrant™ DiI Cell-Labeling Solution (Thermo Fisher Scientific) at a concentration of 5 µl/ml, following the manufacturer’s instructions. Two days post-fertilization (dpf), zebrafish embryos were anesthetized with 0.003% tricaine (Sigma-Aldrich, St. Louis, MO, USA) and placed on a 10 cm Petri dish coated with 1% agarose. The labeled cell suspension was introduced into the yolk sac via microinjection in 2 µl (approximately 300 cells/embryo). Successfully injected embryos were selected two hours post-injection (dpi). All larvae were incubated at 31 °C for three days (72 h). According to Directive 2010/63/EU on protecting animals used for scientific purposes, zebrafish are considered self-feeding larval forms up to 120 h post-fertilization (hpf), meaning for the first five days of life, and are therefore not classified as animals; thus, ethical approval from the authorities is not required. At the end of the observation period, images of the fish from each group were captured to monitor tumor cell growth. A Discovery V8 Stereo optical microscope and Zeiss hardware were used for the observations. ImageJ software was utilized to calculate the area of tumor cell growth.
BaseScope™ assayThe in situ hybridization BaseScope™ 2.5 Chromogenic Assay (Advanced Cell Diagnostics) was performed according to the manufacturer’s protocol. The cells were seeded in 8-well Nunc Lab-Tek II Chambered Coverglass chambers (Thermo Fisher Scientific). After 24 h, upon reaching 70–80% confluency, the cell medium and the chambers were removed, and the cells were fixed in 10% Neutral Buffered Formalin (Sigma-Aldrich) for 30 min at room temperature. Following three washes in 1 X PBS, the cells were dehydrated using 50, 70, and 100% EtOH for 5 min. The cells were then left in 100% EtOH for an additional 10 min and stored in 100% EtOH at − 20 °C until ready for use. On the day of the assay, the cells were rehydrated by incubating with 70% EtOH for 2 min, 50% EtOH for 2 min, and finally with 1 X PBS for 10 min. A hydrophobic barrier was created between distinct samples using an Immedge hydrophobic barrier pen. Next, the cells were treated with Hydrogen Peroxide for 10 min at room temperature. The slides were washed in 1 X PBS and treated with diluted Protease III (1:15 in 1 X PBS) for 10 min at room temperature. The slides were washed in PBS. From this point forward, all incubations were performed in a wet chamber and oven (steps involving incubation at 40 °C). Target probes (with used probes and their targets listed in Table S2), along with the positive (PPIB) and negative (dapB) control probes, were added to designated samples and incubated for 2 h at 40 °C. After that time, the cells were washed for 2 min in 1 X Wash Buffer two times, and the first hybridization began by adding AMP 1 to completely cover the section, followed by incubation of the slides for 30 min at 40 °C. The cells were washed and incubated with AMP 2 for 30 min at 40 °C, AMP 3 for 15 min at 40 °C, AMP 4 for 30 min at 40 °C, AMP 5 for 30 min at 40 °C, AMP 6 for 15 min at 40 °C, AMP 7 for 30 min at room temperature, and AMP 8 for 15 min at room temperature. Two washes separated each of the steps mentioned above using 1 X Wash Buffer for 2 min. To detect the signal, the Red B solution was diluted in the Red A solution at a 1:60 ratio, immediately added to the slides, and incubated for 10 min at room temperature in darkness. After this step, the slides were washed with water, counterstained with 50% Hematoxylin for 2 min at room temperature, washed three times in water, and submerged in a 0.02% ammonia water solution. Following 10–15 s of incubation, the slides were washed with water approximately three times, and then dried in a hybridization oven for 15 min at 60 °C, after which they were mounted using VectaMount Permanent mounting medium (Vector Laboratories). The slides were air-dried and analyzed with a Leica Stellaris 8 Confocal Laser Scanning Microscope and Leica Application Suite X (LAS X) since the FastRed dye also provides fluorescence. Cell nuclei stained with Hematoxylin were visualized by transmitted light.
Clonings and transfectionsCells were transfected with plasmids, the generation of which is detailed in Table S3. pLVX-IRES-tdTomato-FlagAkt1 plasmid [67] served as a backbone plasmid to produce plasmids encoding GSN-A, -B, and -C. The RNA isolated from the tested cells using the GenElute™ Mammalian Total RNA Miniprep Kit (Sigma-Aldrich) served as a template for the reverse transcription reaction conducted with the High-capacity cDNA reverse transcription kit with RNase inhibitor (Thermo Fisher Scientific). DNA Phusion Hot Start II High-Fidelity Polymerase (Thermo Fisher Scientific) was used to amplify a cDNA fragment. Linearized plasmid and inserts were separated via polyacrylamide gel electrophoresis. All cloning procedures were performed with the NEBuilder HiFi DNA Assembly Cloning Kit (New England BioLabs Inc.).
For stable transfection, cells with GSN knock-out growing in a 35 mm plate were transfected with the appropriate plasmid: pLVX-CMV-zeo, pLVX-CMV-zeo-GSN-A, pLVX-CMV-zeo-GSN-B, or pLVX-CMV-zeo-GSN-C, which code for GSN-A, -B, or -C, respectively, under the CMV promoter and carrying zeocin resistance, using Lipofectamine 3000 (Thermo Fisher Scientific) according to the manufacturer’s recommendations. After deriving the stable lines using the protocol described elsewhere [56], they were verified through immunocytochemistry and Western blot analyses to confirm GSN production. The stable A375 cell clones were cultured in a medium containing 1 µg/ml puromycin from Santa Cruz Biotechnology Inc. and 50 μg/ml zeocin from Thermo Fisher Scientific.
Coating the plates and dishes with laminin-1According to the manufacturer's instructions, a laminin-1 (Sigma-Aldrich) solution in Hanks’ Balanced Salt Solution (HBSS) (Thermo Fisher Scientific) at a concentration of 1 µg/cm2 was used to coat the coverslip or the cell culture dish. The plates and coverslips with the coating solution were incubated for at least 4 h at 37 °C in a humidified atmosphere containing 5% CO₂. Before seeding the cells, the coated surface was washed three times with PBS.
Colony formation assayFive hundred cells per clone were seeded into a well of a 6-well plate containing complete medium. Seven days later, the cells were washed twice with ice-cold PBS and fixed and stained using a staining solution (0.1% crystal violet, 25% methanol in PBS) for 25 min in the dark at room temperature. Next, the cells were washed again with ice-cold PBS to remove any excess stain. Images of the cell colonies were captured, followed by incubation with 10% acetic acid to destain the cells until they became transparent. The absorbance of the dissolved crystal violet was measured at 550 nm using a plate reader.
Collection of conditioned mediaConditioned medium was collected from a cell culture grown in a 25 cm2 culture flask. Cells cultivated in complete medium were washed three times with warm, sterile PBS after reaching approximately 80% confluence and were subsequently cultured in serum-free medium. Conditioned medium was collected after 24 h. To eliminate larger cellular fragments (e.g., apoptotic bodies) and dead cells, the conditioned medium was centrifuged at 4 °C for 20 min at 7000 × g. The collected medium (4.5 ml) was filtered through a 200 nm membrane and then concentrated to approximately 0.5 ml using Amicon Ultra-15 Centrifugal Filter Units with a 10 kDa cutoff through centrifugation at 4 °C at 4000 × g.
XTT assayTo perform the XTT assay for assessing mitochondrial metabolic activity, 2000 cells were seeded into a well of a 96-well plate and incubated for 72 h. The assay was then conducted using the CyQUANT™ XTT Cell Viability Assay Kit, following the manufacturer's instructions. The XTT reagent includes tetrazolium salts that are sensitive to the cells' oxidation–reduction potential. These salts are cleaved into formazan through a complex cellular mechanism, which directly correlates with the number of metabolically active cells in the culture. Sample absorbance was measured at 450 and 630 nm using a µQuant plate reader.
Invasion assayTranswell™ filters (BD Bioscience) were incubated for 24 h in PBS buffer in an atmosphere of 5% CO2 at 37 °C. A 1 mg/ml solution of Matrigel™ was then prepared in a serum-free medium and added in a volume of 100 µl to each insert. To polymerize the Matrigel™, the inserts were incubated for 1 h in an atmosphere of 5% CO2 at 37 °C. Cells were cultured in a serum-free medium for 24 h and then subjected to an invasion assay. Cells were trypsinized and counted using a Bürker chamber, and 100,000 cells were plated in serum-free medium in a Transwell™ filter onto a layer of Matrigel™. A 20% (v/v) FBS solution was used as a chemoattractant in a well of a 24-well plate. After 24 h of incubation in 5% CO2 at 37 °C, the cells and the Matrigel™ layer were carefully removed from the inner part of the Transwell™ filter. The cells that had passed through the Matrigel™ layer to the underside of the insert membrane were fixed with a 4% (w/v) formaldehyde/PBS solution and stained with Hoechst 33342, and their nuclei were counted using a FluoView 500 confocal microscope. The experiment was repeated six times for each clone.
Immunocytochemistry (ICC)For immunocytochemical staining, cells were seeded on sterile coverslips placed in the wells of a 24-well plate. Forty-five thousand cells were seeded for 24 h, and thirty thousand for 48 h. Samples for TIRF microscopy were prepared by seeding fifteen thousand cells per well in a Nunc™ Lab-Tek™ Chambered Coverglass (Thermo Fisher Scientific) and incubating the cells for 48 h. Cell fixation was performed by incubating for 20 min at room temperature in a 4% (w/v) formaldehyde/PBS solution. The following cells were incubated in PBS containing 0.1% (v/v) Triton X-100 at room temperature for 6 min and then blocked with 1% (w/v) BSA in PBS at room temperature for 30 min. The coverslips were incubated overnight at 4 °C with a solution of primary antibodies diluted in a blocking solution. Next, the slides were washed three times for five minutes each in PBS and then were incubated for one hour at room temperature in a solution of secondary antibodies diluted in 1% (w/v) BSA in PBS buffer. The cells were washed three times in PBS and once in deionized water and mounted on a microscope slide using Dako mounting medium (Agilent). The antibodies and fluorescent dyes used are listed in Table S1.
Confocal imagingImages were taken using a TCS SP8 (Leica) or Stellaris 8 (Leica) confocal laser scanning microscope unless otherwise stated. Typically, all photos were captured with the HC PL APO CS2 63x/1.4 oil objective, and fluorescence detection ranges were configured to capture signals from specific dyes. The detection ranges did not overlap, and the “switch between lines” mode was generally employed for scanning. The pixel size was set to 0.059 μm. Optimal excitation laser wavelengths for specific dyes were adjusted in the case of Stellaris 8 (equipped with a tunable White Laser), while for SP8 imaging, we used fixed wavelength laser lines. Some images (Fig. 2B) taken with Stellaris 8 were acquired using the Lightning module with the “Lightening Grade” parameter set to maximum resolution, “Strategy” set to “Adaptive,” and “Refractive Index” set according to the RI of the mounting medium. Leica Application Suite X (LasX) was utilized to acquire images. The antibodies and fluorescent dyes used are listed in Table S1.
F:G actin ratio assayThirty thousand cells were plated on either non-coated or laminin-1-coated slides within a 24-well plate. After 48 h, the cells were fixed with 4% (w/v) formaldehyde/PBS. The cells were subsequently stained with phalloidin conjugated to the fluorescent dye Alexa Fluor® 488, which binds to F-actin, and with DNase I conjugated to the fluorescent dye Alexa Fluor® 594, which binds to G-actin. Images were captured using a TCS SP8 (Leica) confocal laser microscope in “z-stack” mode, scanning the cells in layers. The F-actin to G-actin ratio was analyzed using the Fiji program. The Z-Projections plug-in was utilized to sum the signal intensity for F- and G-actin separately from all layers of the cell image. Next, the Ratio Plus plug-in was employed to visualize the F:G actin intensity ratio. In the following step, the sum of the pixel values of the image was measured, representing the F-actin to G-actin ratio in the cell. Lookup tables and Rainbow RGB were used to display the cell's F:G actin ratio in a color gradient. Ten cells per cell clone were analyzed, resulting in a total of 30 analyzed cells for each clone group. The data are presented as the mean of the F-actin to G-actin ratio. The analysis was conducted based on a modified protocol described elsewhere [68].
Gelatin digestion assayThe procedure was performed as described elsewhere [46]. Poly-L-lysine-coated coverslips placed in a 24-well plate were washed with PBS and treated with 0.5% (v/v) glutaraldehyde solution for 15 min at room temperature. The slides were then washed with PBS and incubated for 10 min in a drop of 0.2% (v/v) gelatin-fluorescein solution in PBS. Subsequently, the slides were incubated for 1 min in a 5 mg/ml sodium borohydride solution in PBS before being washed with PBS. Next, 30,000 cells were seeded on each slide coated with the gelatin-fluorescein solution and cultured for 12 h in a complete culture medium at 37 °C in a 5% CO2 atmosphere. The cells were then fixed with a 4% (w/v) formaldehyde/PBS solution for 20 min at room temperature. In the next step, F-actin was stained with phalloidin conjugated to Alexa Fluor® 568 dye, while cell nuclei were stained with Hoechst 33342 dye. Images were captured using a TCS SP8 (Leica) confocal laser microscope with Leica Application Suite X (LAS X) software. The gelatin-etched area per single cell was analyzed using Fiji software, with thirty cells per clone group analyzed, and the result was presented as an average.
Invadopodia number assessmentThe Fiji program was utilized to analyze the number and area of invadopodia per cell, employing the threshold cut and analyze particles tools to project their area. For each cell clone, ten cells were examined, resulting in thirty total cells analyzed for each clone group. Data are presented as the average number of invadopodia per cell and their average area projection.
Filopodia length analysisFor filopodia analysis, cells were seeded onto coverslips that were either uncoated or coated with laminin 1. After 48 h, the cells were fixed and stained with phalloidin-Alexa Fluor® 568. Photographs of the stained cells were taken using a Zeiss Elyra 7 with Lattice SIM and Zen Black software (Zeiss, Jena, Germany) in TIRF mode. Data analysis was conducted with ImageJ software (ImageJ, F. Cordelieres, Institute Curie, Paris, France), which enabled the measurement of the lengths of filopodia cell protrusions. Twenty to thirty cells per group were analyzed. Data are presented as the mean length of the longest filopodium per cell.
TIRF microscopyTIRF imaging was conducted using an Elyra 7 Lattice SIM microscope equipped with a 63 × Alpha Plan-Apochromat NA1.46 oil immersion objective. ZEN Black software (version 3.0 SR) was utilized to capture images. The samples were illuminated with laser beams at 488 nm and 568 nm, and beam splitters BP 495–590 and LP 570 were employed. A PCO Edge 4.2 M sCMOS camera collected the fluorescence signal. Processing included merging channels, adjusting brightness (limited to linear changes), applying LUT, and adding scale bars and annotations (e.g., arrows). The antibodies and fluorescent dyes used are detailed in Table S1.
Projected cell area analysisThe projected cell area was determined using images of cells with fluorescently stained F-actin obtained through TIRF microscopy. These images were analyzed in FIJI (1.54f) using a custom-written script. The main steps involved linear contrast enhancement and filtering with a Gaussian Blur filter, with a sigma parameter set to 10 pixels. This latter step improved cell detection by blurring the edges of the filamentous structures. The FIJI plug-in Cellpose detected cells [69] with the employed model “cyto3” and the diameter set to 30 or 0. The subsequent data were processed in R (version 4.3.1). Objects smaller than 300 µm2 were excluded from the analysis. A total of 108 cells were analyzed for the laminin 1 coating condition, while 106 cells were analyzed for the non-coating condition.
High-content screening system (HCS) to assess the level of adhesion proteins and the spreading of the cellsCells were cultured and stained in PhenoPlate 96-well, black, optically clear, flat-bottom plates (Revvity). After fixation with 4% (w/v) formaldehyde/PBS, permeabilization with 0.1% (v/v) Triton X-100 in PBS, and blocking with 1% (w/v) BSA in 0.1% (v/v) Triton X-100/PBS, the cells were stained with a combination of anti-integrin β1 or pFAK397 IgG/DAPI/Deep Red Cell Mask and imaged using the Opera Phenix Plus (Revvity) with a 63 × water immersion objective with NA 1.15 (Zeiss). DAPI was excited with a 405 nm laser line, donkey anti-mouse/rabbit-Alexa Fluor™ IgG with a 488 nm laser line, and Cell Mask Deep Red with a 633 nm laser line. Antibodies, as well as fluorescent dyes and their dilutions, are listed in Table S1. Harmony software (version 5.1, Revvity) was used to build a sequence for image analysis blocks to assess the projected cell area and accumulation of β1 integrin at the plasma membrane. The analysis focused on three main blocks: “Find Nuclei,” “Find Cytoplasm,” and “Select Cell Region.” The last block separated the membranous region by expanding the outer cell border (defined by mask staining) by 30% and contracting the outer cell border toward the cell`s interior by 2% (Fig. S10A-A’). All cells touching the image border were removed from the analysis to focus only on the cells present in the image area. Cell Mask Deep Red was used to delineate cells.
pFAK-rich spots were counted in Harmony software (version 5.1). Briefly, maximum intensity projection from the three upper slices was performed for each field of view. The membrane region was defined using the “Select Cell Region” building block, with the outer border set at 20% and the inner border set at 13% (Fig. S10B-B’). The background was removed to enhance FA detection accuracy by subtracting the Gaussian smoothed pFAK channel (with filter width set to 17 pixels) from the original pFAK channel. The resulting images entered the “Find Spots” building block with the selected detection method “D,” Detection Sensitivity set to 0.11, and Splitting Sensitivity set to 0.5.
Cell migration assaysThe migration tests were performed using the IncuCyte Live-Cell Analysis Imaging System (Sartorius) and the manufacturer's dedicated IncuCyte ImageLock 96-well plates, which enable precise time-lapse imaging at specific locations on the plate. For the spontaneous migration test, 1000 cells were seeded in each well and incubated for 72 h in the IncuCyte Live Cell Analysis Imaging System, capturing images every 2 h. The collected images were analyzed using the ManualTracking plug-in (ImageJ). Three parameters describing the properties of migrating cells were determined: the trajectory of cell movement, the distance covered by the cells, and the directionality of movement. The directionality of movement was calculated as the ratio of the cell's straight-line movement (distance to the starting point) to the total distance covered by the cell [70]. Thirty cells were analyzed for each cell clone. To perform the collective migration test, 120,000 cells were seeded into a well coated with laminin and 40,000 cells into a non-coated well. This was done due to the differing surface areas covered by cells depending on the condition. According to our observations, the contact area of cells growing on laminin-1 with the substrate is significantly smaller than that of cells on a non-coated surface [23]. After 24 h, when the cells reached approximately 100% confluence, a scratch was made on the cell monolayer using a Wound Maker tool (Sartorius). The slides were then transferred to the IncuCyte Live Cell Analysis Imaging System and incubated for 72 h, with images captured every 2 h. Migration analysis was performed using IncuCyte software, and data were presented as a percentage of the scratch covered by cells over time. Six images were analyzed for each cell clone.
Adhesion assayCells were seeded in a serum-free medium supplemented with 0.5% BSA, 2 mM CaCl2, and 2 mM MgCl2 at a density of 35,000 cells per well in a 96-well plate, using either an uncoated or a laminin 1-coated substrate. After 1 h of incubation in a 5% CO2 atmosphere at 37 °C, non-adherent cells were removed by washing five times with PBS buffer supplemented with 2 mM CaCl2 and 2 mM MgCl2. Subsequently, the XTT assay was performed as described above.
Western blot (WB)For Western blotting analysis of cell lysates, cells were seeded into a well of a 6-well plate and cultured for 24 h at 37 °C in an atmosphere of 5% CO2. Then, the cells were washed three times with cold PBS buffer and scraped in the presence of 300 µl of urea lysis buffer (50 mM Tris–HCl, pH 7.5, 8.6% (w/v) SDS, 8.6% (w/v) sucrose, 74 mM urea, 1 mM DTT, 1:100 serine phosphatase inhibitors, 1:100 tyrosine phosphatase inhibitors, and 1:100 protease inhibitor cocktail). The cell lysate was centrifuged at 12,000 × g for 5 min at 4 °C. The supernatant was saved and constituted the test sample. According to the manufacturer's instructions, the protein concentration was measured with the Pierce BCA Protein Assay Kit (Thermo Fisher Scientific) or the Bradford protein assay (Sigma Aldrich). SDS-PAGE was used to separate samples in a 12.5% (v/v) polyacrylamide gel. A semi-wet transfer method was then employed to transfer the separated proteins to a nitrocellulose membrane. Ponceau S nitrocellulose membrane staining was used to control protein loading and transfer efficiency. The membranes were blocked using 5% skimmed milk dissolved in TBS-T buffer (20 mM Tris, 150 mM NaCl, 0.1% (w/v) Tween 20 detergent). Primary and secondary antibodies were diluted in a blocking solution, and their dilutions are listed in Table S1. They were applied to the nitrocellulose membranes and incubated overnight at 4 °C. Unbound antibodies were removed by washing three times with TBS-T buffer. Incubation with HRP-conjugated secondary antibodies diluted in the blocking solution was performed for 1 h, followed by rinsing three times with TBS-T buffer. Protein detection was performed using Clarity Western ECL substrate and the ChemiDoc™MP system. Immunoblots were analyzed using Image Lab software.
Statistical analysisAnalyses were conducted on the data obtained from three OE GSN-CTRL, three OE GSN-A, three OE GSN-B, and three OE GSN-C clones in each experiment, serving as biological replicates. Both graphs and statistical analyses were carried out using GraphPad Prism 7 and 8 (GraphPad Software Inc.). Data presented in the graphs were shown as a mean ± SD. Outliers were identified as values that were two standard deviations below and above the mean. The first step in the statistical analysis involved checking the normality of the data distribution using the Shapiro–Wilk normality test. Further assessments of statistical significance were performed using two-way ANOVA with Dunnett's post hoc multiple comparisons tests. Significance levels were established at p < 0.05 (*), p < 0.01 (**), p < 0.001 (***), and p < 0.0001 (****).
Comments (0)